COIN NAME: $SUI
SIGNAL TYPE : SHORT
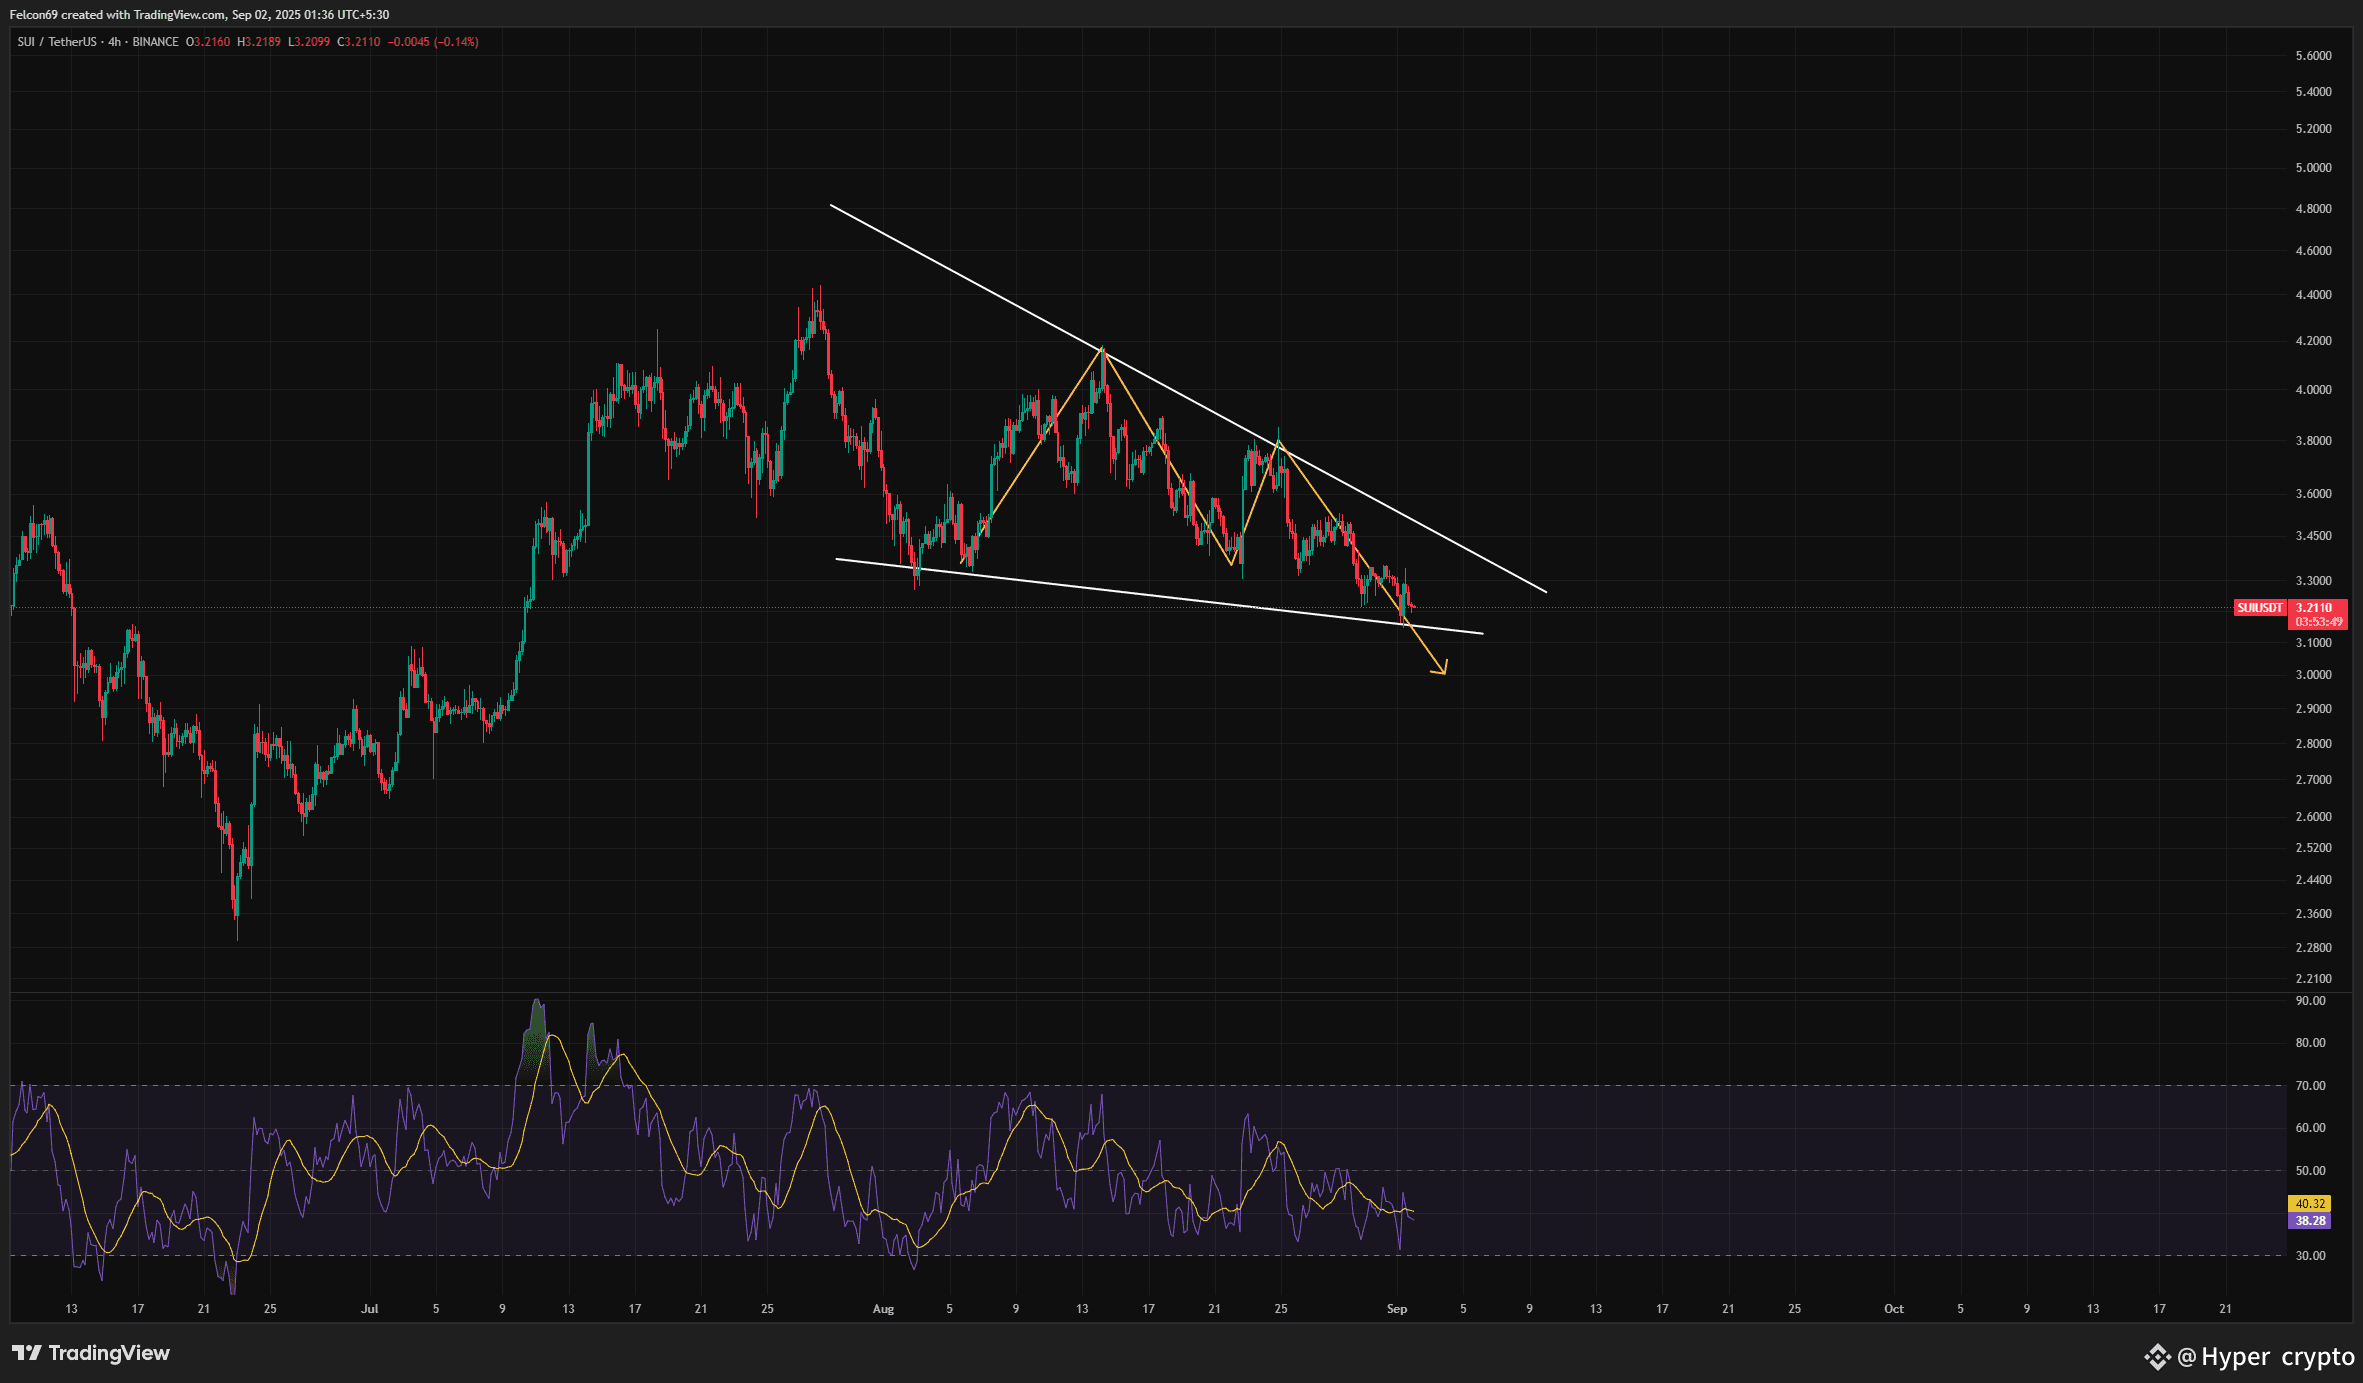
i can see on SUI 4H chart 📊. The price is moving inside a falling wedge pattern 🔻, which often signals a potential bullish reversal but still shows selling pressure in the short term. The trendlines 📉 are converging, with lower highs and lower lows forming the wedge.Currently, SUI is trading around $3.12 💵, very close to the lower wedge support ⚖️. The yellow arrow ➡️ suggests a possible drop toward the bottom support area near $3.00–$2.90 before attempting a bounce.Looking at the RSI (Relative Strength Index) 📉, it sits near 38, which is close to the oversold zone ⛔. This means sellers are dominating, but a relief bounce could come if buyers step in 🟢.👉 In short: The chart shows bearish momentum ⚠️ but within a bullish wedge setup. If support holds, a breakout to the upside 🚀 could follow, but a breakdown below $3.00 ❌ may drag price further down.
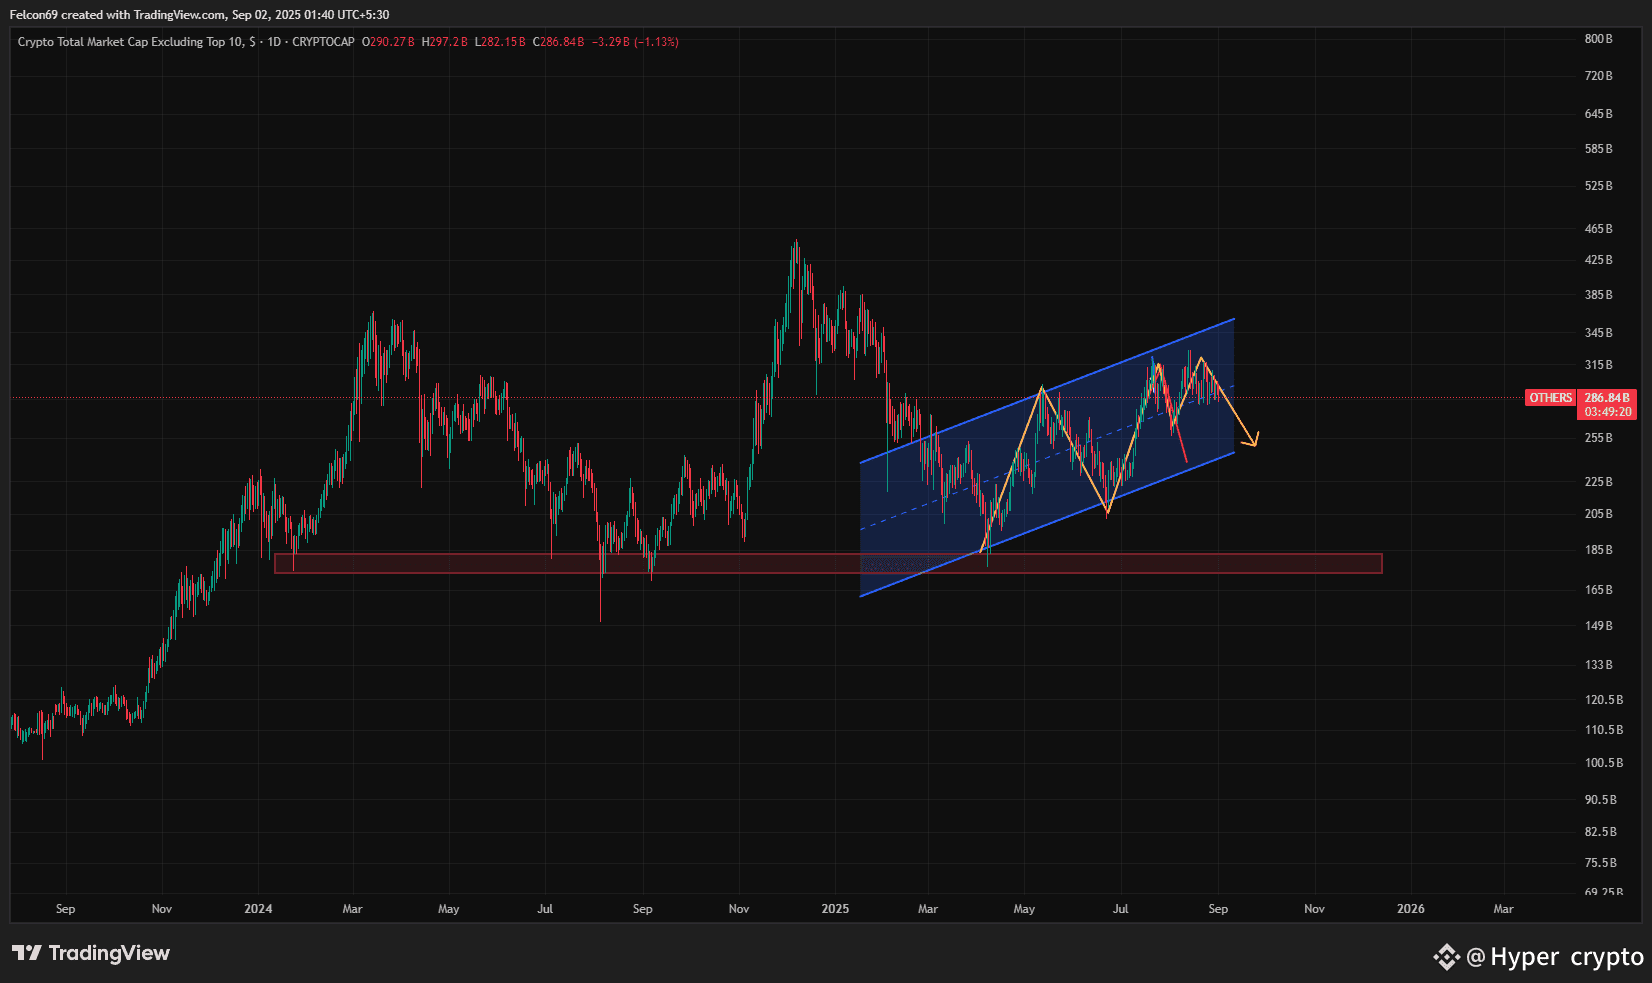
i can see on the 1D timeframe, showing a rising parallel channel 🔵 that has guided price movement since early 2025. Recently, price formed a double-top pattern ⛰️ at the upper boundary of the channel, suggesting weakening bullish momentum ⚠️. The yellow arrow ⬇️ indicates a potential breakdown from the channel, with price possibly heading toward the red demand zone 🟥 around $175B for a strong support test 🛡️. Volume and structure suggest distribution 📉 after a significant rally, and the lower highs signal a bearish divergence 🐻. If price fails to reclaim the channel, a sharp drop could follow 🚨, while holding the midline would keep bulls in play 🐂. This chart highlights caution ⚠️ and potential altcoin weakness, as smaller-cap coins may correct sharply 🔄 if the broader market sentiment turns risk-off 📉.
ENTRY PRICE :3.2281
TP 1 : 3.1194
TP 2: 3.0144
SL : 3.3744
For more details, click on my profile and check my BIO .
This signal is for spot trading only. If you're interested in future signals, join my Binance Live .
Simply click on my profile to join!


