1. Quantification and Weighting of Evidence
For this analysis, I break down the information into factors that favor a buying position (bullish) and those that suggest a selling position (bearish). I assign a weight to each factor based on its impact on the market. I consider that technical and short- to medium-term sentiment data carry significant weight, while very long-term narratives, although important, have less weight in the immediate probability.
| Evidence | Type | Weight (W_i) | Reason |
|---|---|---|---|
| E_1 (Fear & Greed Index at 51) | Bullish | +0.25 | The upgrade to "Neutral" reflects a reduction in fear, suggesting a more stable and mature market sentiment. |
| E_2 (RSI in oversold) | Bullish | +0.20 | An RSI that exits the oversold zone is a strong technical indicator of a potential bounce. |
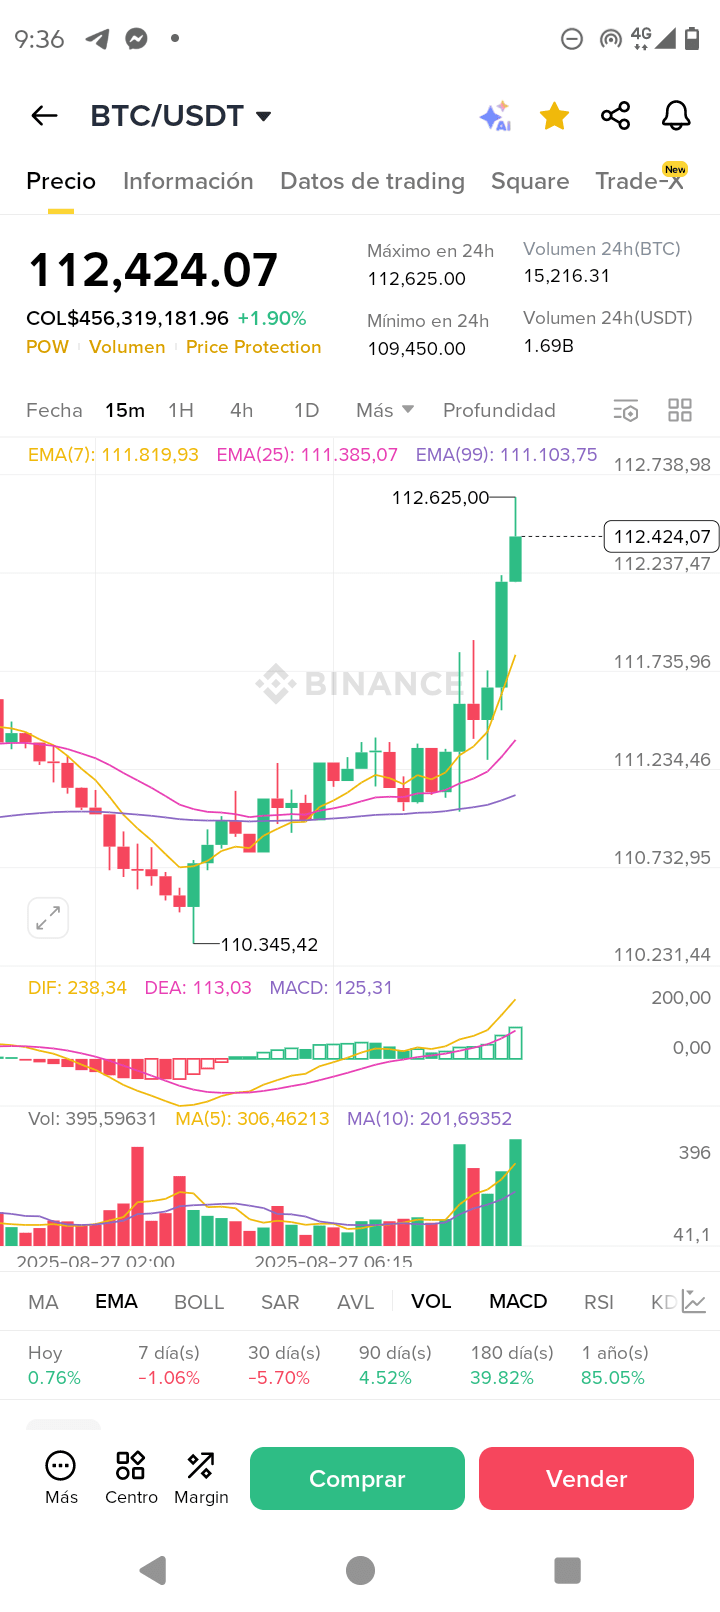
| E_3 (Bullish MACD in 15m) | Bullish | +0.15 | The crossing and rise of the MACD in the short term indicates that buying momentum is gaining strength. |
| E_4 (Double Bottom Pattern) | Bullish | +0.15 | This technical pattern is a classic indicator of trend reversal, strengthening the bounce thesis. |
| E_5 (Institutional Accumulation) | Bullish | +0.10 | The interest of large entities such as the Philippines adds solidity and confidence to the market, acting as a fundamental support. |
| E_6 (Price Recovery) | Bullish | +0.10 | The price remains above $112,000, surpassing local resistances and validating the bounce. |
| E_7 (Increasing Volume) | Bullish | +0.05 | The increase in volume in bullish candles validates the strength of the movement, showing real interest from buyers. |
| E_8 (Resistance rejection at $112,625) | Bearish | -0.15 | The difficulty in surpassing the 24h high suggests a resistance zone, which may limit the upside. |
| E_9 (Risk of falling to $100K) | Bearish | -0.10 | The possibility of a drop to lower psychological supports if the bounce fails creates a latent threat. |
| E_{10} (Past Liquidations) | Bearish | -0.05 | The memory of the liquidations in August may keep traders cautious, with the risk of more sales. |
| E_{11} (Correction from ATH) | Bearish | -0.05 | The 11% drop from the ATH ($124,500) indicates that selling pressure still exists at higher levels. |
2. Calculation of Weighted Probability
Now, we sum the weights for each scenario to obtain a "total score."
Sum of Bullish Weights:
P_{Bullish} = W_1 + W_2 + W_3 + W_4 + W_5 + W_6 + W_7 = 0.25 + 0.20 + 0.15 + 0.15 + 0.10 + 0.10 + 0.05 = 1.00
* Sum of Bearish Weights:
P_{Bearish} = |W_8| + |W_9| + |W_{10}| + |W_{11}| = 0.15 + 0.10 + 0.05 + 0.05 = 0.35
To obtain the normalized probabilities, we divide the sum of each scenario by the total sum of the weights (1.00 + 0.35 = 1.35).
Probability of Purchase (Bullish):
P(Buy) = \frac{1.00}{1.35} \approx 0.741 \approx 74.1\%
Probability of Sale (Bearish):
P(Sale) = \frac{0.35}{1.35} \approx 0.259 \approx 25.9\%
Statistical Conclusion
Based on this probabilistic analysis, the probability that the price of Bitcoin continues its upward movement is 74.1%, making it the statistically most probable option. The evidence in favor of a purchase is significantly greater and more robust than that which suggests a sale. The market has digested the correction, and technical and sentiment indicators have aligned to favor a bounce.
However, the 25.9% probability for the bearish scenario should not be ignored. A failure to maintain support at $112,000 or an inability to break resistance at $113,500-$115,000 could quickly invalidate this thesis. Therefore, the management of
risks remains key.