The price of Dogecoin (DOGE) is maintaining above the important psychological level of 0.2 USD as the market enters a challenging phase. Technical analysts are noting two significant signals simultaneously: the TD Sequential buy indicator and the cup and handle pattern – both of which could shape the next direction of the largest memecoin in the market.
However, the history of negative volatility in August and Q3 reminds investors that DOGE's upward momentum is often not sustainable during this period.
Technical signals: TD Sequential and cup and handle pattern
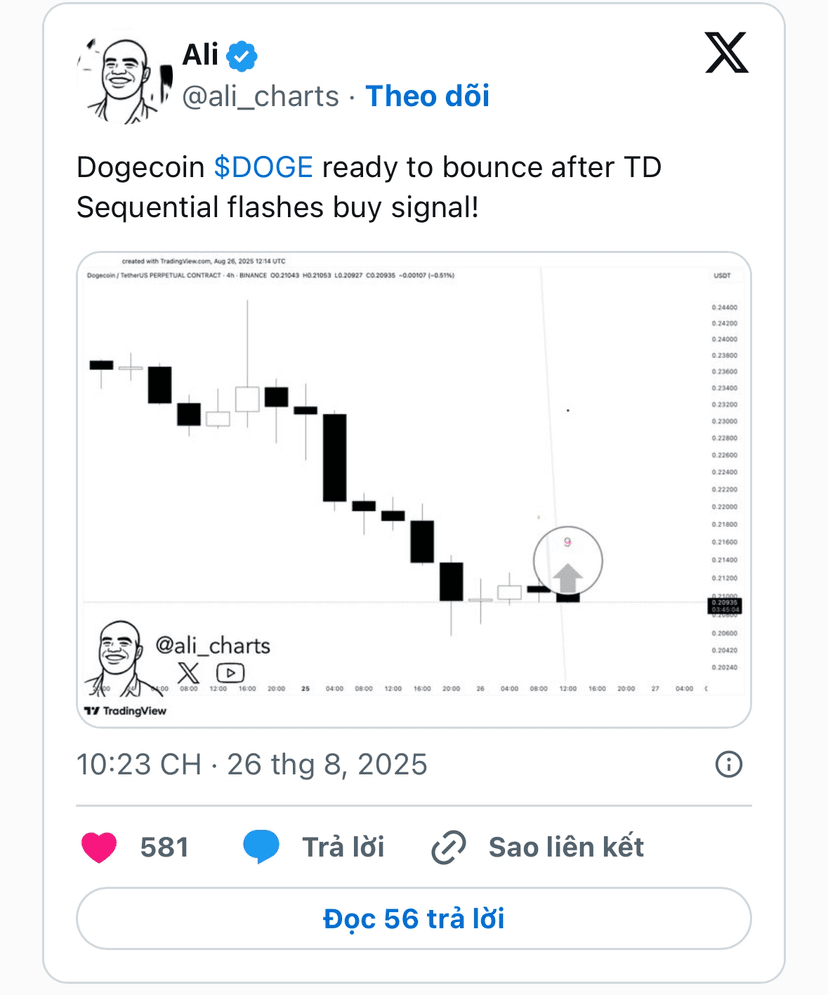
On August 26, 2025, DOGE began to show signs of recovery when the TD Sequential indicator issued a buy signal after 9 consecutive red candles on the 4-hour chart. This is one of the signals often noted by analysts, as the TD Sequential system developed by Thomas Demark is famous for its ability to identify exhaustion points in trends.
Theoretically, after completing a cycle of 9 consecutive bearish candles, the market tends to slow down and even reverse, as the sellers have exhausted most of their momentum. Therefore, analyst Ali Martinez suggests that Dogecoin may enter a short-term technical rebound, as selling pressure seems to be easing.
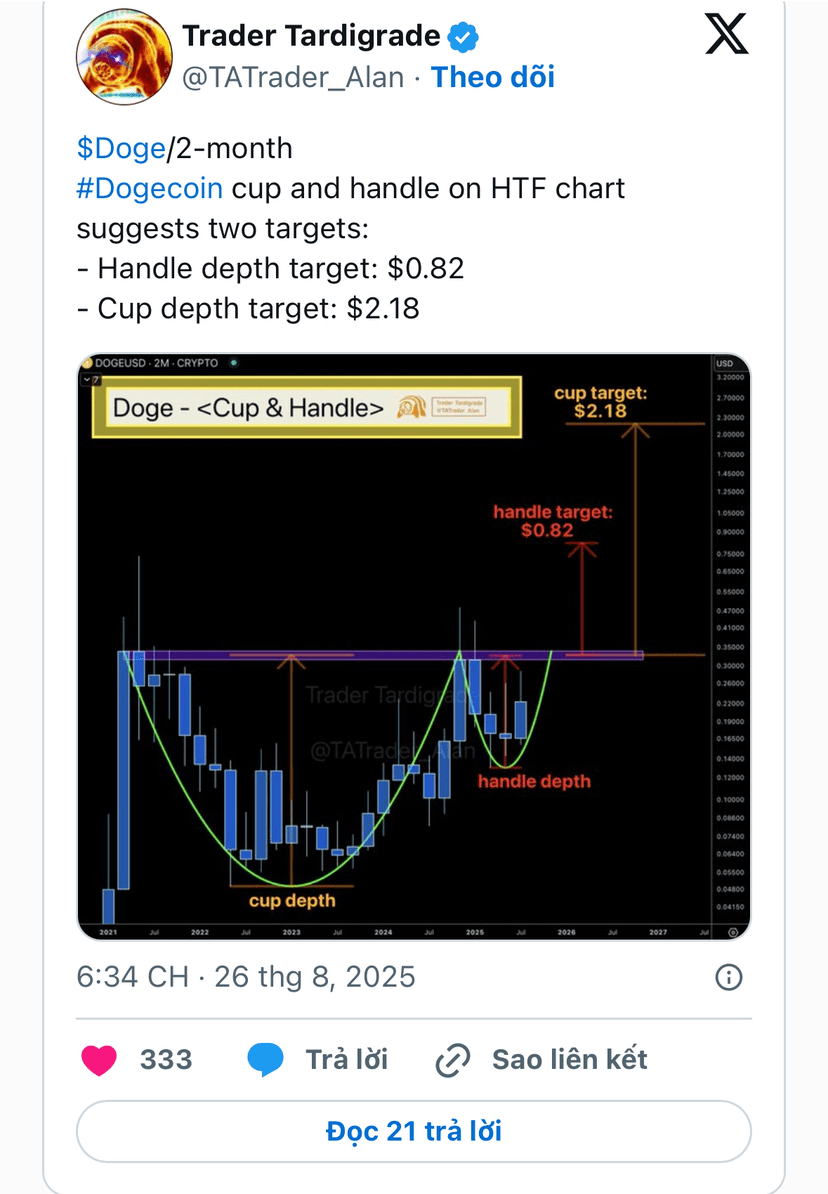
Alongside short-term signals, a larger picture is forming on the price chart. Trader Tardigrade, who frequently analyzes classic technical patterns, points out that DOGE has completed most of the structure of the 'cup and handle' pattern that has been developing over the past two months.
Essentially, this model reflects the accumulation – correction – breakout phase:
'Cup' represents the process of the price falling, creating a rounded bottom, and then gradually recovering back to the resistance zone.
'Handle' is the short correction after the price approaches resistance, often aimed at shaking off selling pressure before entering a strong breakout.
In technical analysis, this is one of the most reliable bullish patterns, widely used by traders to predict further targets.
According to standard measurement from the shape of the pattern:
Handle depth → price target around 0.82 USD.
Full cup depth → further target at 2.18 USD.
These targets are not arbitrary, but based on the principle of measuring the height of the pattern and 'adding' it to the breakout point, indicating the potential for a long-term breakout if the pattern continues to develop correctly.
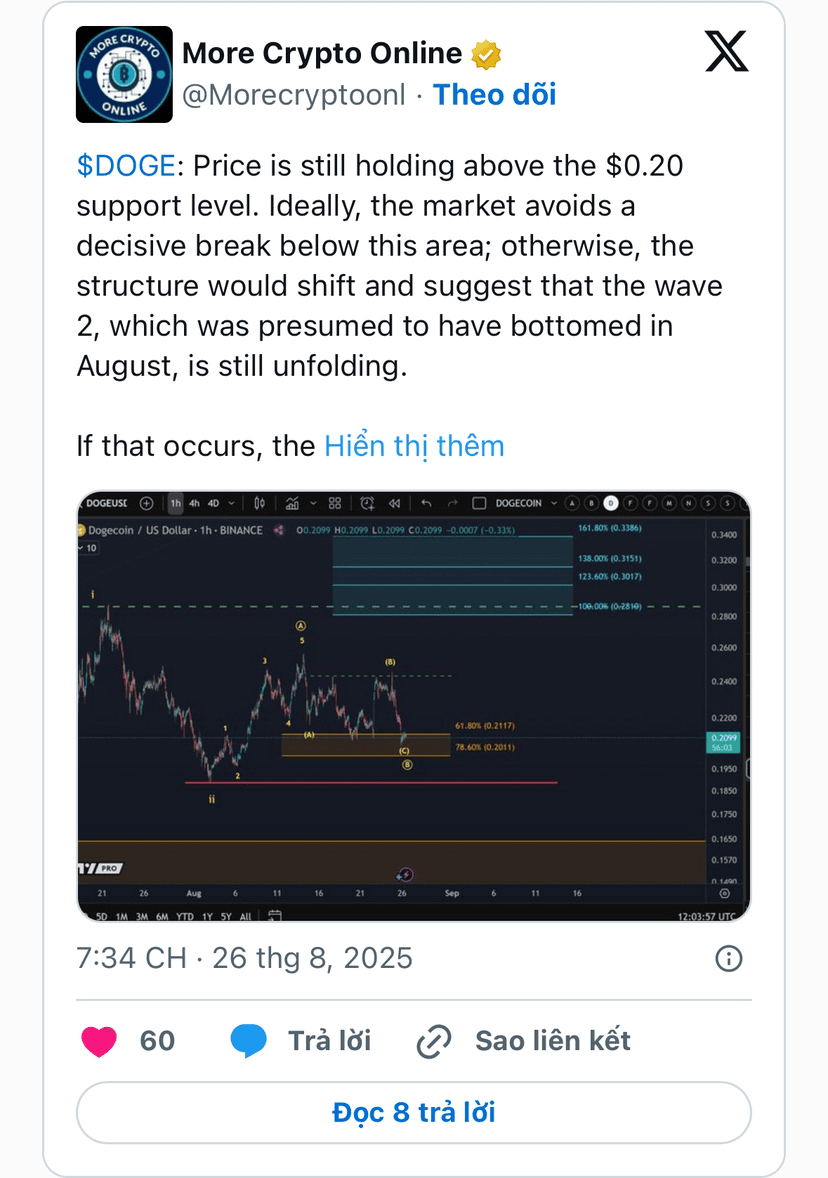
However, not everything is optimistic. Morecryptoonl, another market observer, emphasizes that the entire current structure of DOGE is firmly standing on the support base of 0.2 USD. This is considered an important boundary:
If this support area is maintained, the likelihood of a successful 'cup and handle' scenario will be higher, paving the way for a sustainable upward trend.
But if DOGE loses this level, selling pressure could quickly resurface, prolonging the correction that has been forming since early August.
In other words, DOGE is currently oscillating between two opposing scenarios: one is activating a classic bullish pattern towards higher levels, the other is continuing to slide if the 'foundation' of 0.2 USD is broken.
Q3 - The 'Unpredictable' Season of Dogecoin
At the time of writing, Dogecoin is trading at 0.22 USD, just slightly above the 0.2 USD mark – a threshold many traders consider the 'life-or-death boundary' between buyers and sellers. Whether DOGE holds above this support zone could be a determining factor in whether the current recovery is just a short-term bounce or the beginning of a more sustainable growth trend.
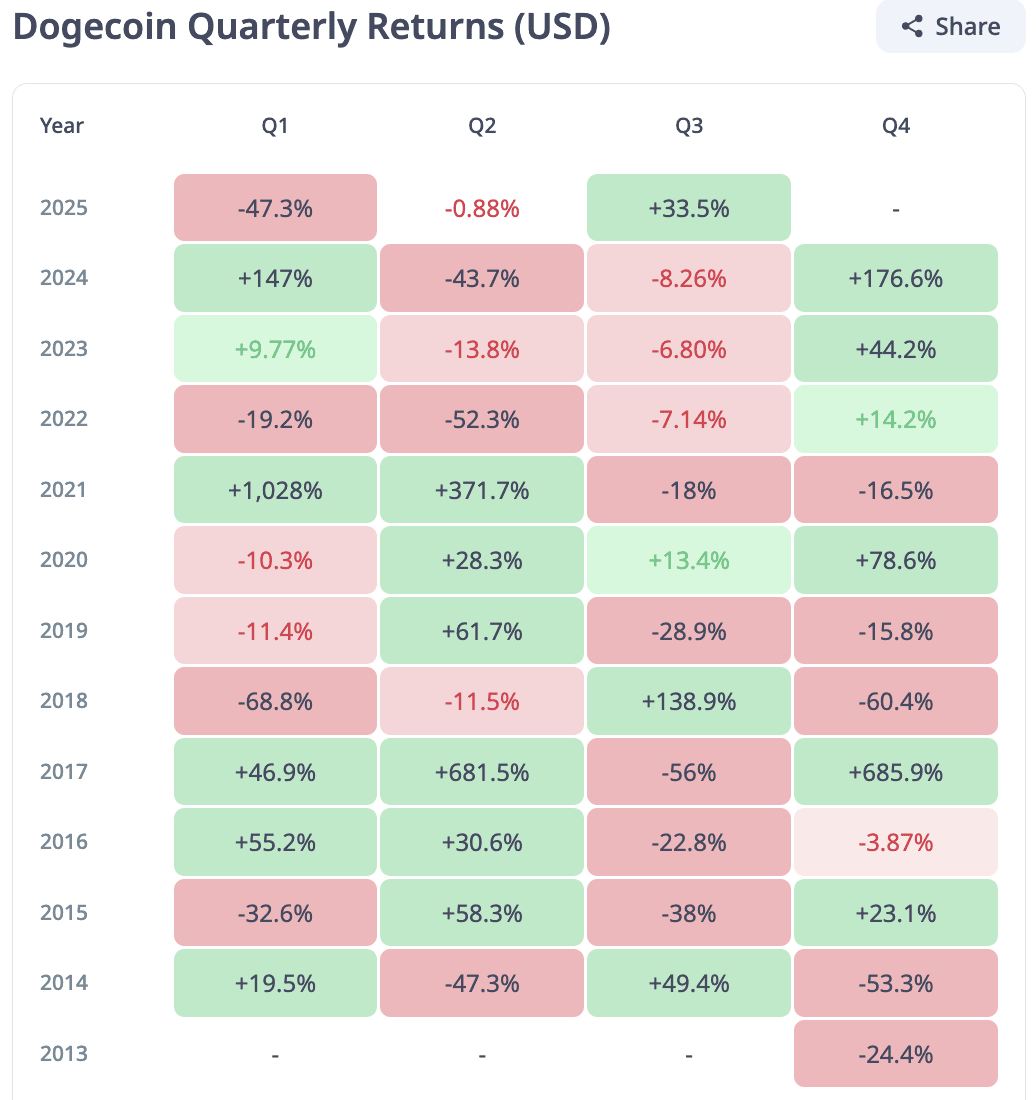
Historical data shows that Q3 often brings unpredictable results for Dogecoin, with many instances of strong volatility in both directions:
2019: DOGE decreased by 28.9%, reflecting the lack of buying force during the typically sluggish summer period.
2020: trend reversed, the coin increased by 13.4%, benefiting from the altcoin speculation wave before the strong price surge of 2021.
2021: decreased by 18%, the time when the crypto market corrected sharply after the explosion at the beginning of the year.
2022: lost 7.14%, amid the general market weakening due to global inflation and monetary policy tightening.
2023: decreased by 6.80%, continuing the sideways altcoin phase, lacking growth momentum.
2024: continued to decrease by 8.26%, demonstrating the negative cyclical nature of Dogecoin in Q3.
2025: reversing, DOGE has surged by 28.8% so far – a rare increase in Q3 history, raising hopes that the 'red season' cycle of Dogecoin may be changing.
Looking at the overall picture, it's evident that August and Q3 are rarely stable for DOGE. This volatility stems from many factors:
Summer liquidity often declines in financial markets, leading to exaggerated price fluctuations.
Dogecoin is heavily influenced by speculative sentiment, as it has fewer real-world applications compared to foundational blockchains, making its price volatile according to short-term capital flows.
The up and down cycles of altcoins are often stronger than Bitcoin, and Dogecoin is no exception.
Therefore, DOGE's nearly 30% increase in Q3/2025 can be viewed as a special signal indicating a change in price behavior pattern. However, analysts emphasize that the sustainability of this upward momentum will only be confirmed if the 0.20 USD support zone continues to hold in the coming weeks.
Technical levels to watch
In addition to the psychological support level of 0.2 USD, the Dogecoin market is currently focusing on a series of important technical levels, especially Fibonacci retracement and extension levels – tools commonly used by traders to predict support zones, resistance, and potential reversal points.
Support zone – testing the strength of buyers
61.8% Fibonacci at 0.21 USD: This is considered the 'golden ratio' in technical analysis. In many cases, the price tends to reverse sharply from this level, as it reflects a natural balance between buyers and sellers.
78.6% Fibonacci at 0.2 USD: This is the 'last fortress' before the price breaks below the 0.2 USD mark. If DOGE retraces to this area and bounces back, it could signal that the buying force is still strongly present.
Both of these levels are expected by many traders to become a short-term 'launchpad' if DOGE returns to test.
Important resistances – the 'stopping points' of the price
If DOGE holds above 0.2 USD and confirms an upward trend, the next series of Fibonacci extension levels will act as resistance zones to overcome:
0.2810 USD (Fibonacci 100%) – the first level in the recovery scenario.
0.3017 USD (123.6%) – marks an important psychological boundary, as surpassing 0.3 USD could trigger FOMO sentiment among investors.
0.3151 USD (138%) – a secondary resistance level, demonstrating mid-term expansion strength.
0.3386 USD (161.8%) – the 'peak' of the short-term trend, where many traders may take profits.
According to observers, these levels have the potential to become technical stopping points, where the market temporarily balances before deciding on a clearer direction.
Furthermore, the price targets set by Trader Tardigrade – 0.82 USD and 2.18 USD – can only be achieved if the cup and handle pattern on a larger timeframe continues to develop and is confirmed by breakout trading volume. These levels are strategic, not meant for short-term trading, but suitable for patient investors pursuing long-term trends.
