The BTC rate, having realized a rebound to $112,371 over the evening and night, is currently correcting.
While this correction is unpleasant, it is adequate, because the price came to the 0.5 level of the local Fibonacci from the low of the decline to $112,371. The rate is at $110,518, from which a buyback followed with a decent hourly candle.
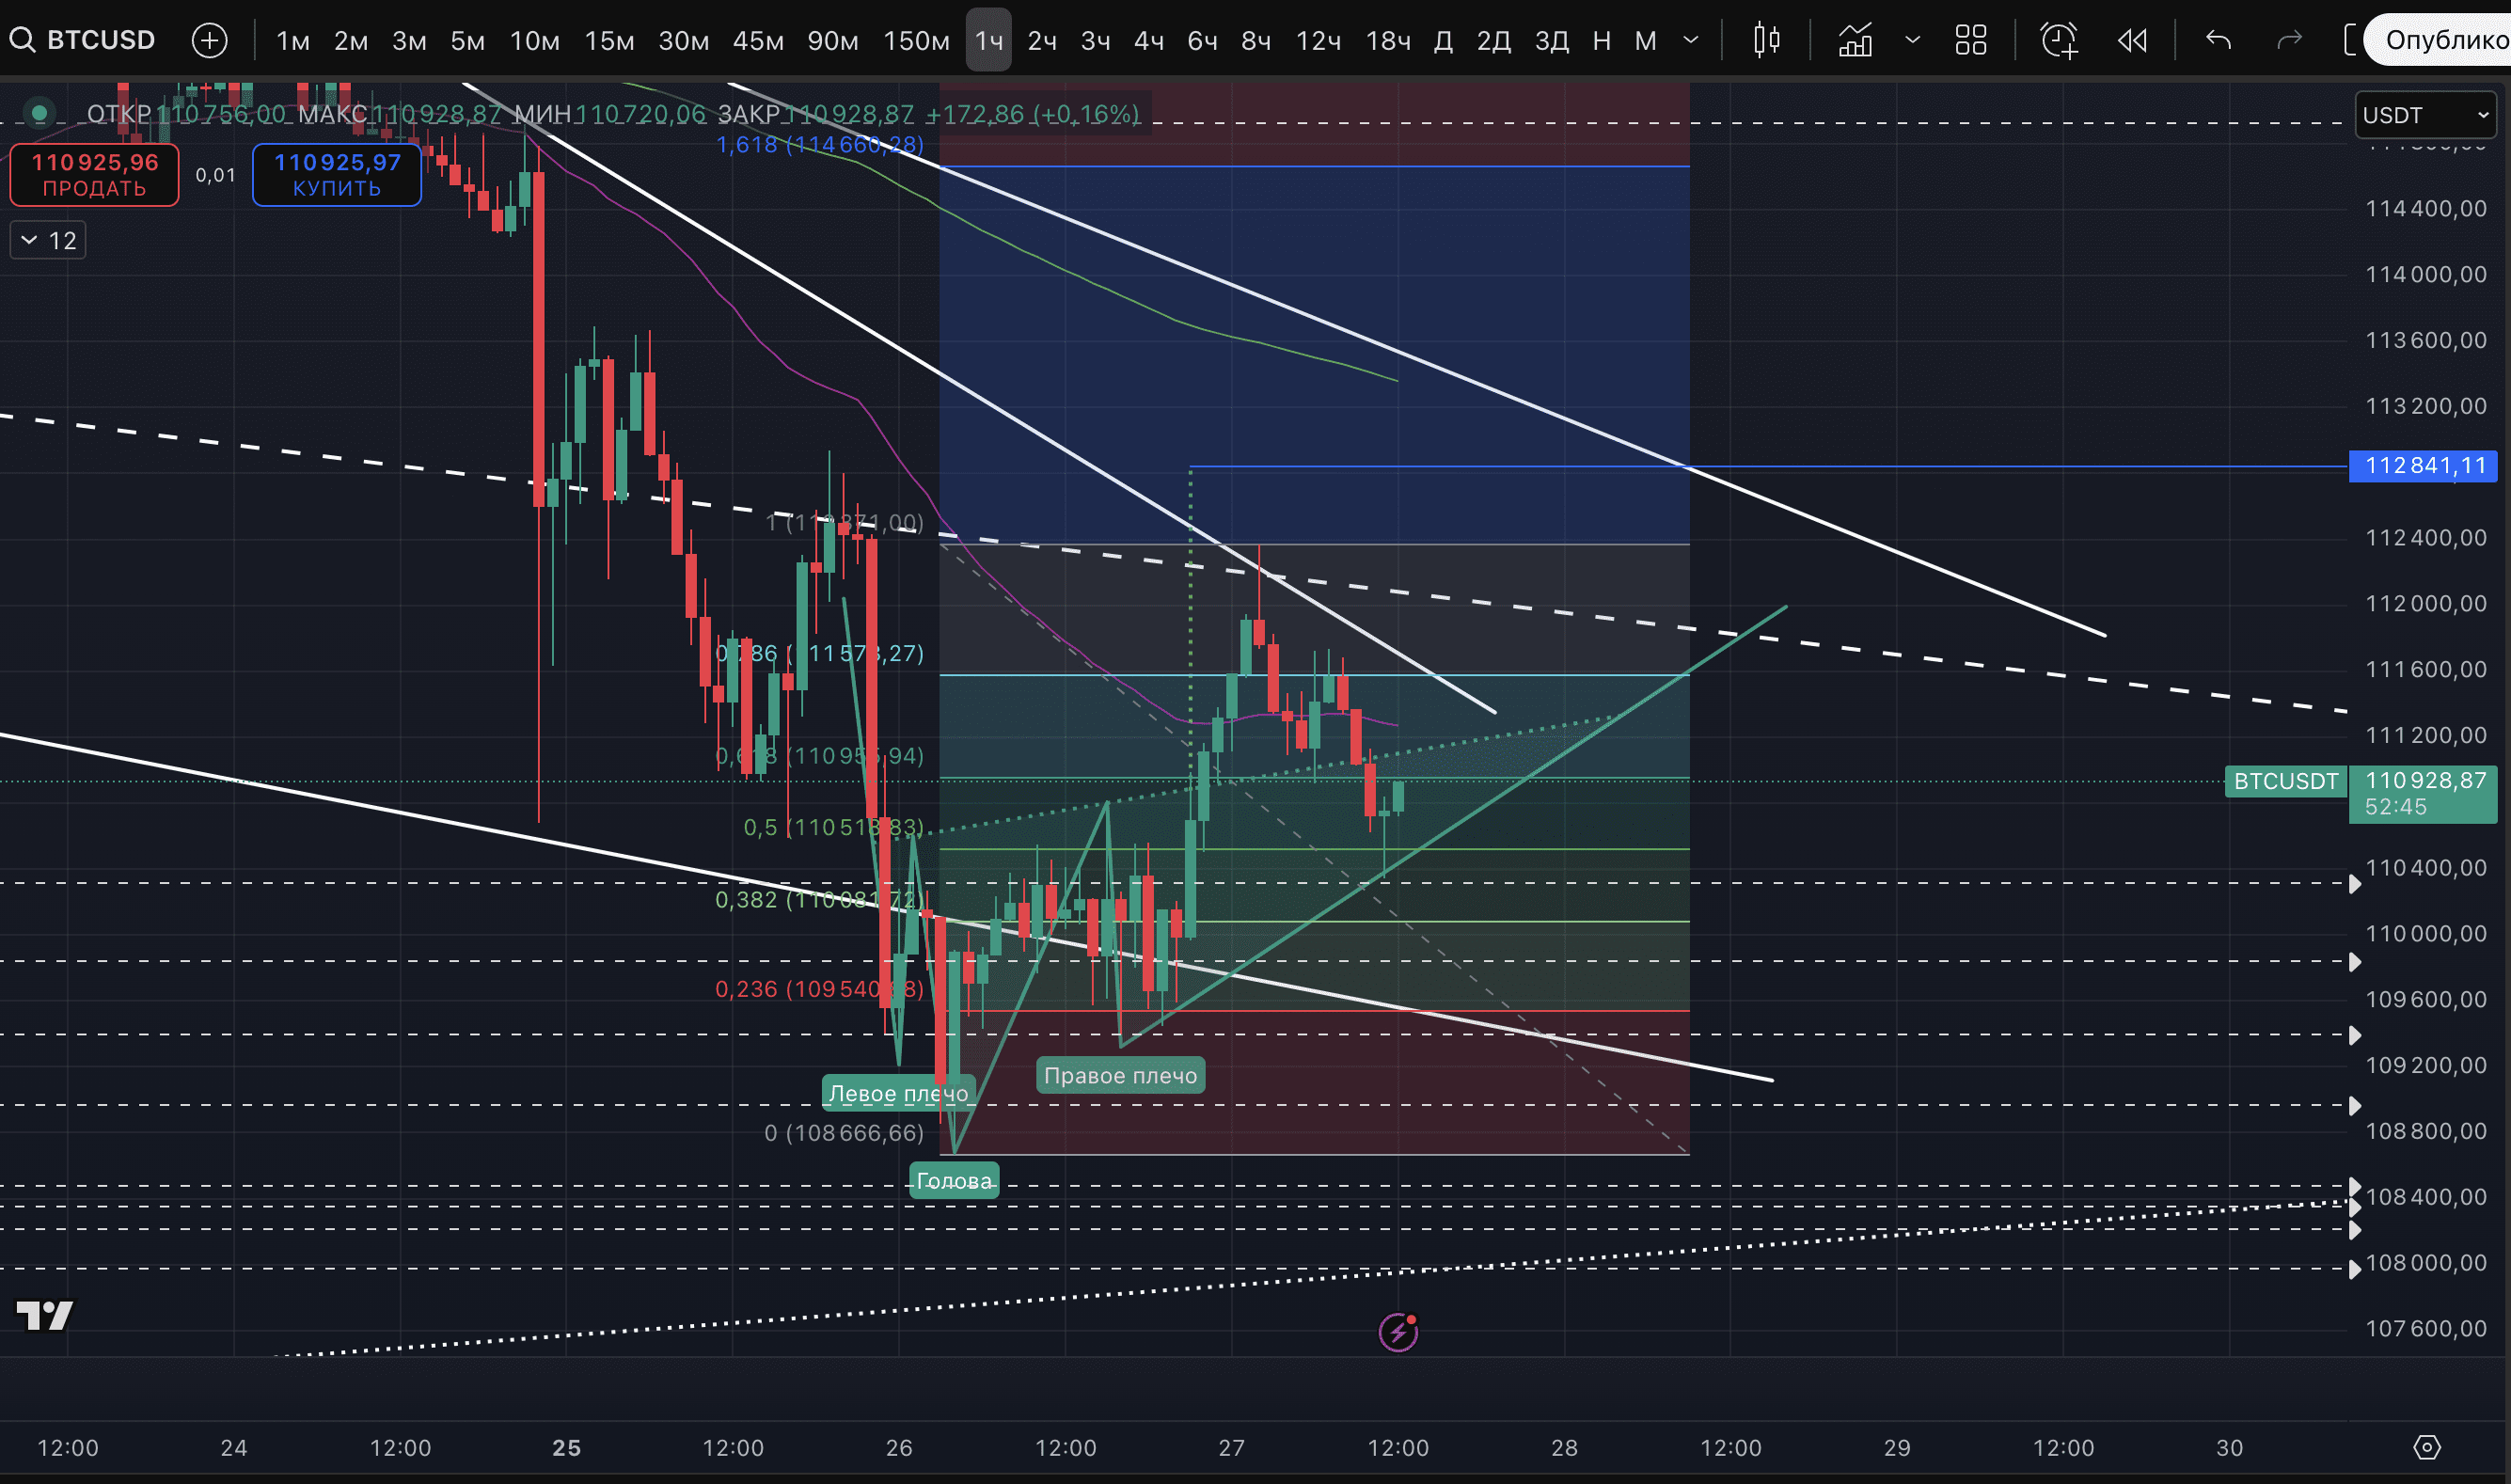
But if the price starts to go below $110,518 and consolidates there - that would be negative.
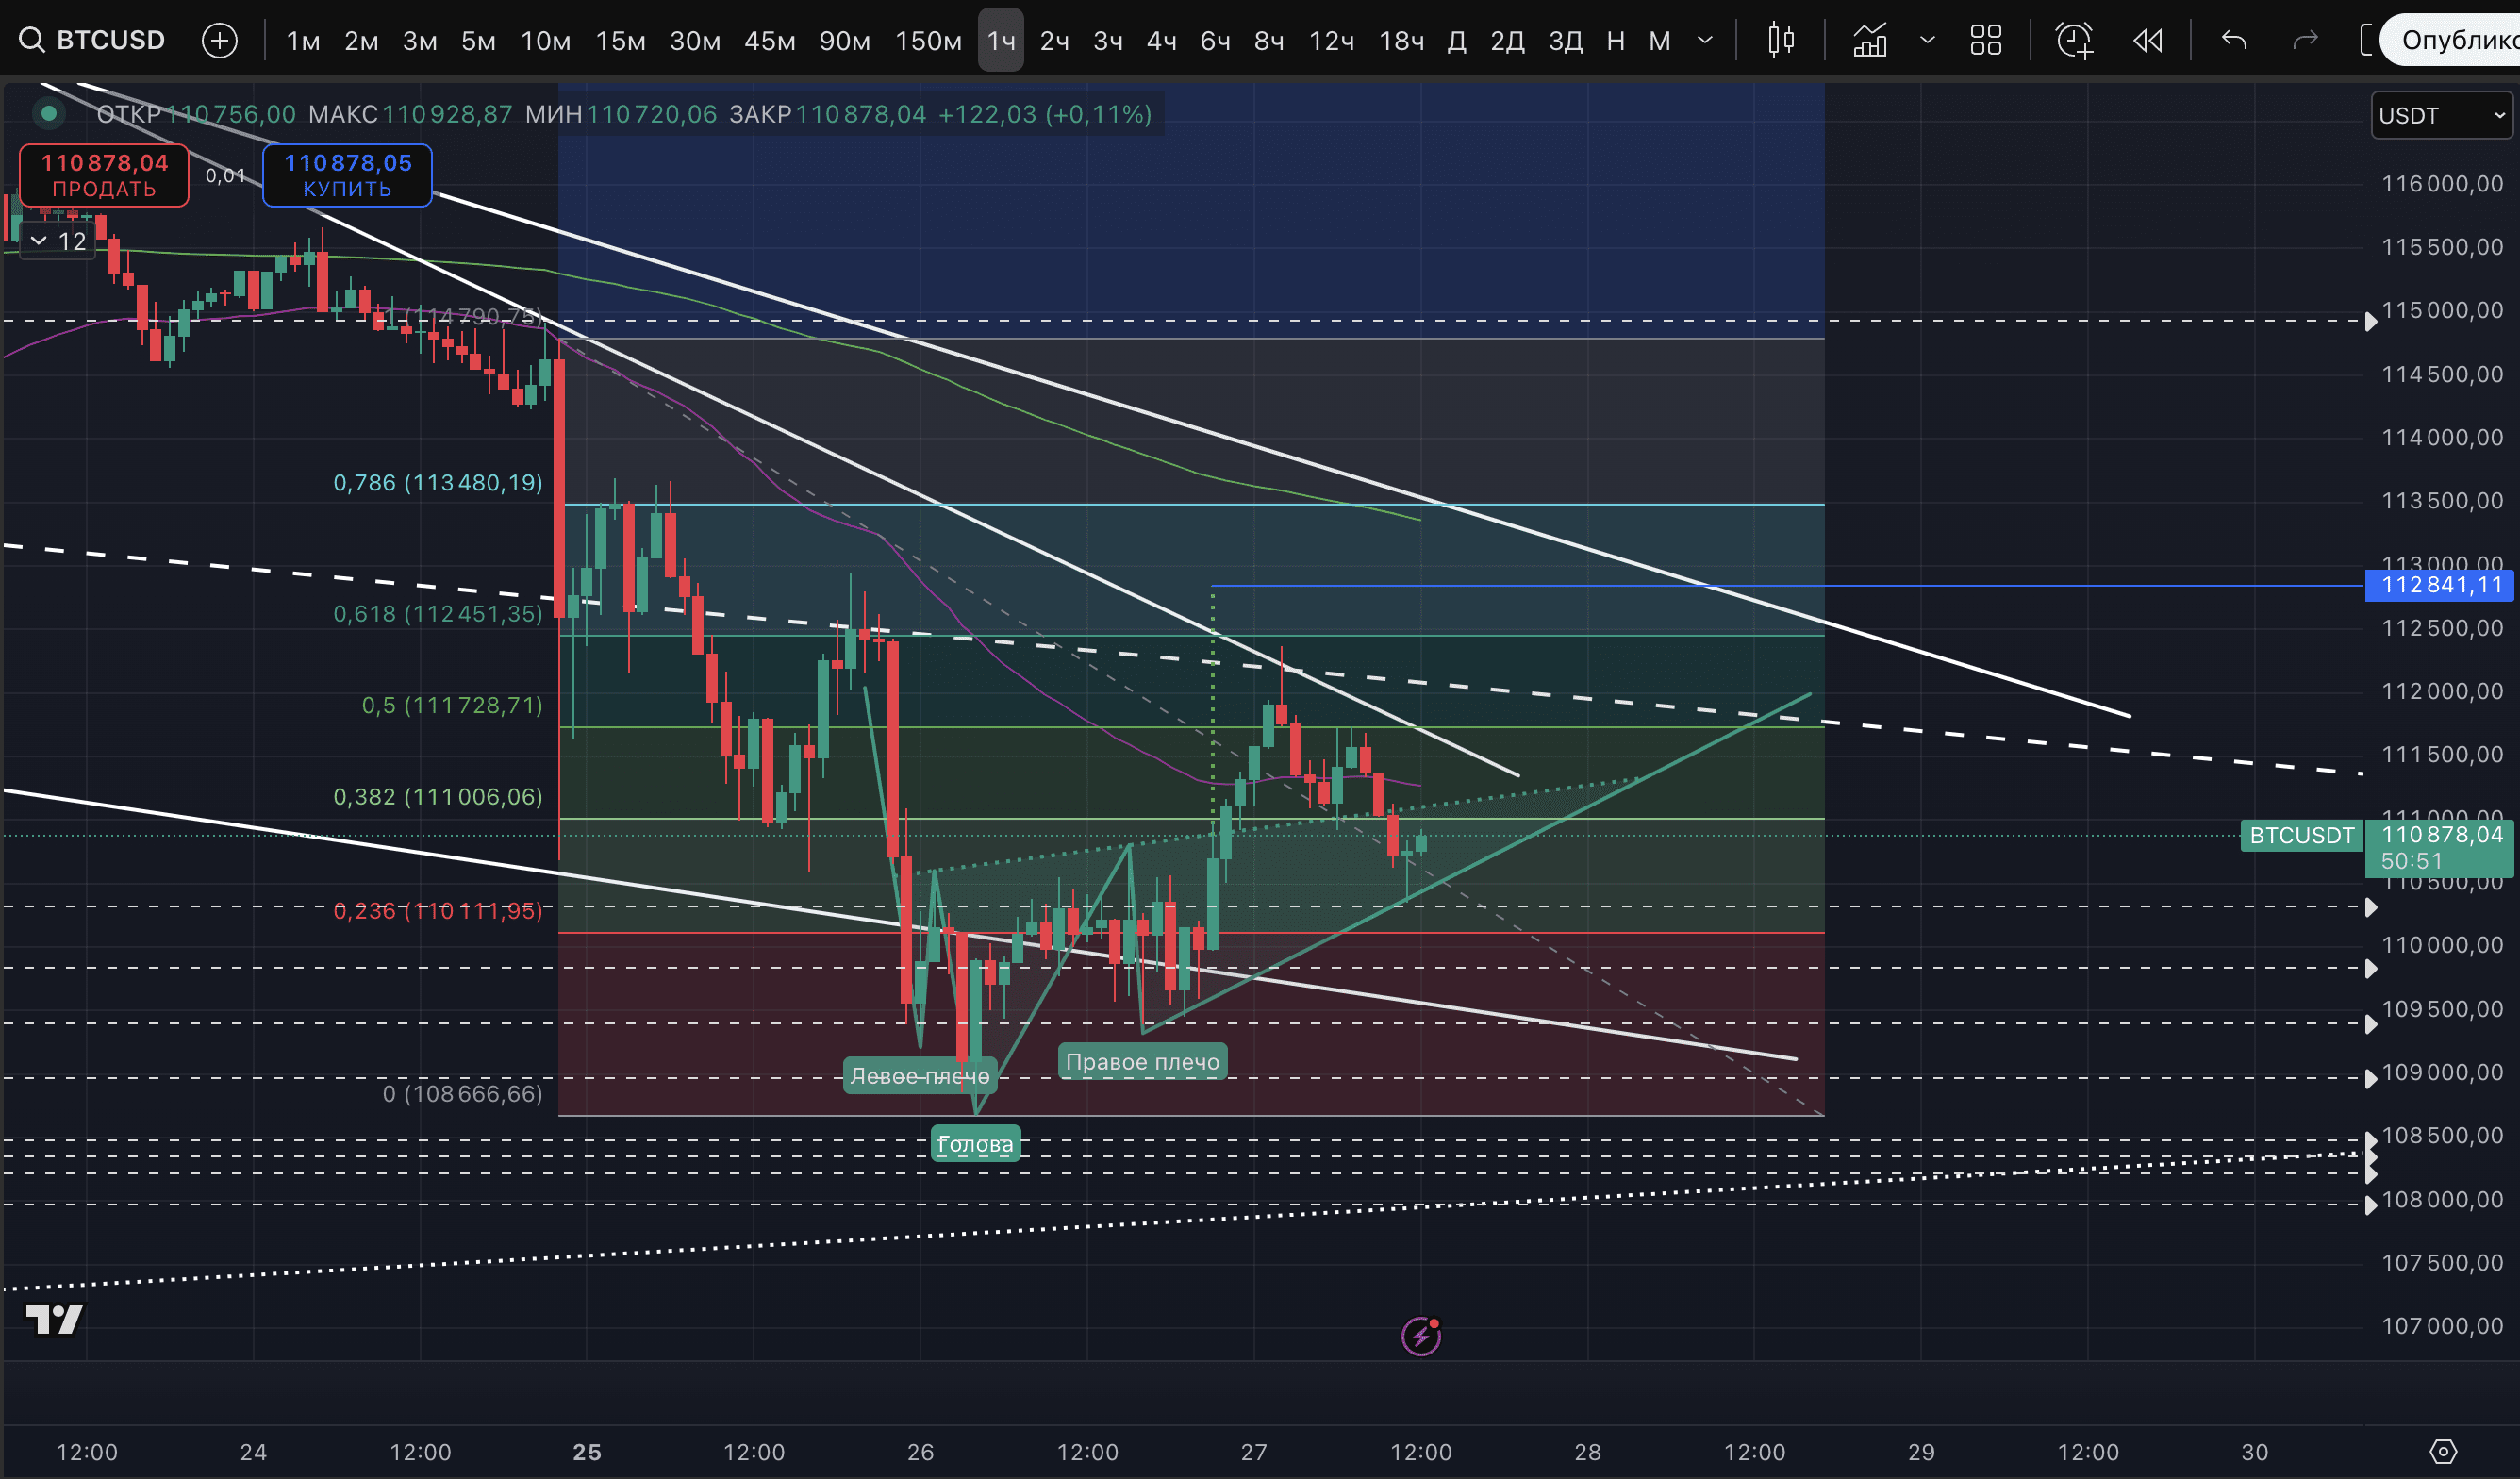
On the larger Fibonacci, the price on the rise to $112,371 came to test the 0.5 level of the entire dump, at a rate of $111,728, and even almost reached the 0.618 level. But now it has even gone below 0.382. It is extremely important for the bulls to return the price above $111,728.
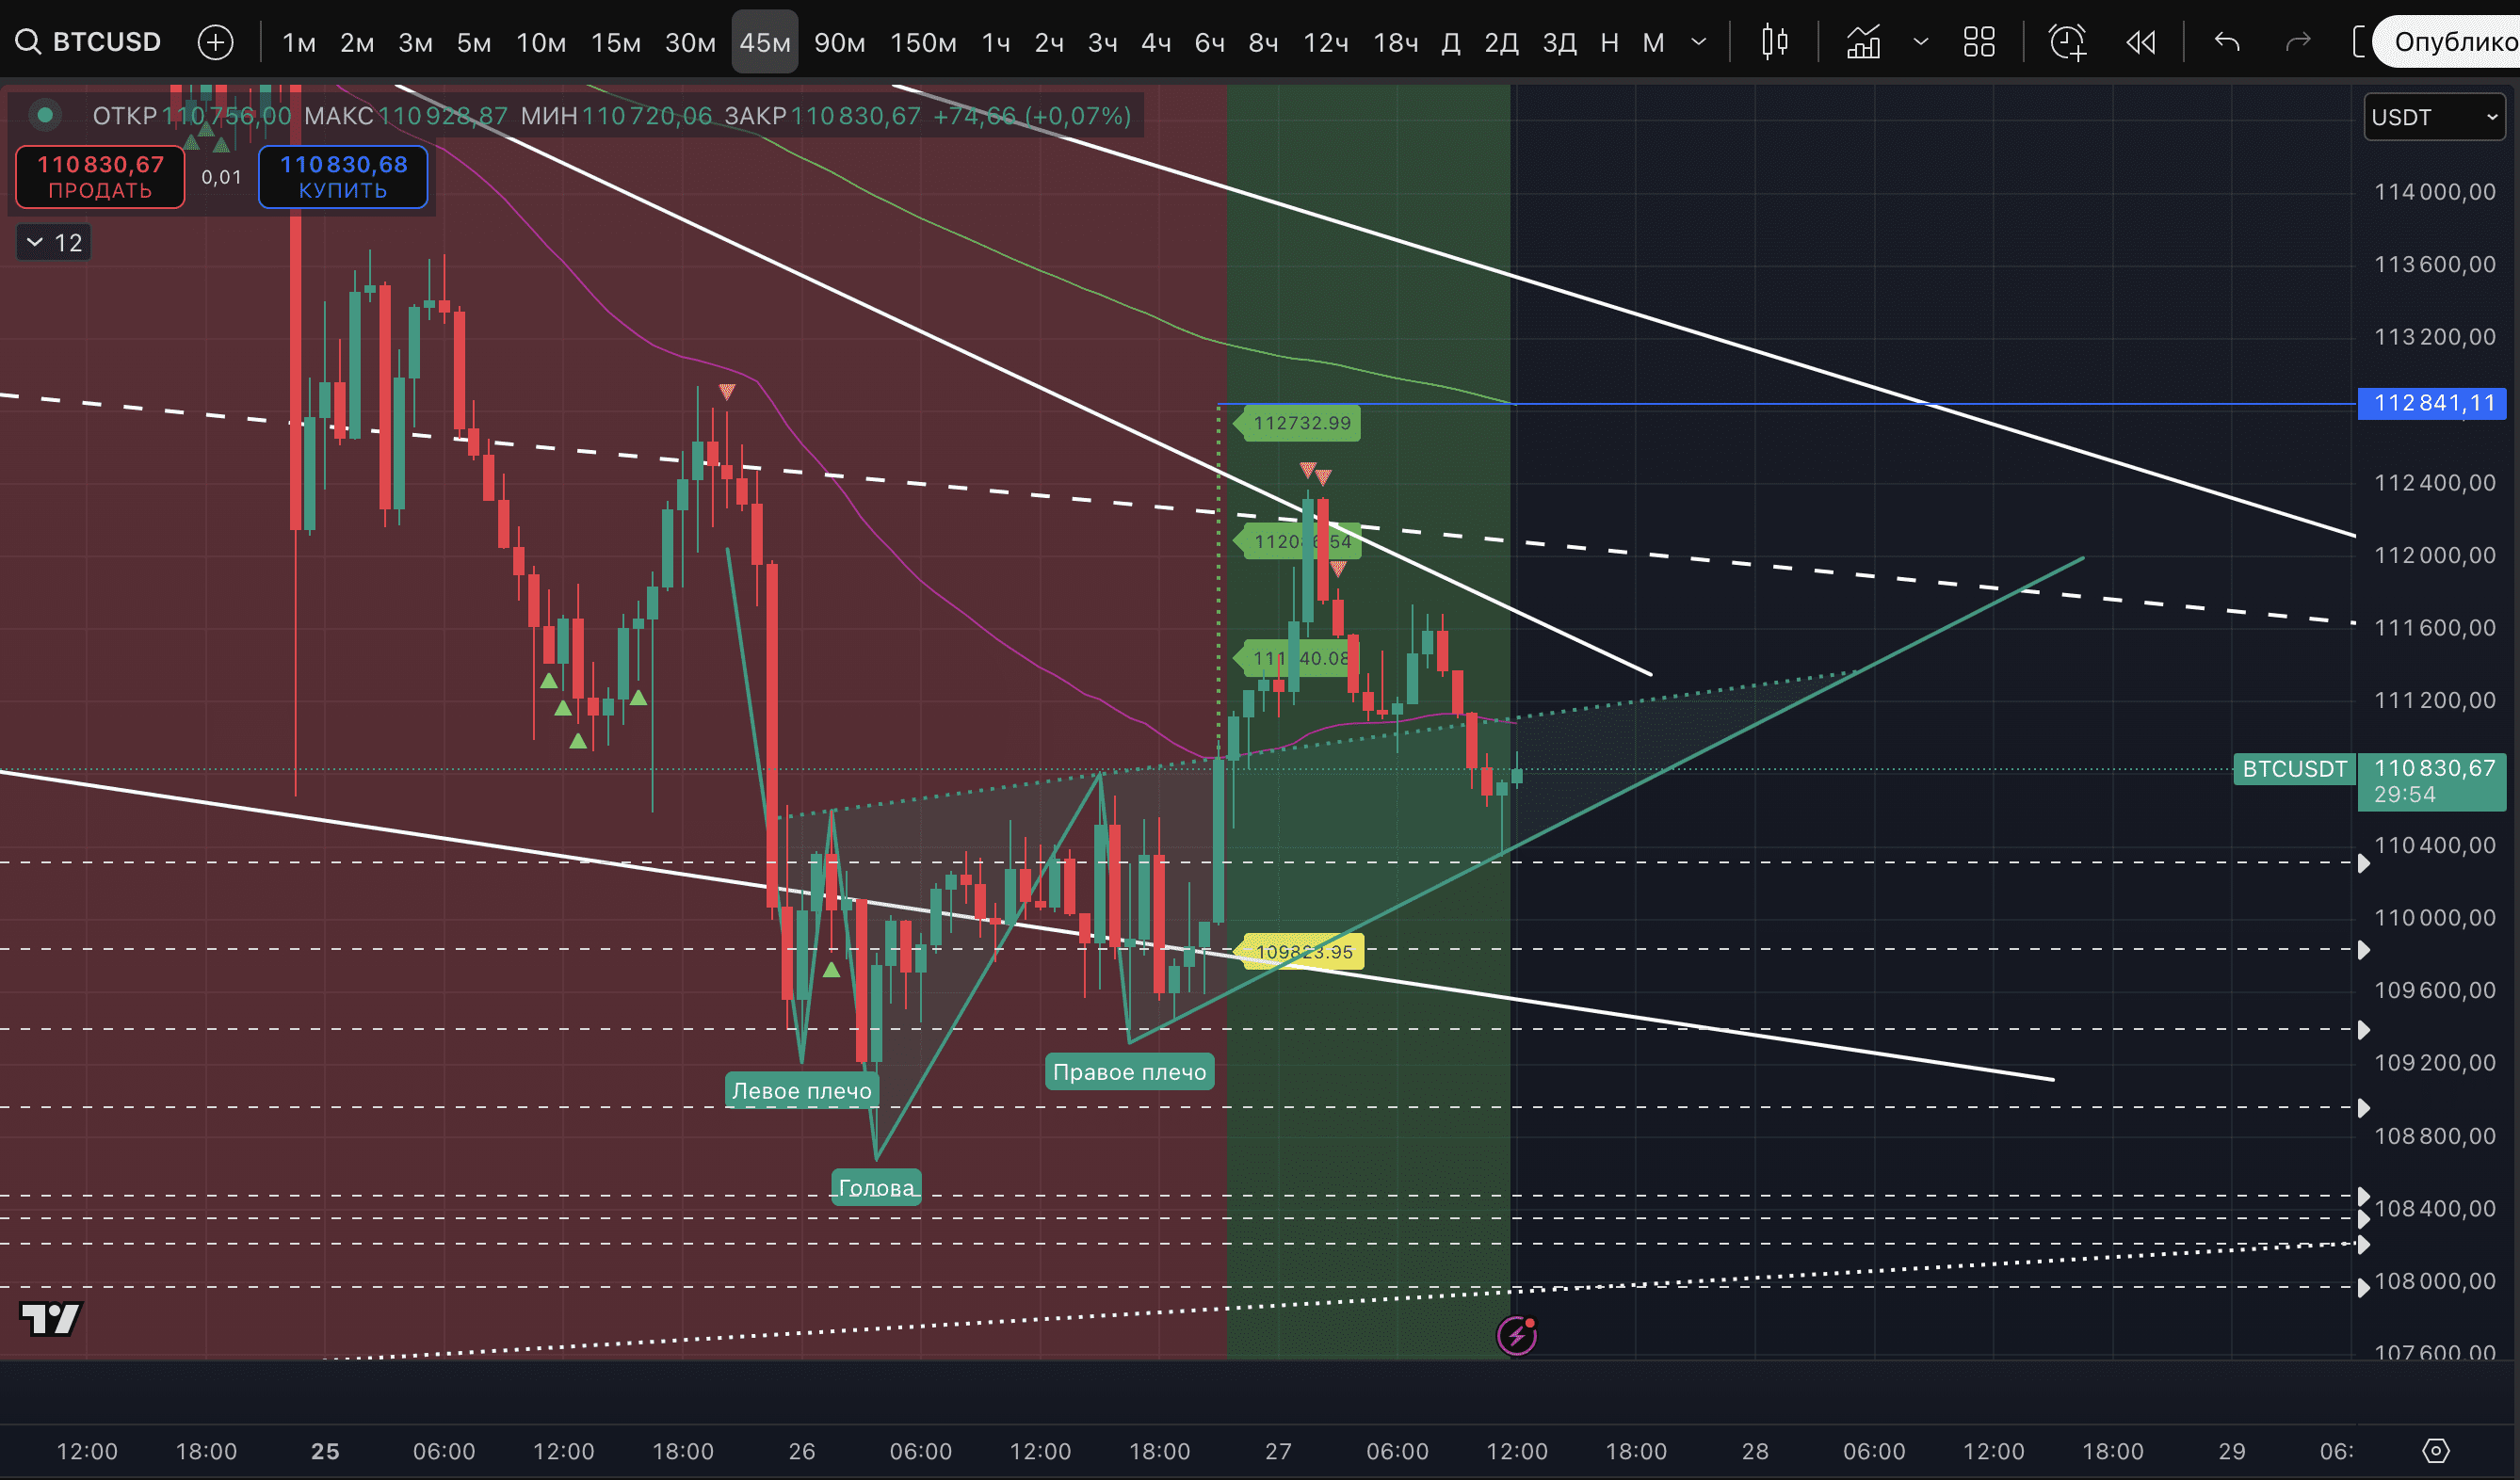
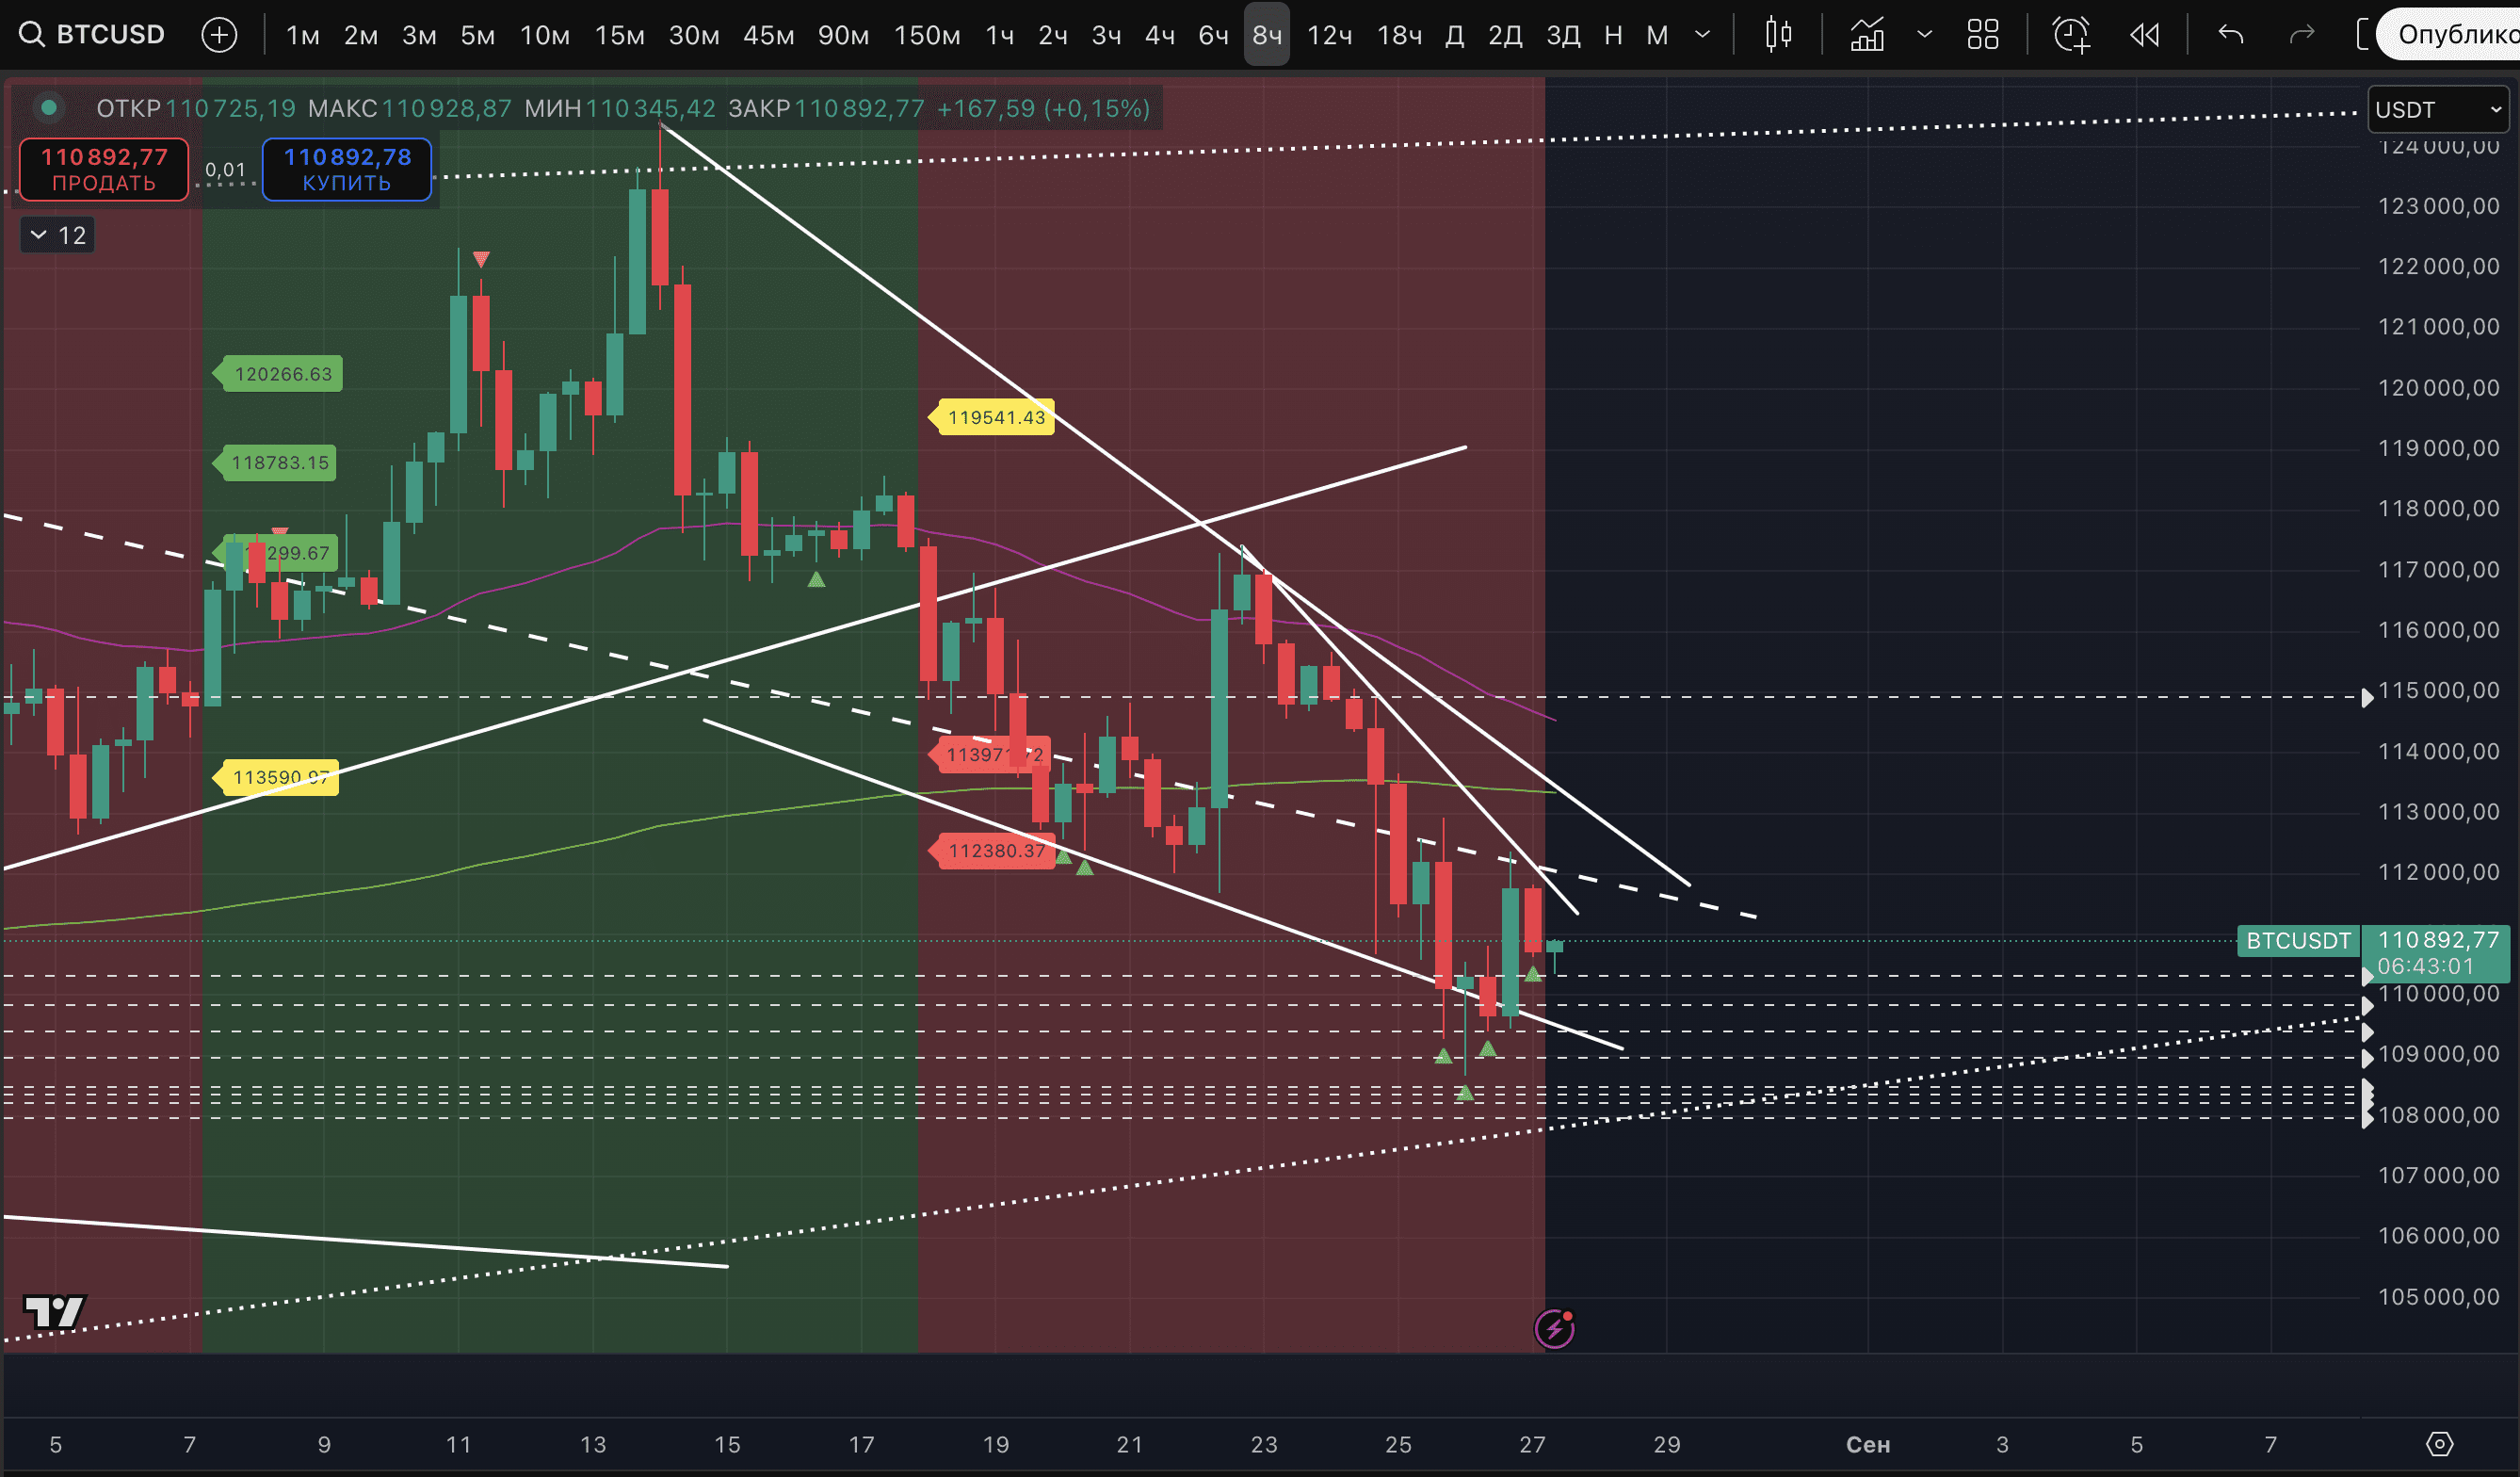
According to our indicator, the correction began with marks of a potential high on the 45-minute and hourly TF, and the key for the bulls now is that there is a stable uptrend on the hourly TF.
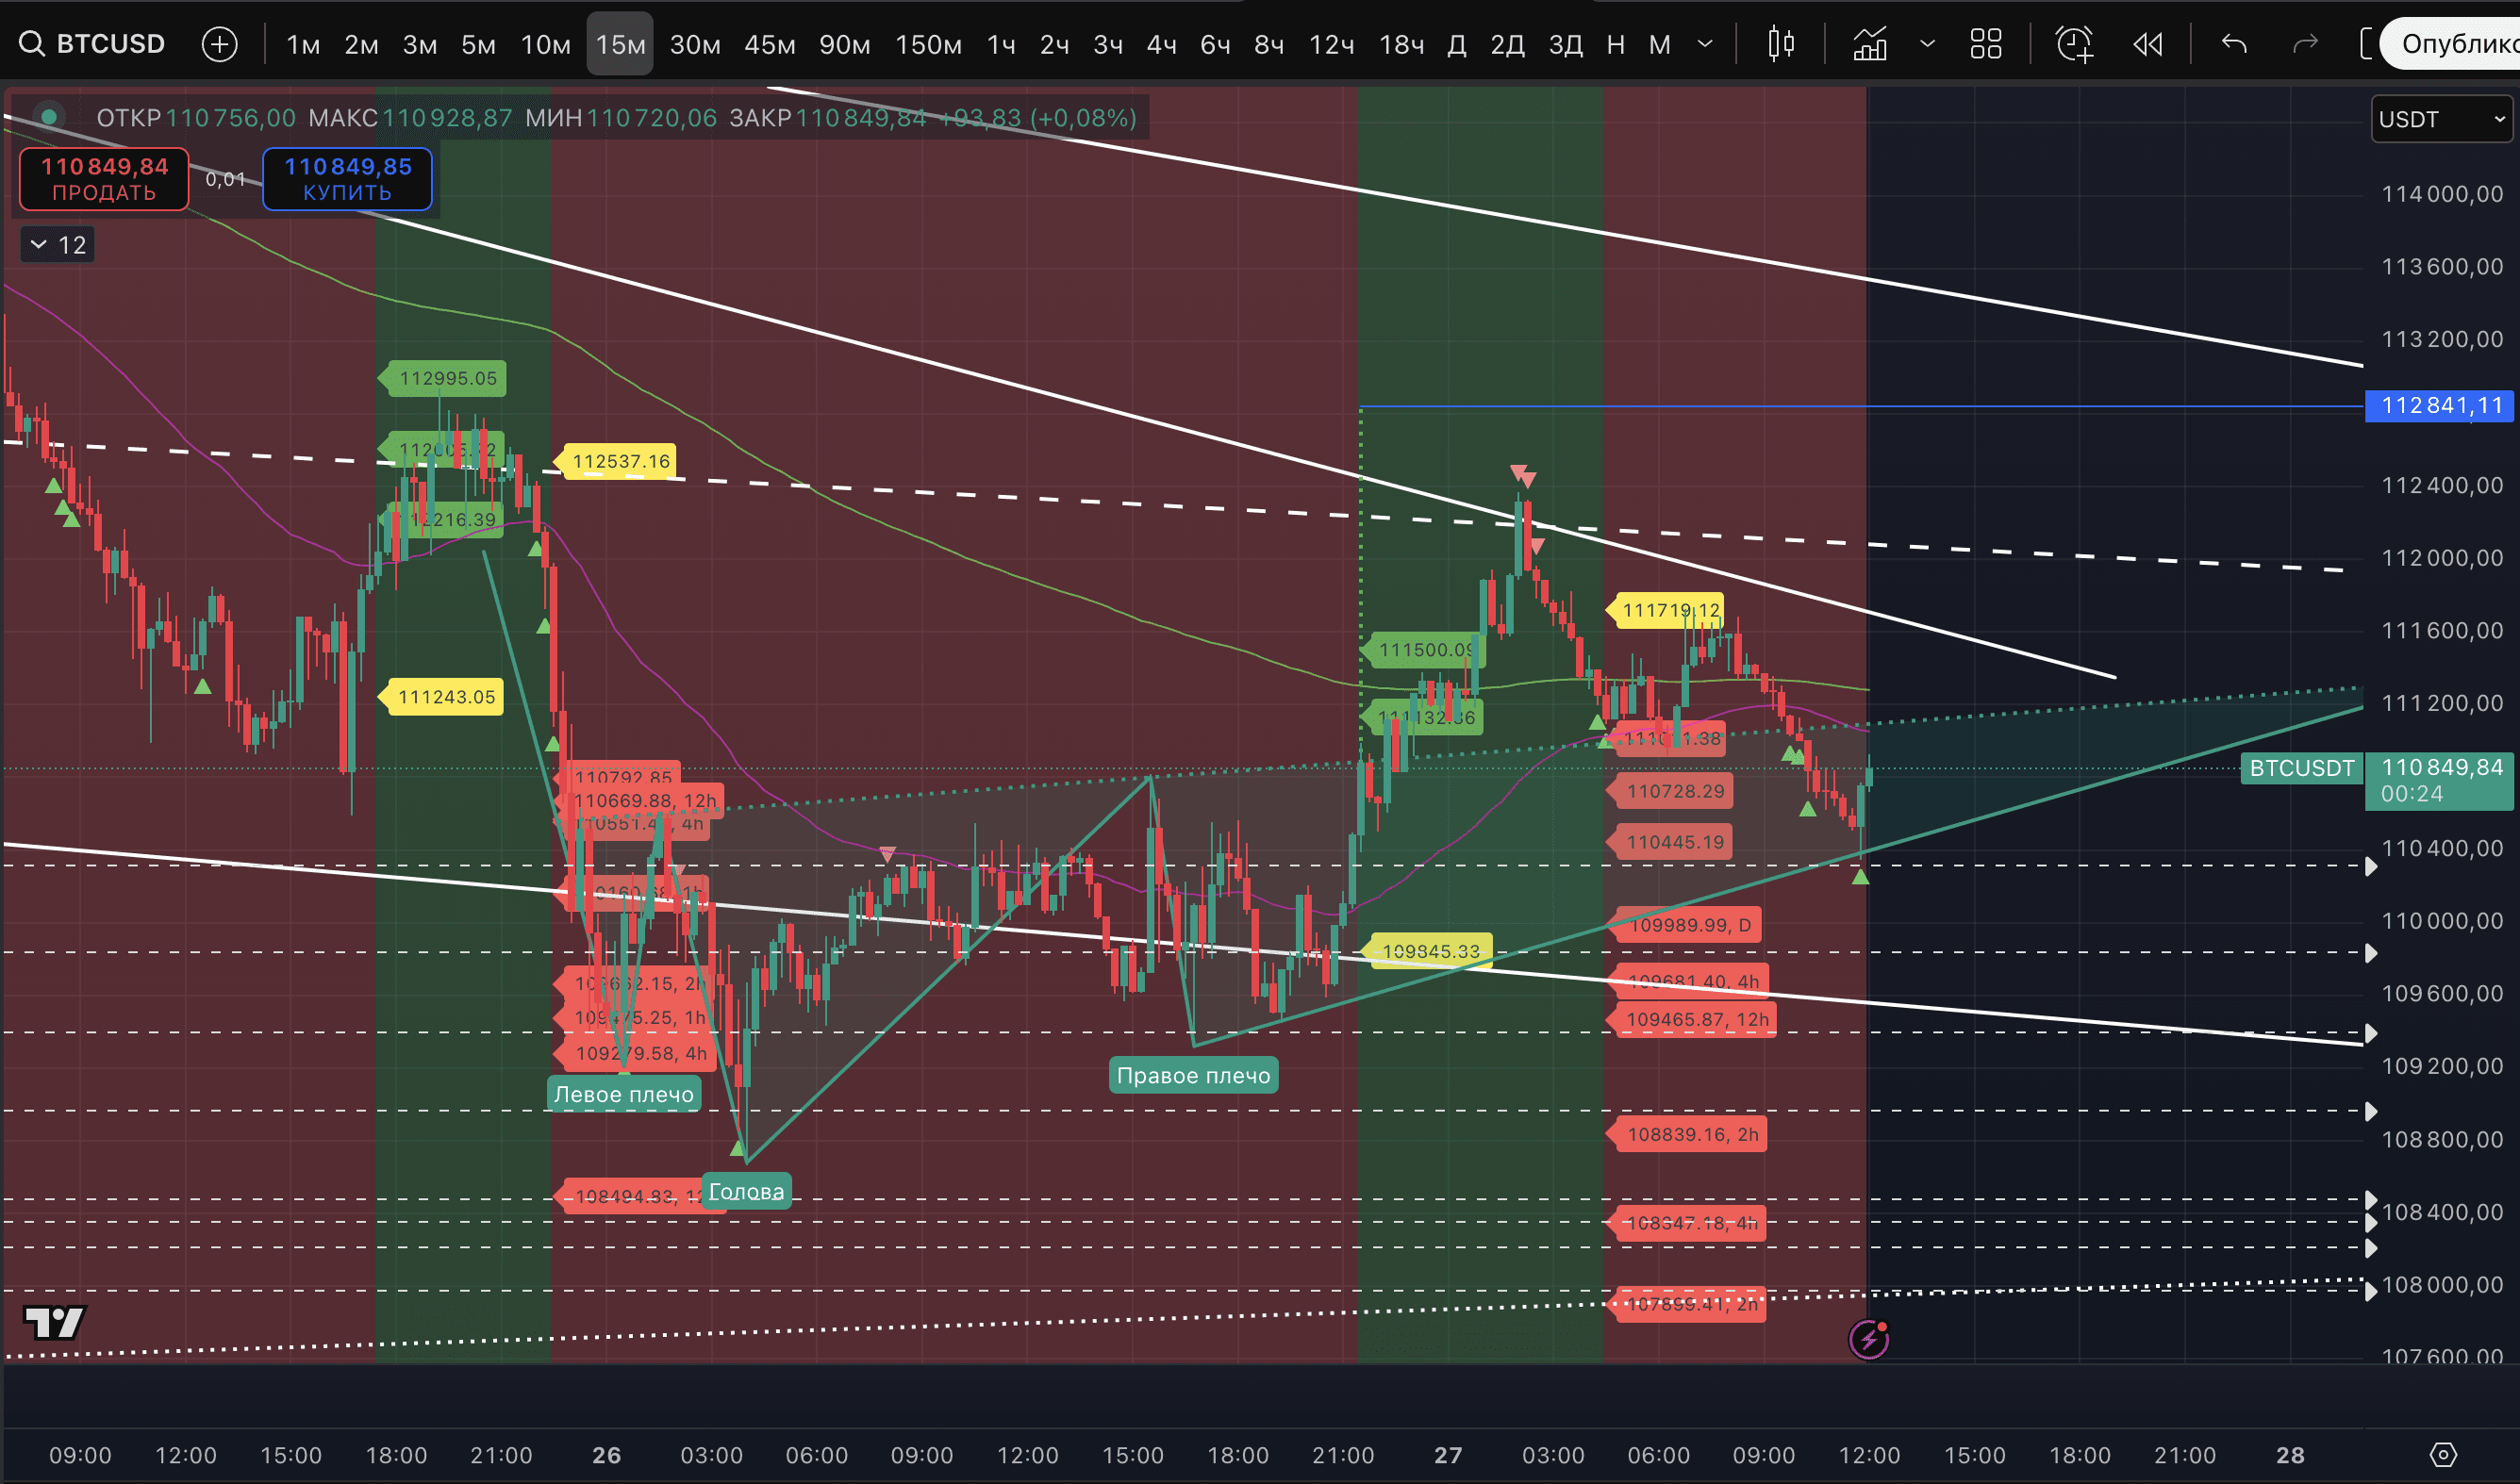
Although, on the negative side, the uptrend has been lost on the 15- and 30-minute TF.
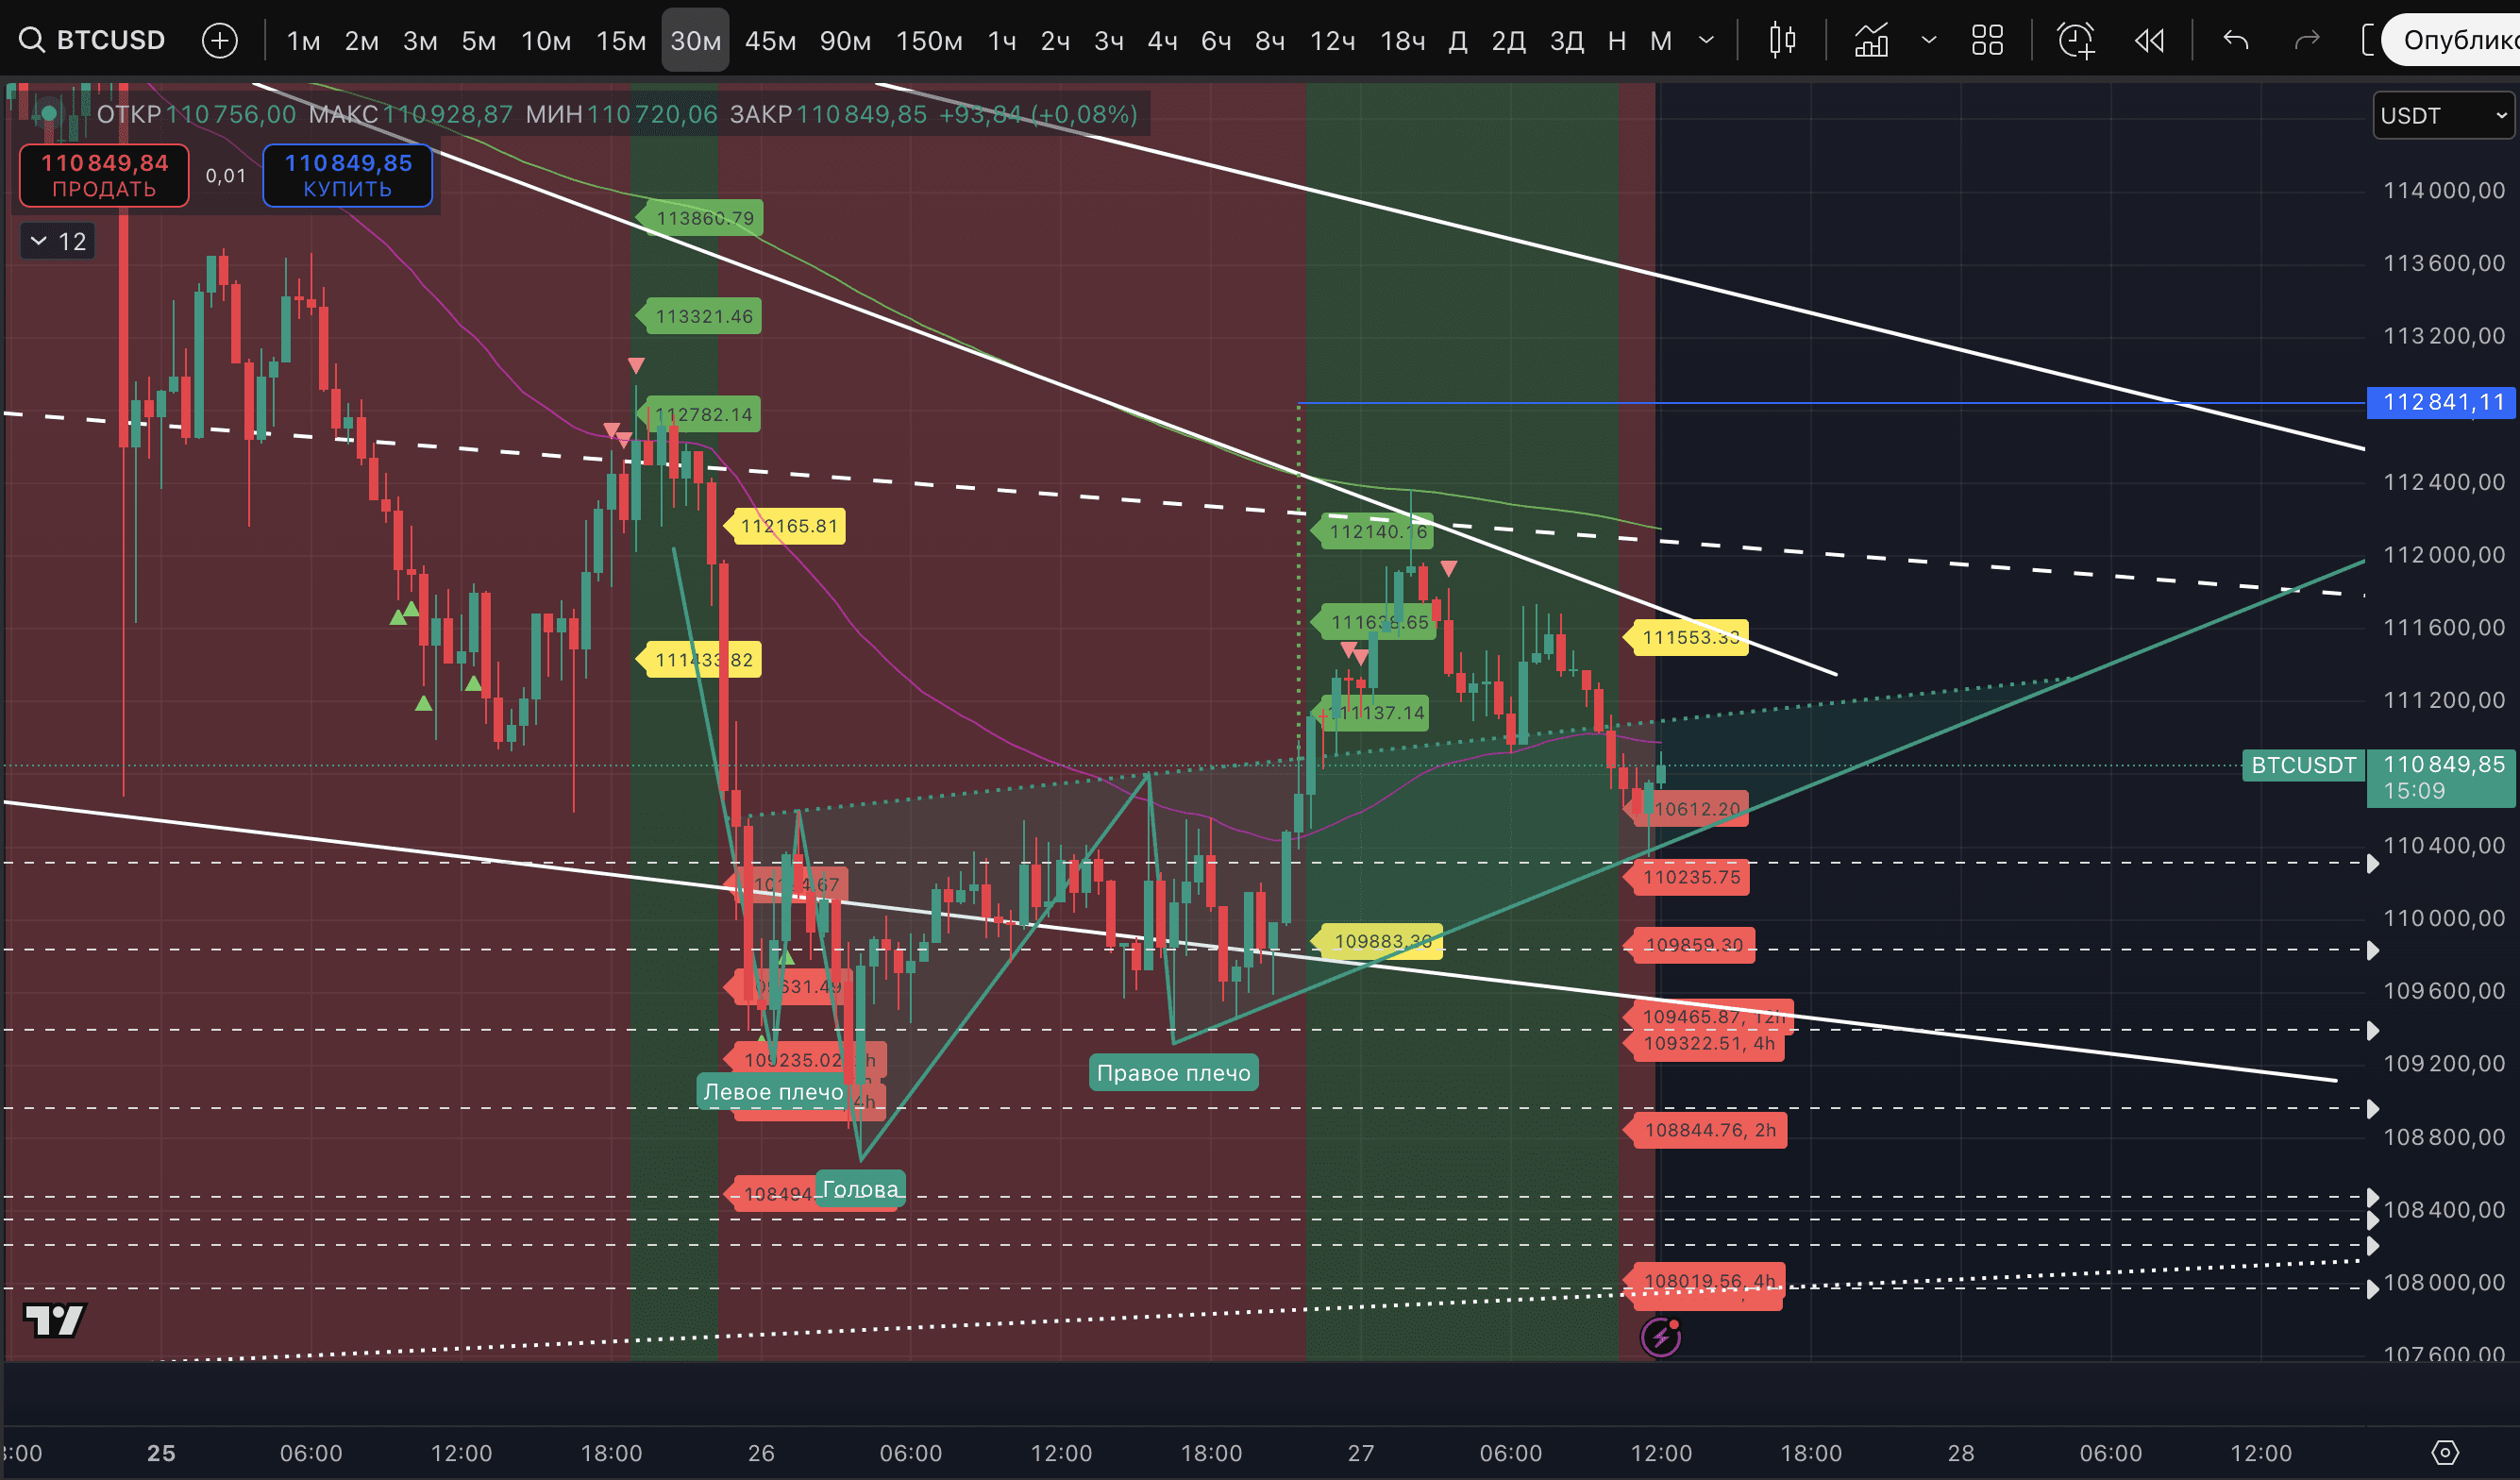
Returning to a downtrend on the hourly TF will increase the risk of a breakdown.
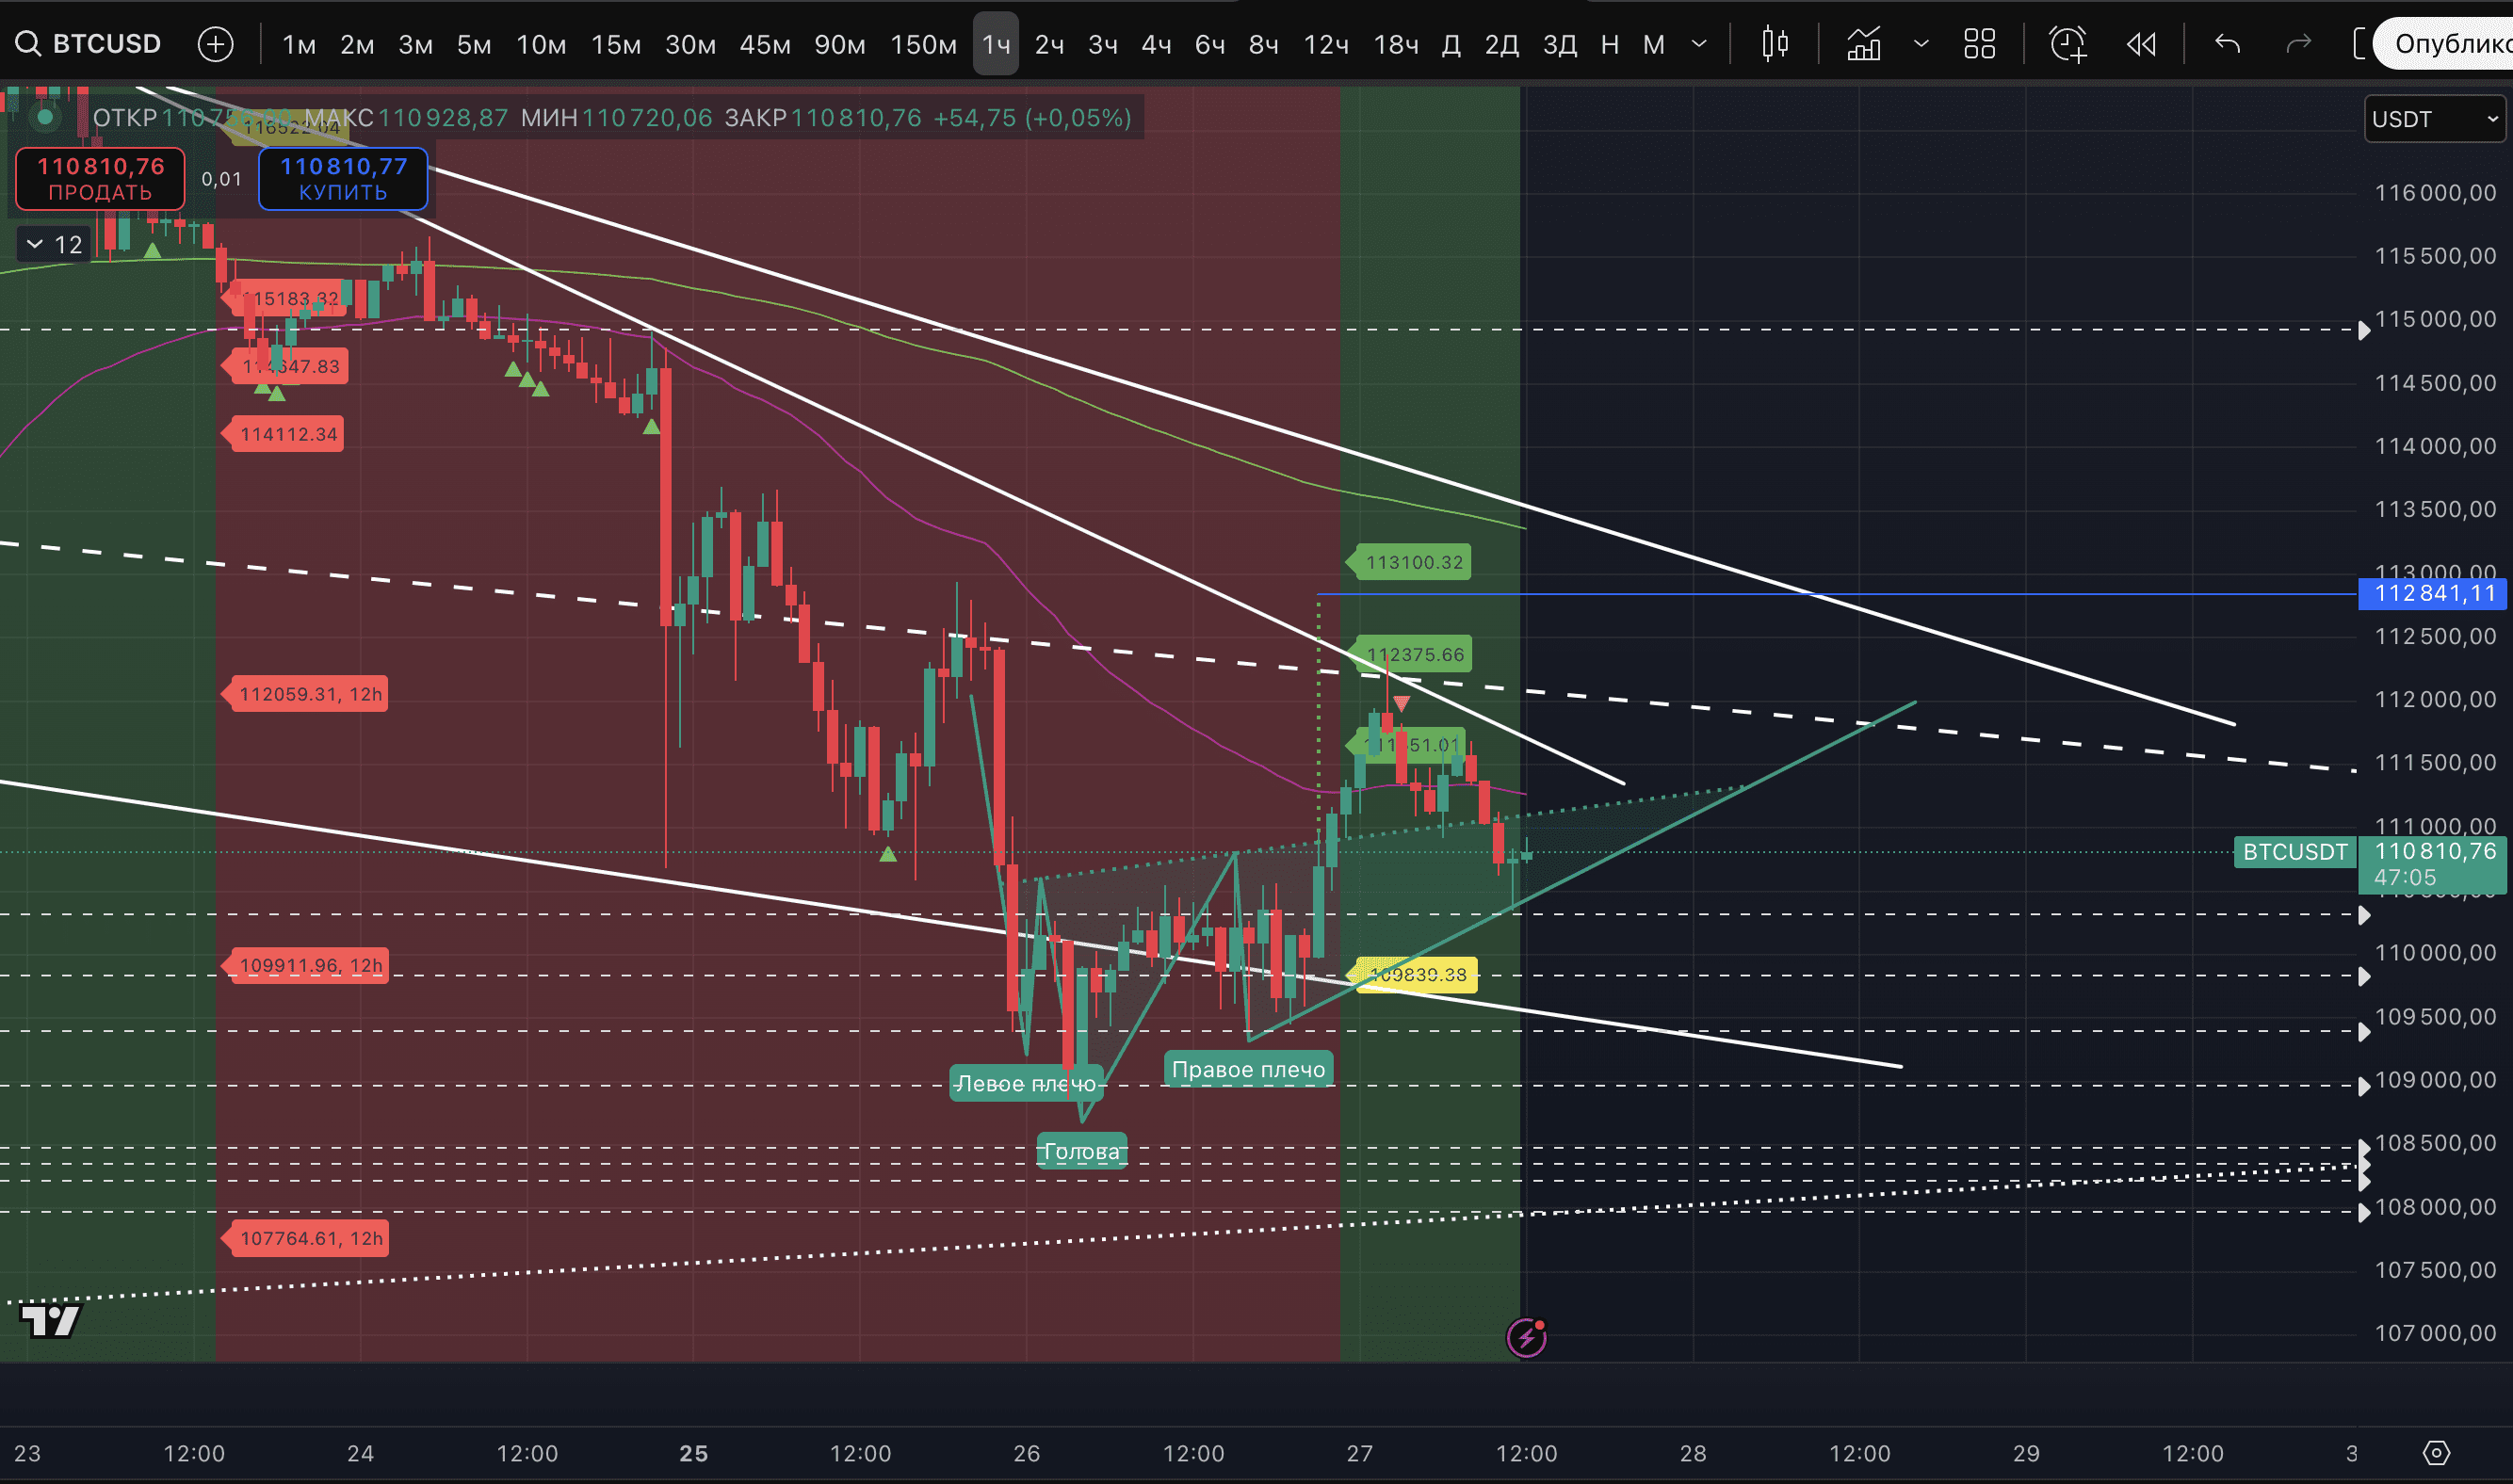
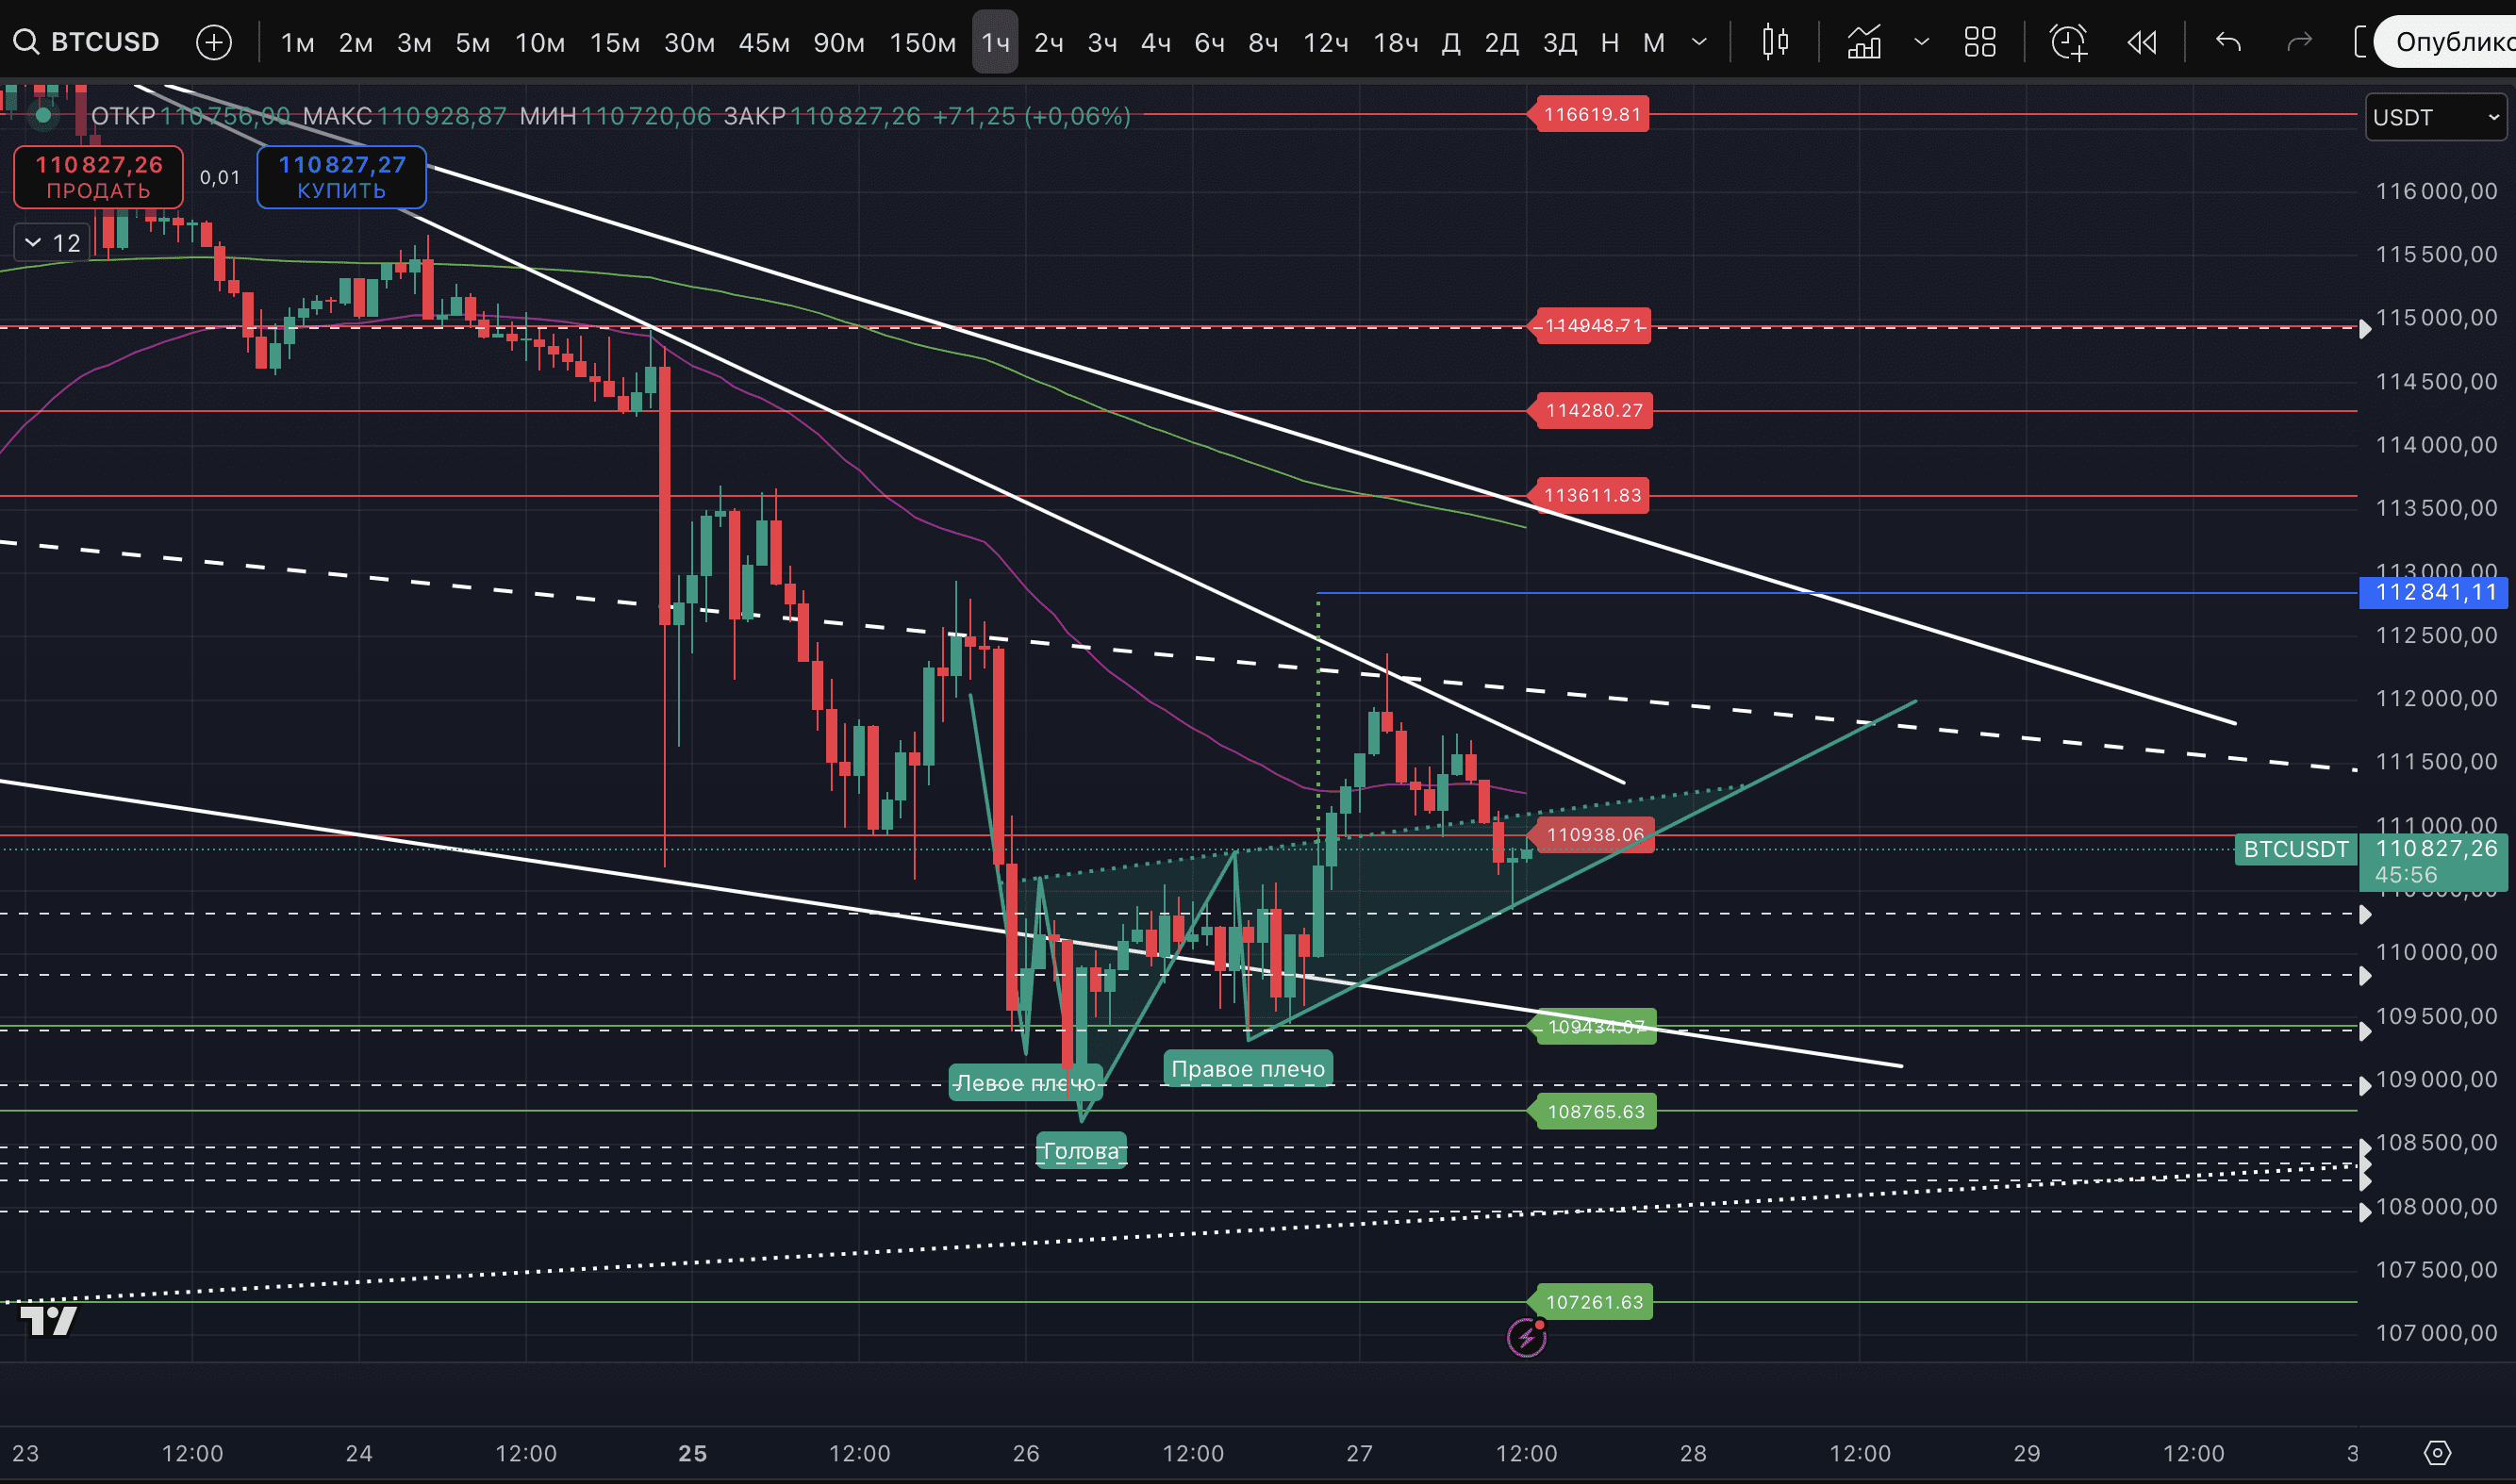
Regarding horizontal levels - it is extremely important to consolidate above $110,938, otherwise the nearest support is at $109,434.
On the 8-hour TF, there is a fourth additional mark of a potential low, which confirms the buyers' attempt to turn the price around.
On the 12-hour TF, it is visible that the price on the rebound has hit two trend lines, one of which is the acceleration of the correction since August 22.
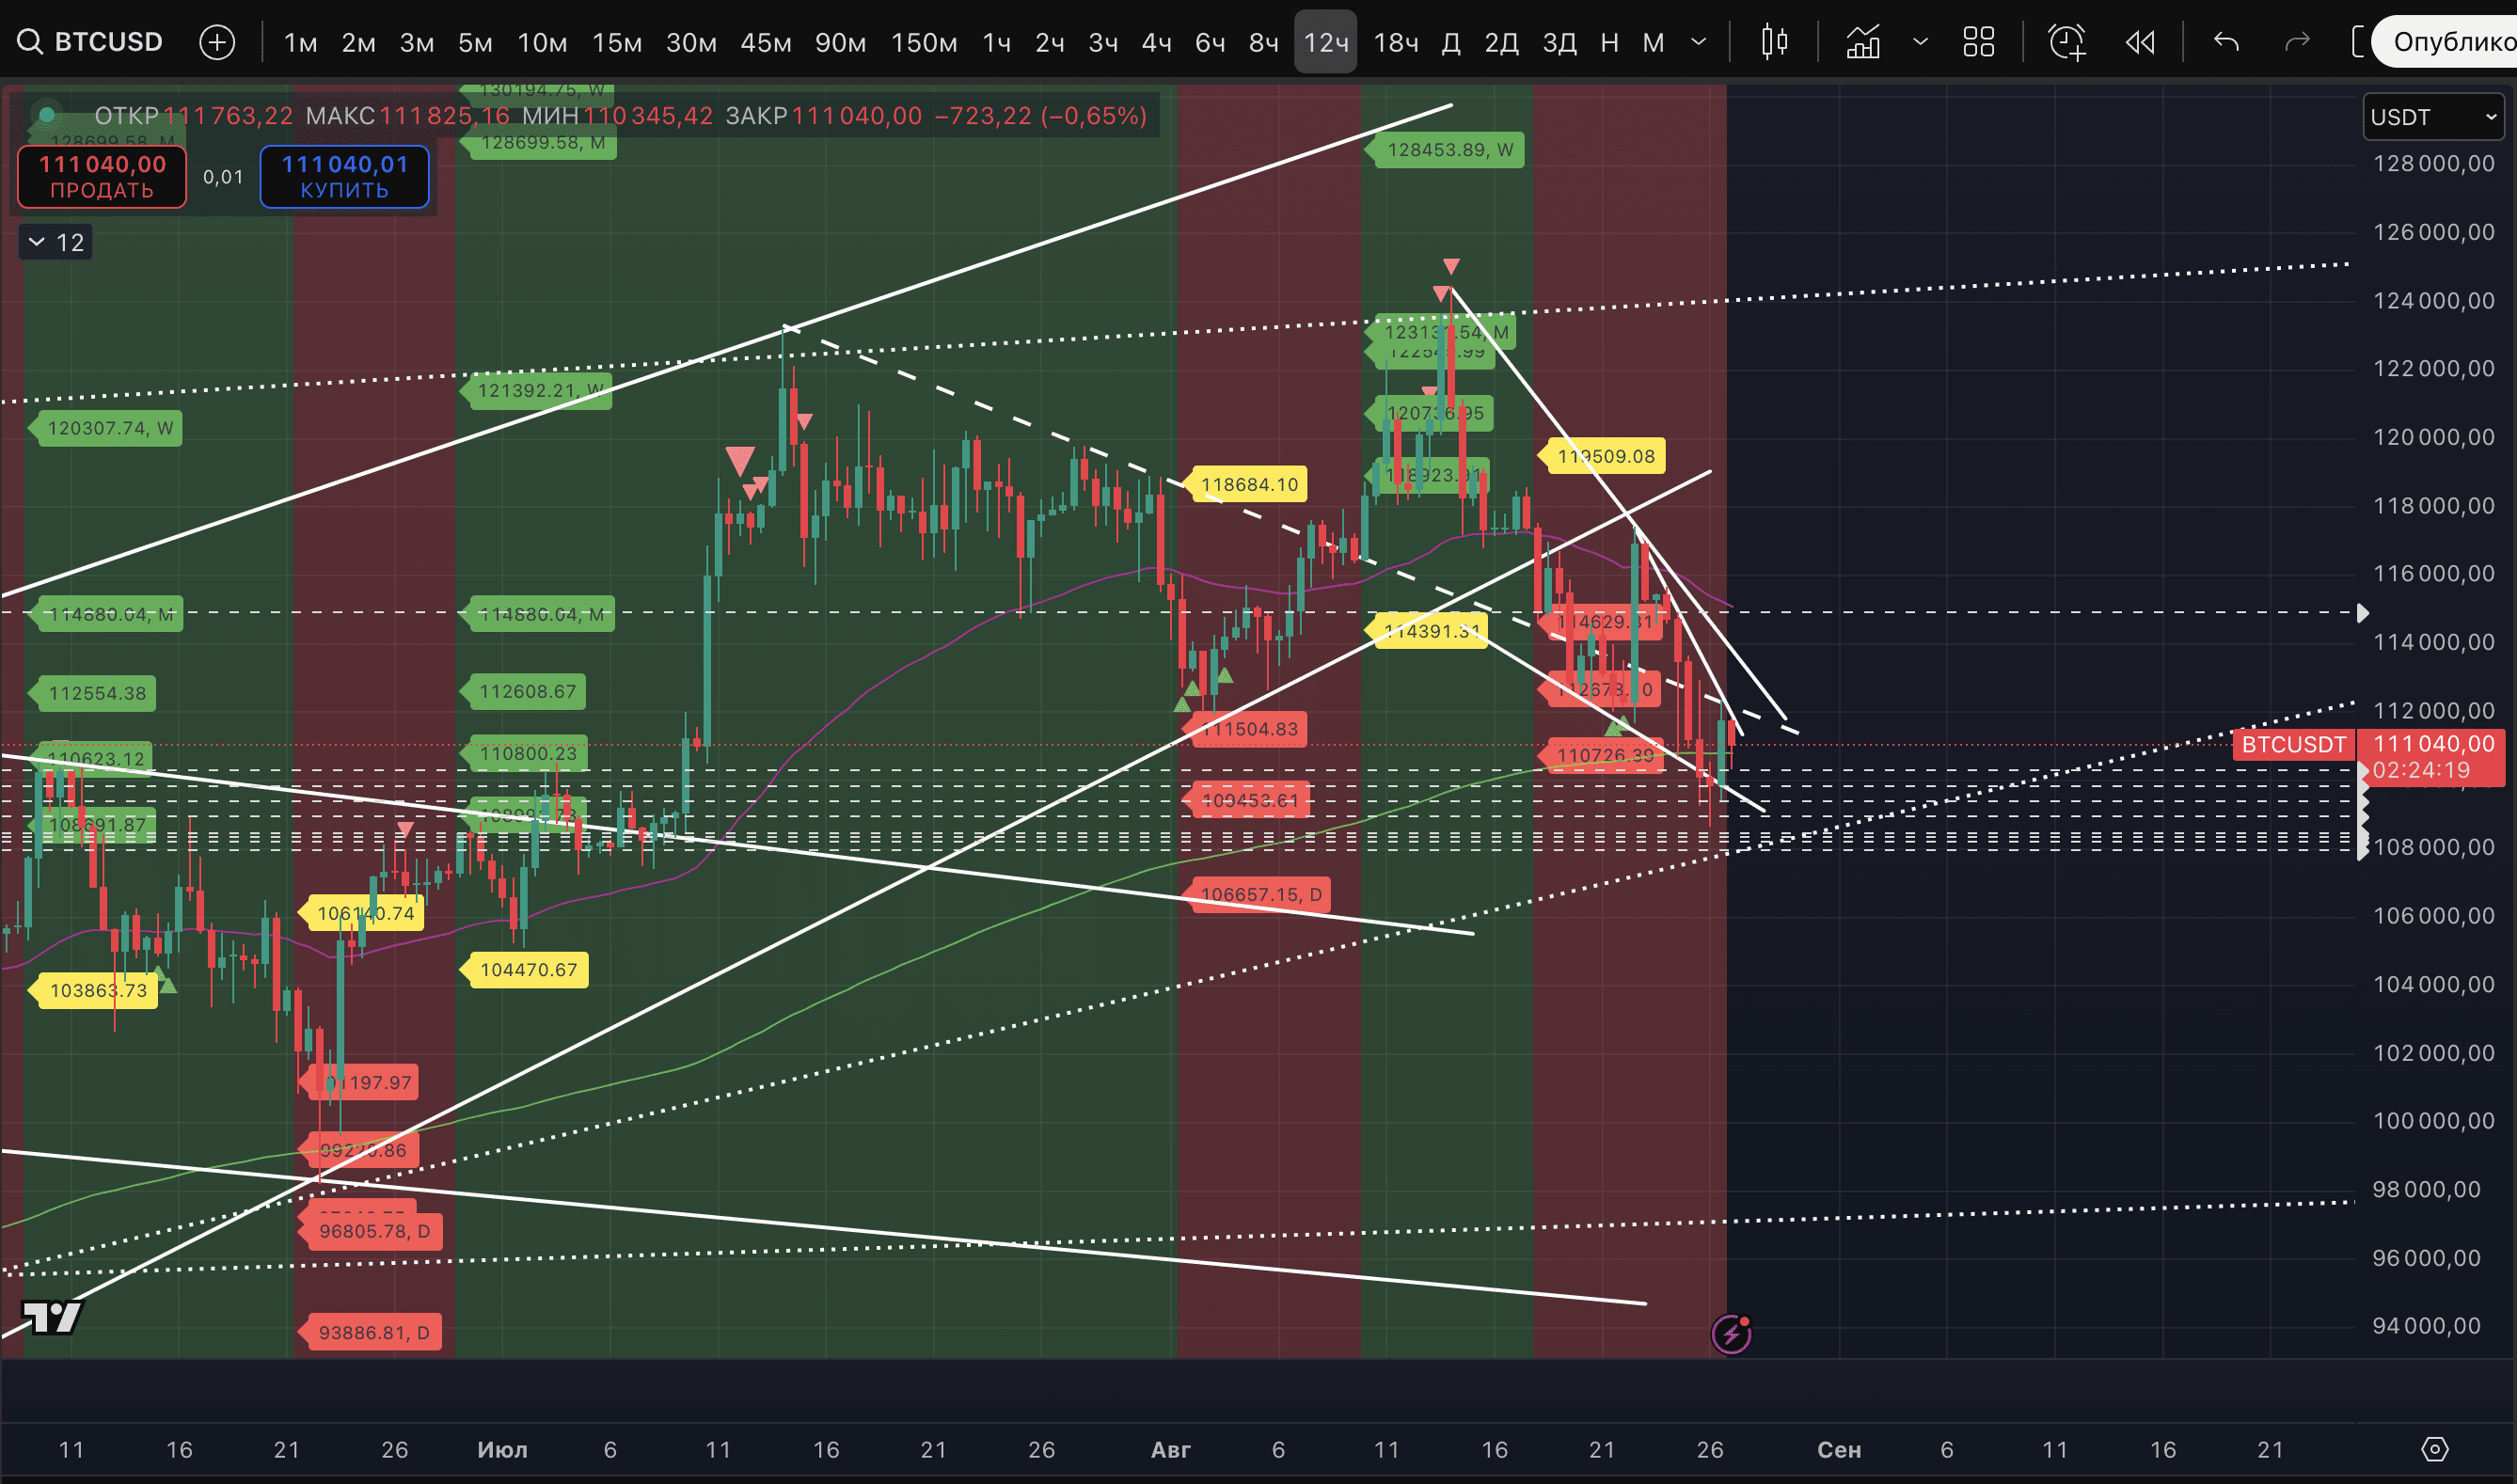
Also on this TF, it can be seen that the price managed to recover above the EMA 200, which was broken during the manipulation of a large player on Sunday evening. This moving average is at $110,793. Approximately the same level is where the EMA 50 of the 2-day TF is.
This is a combo of moving averages that we have already noted as strong support and considered them 'armor'. But again - the manipulation with more than 20,000 #BTC at the moment did its job. From the EMA perspective, as long as the price is above these two EMAs - everything is good for the bulls.
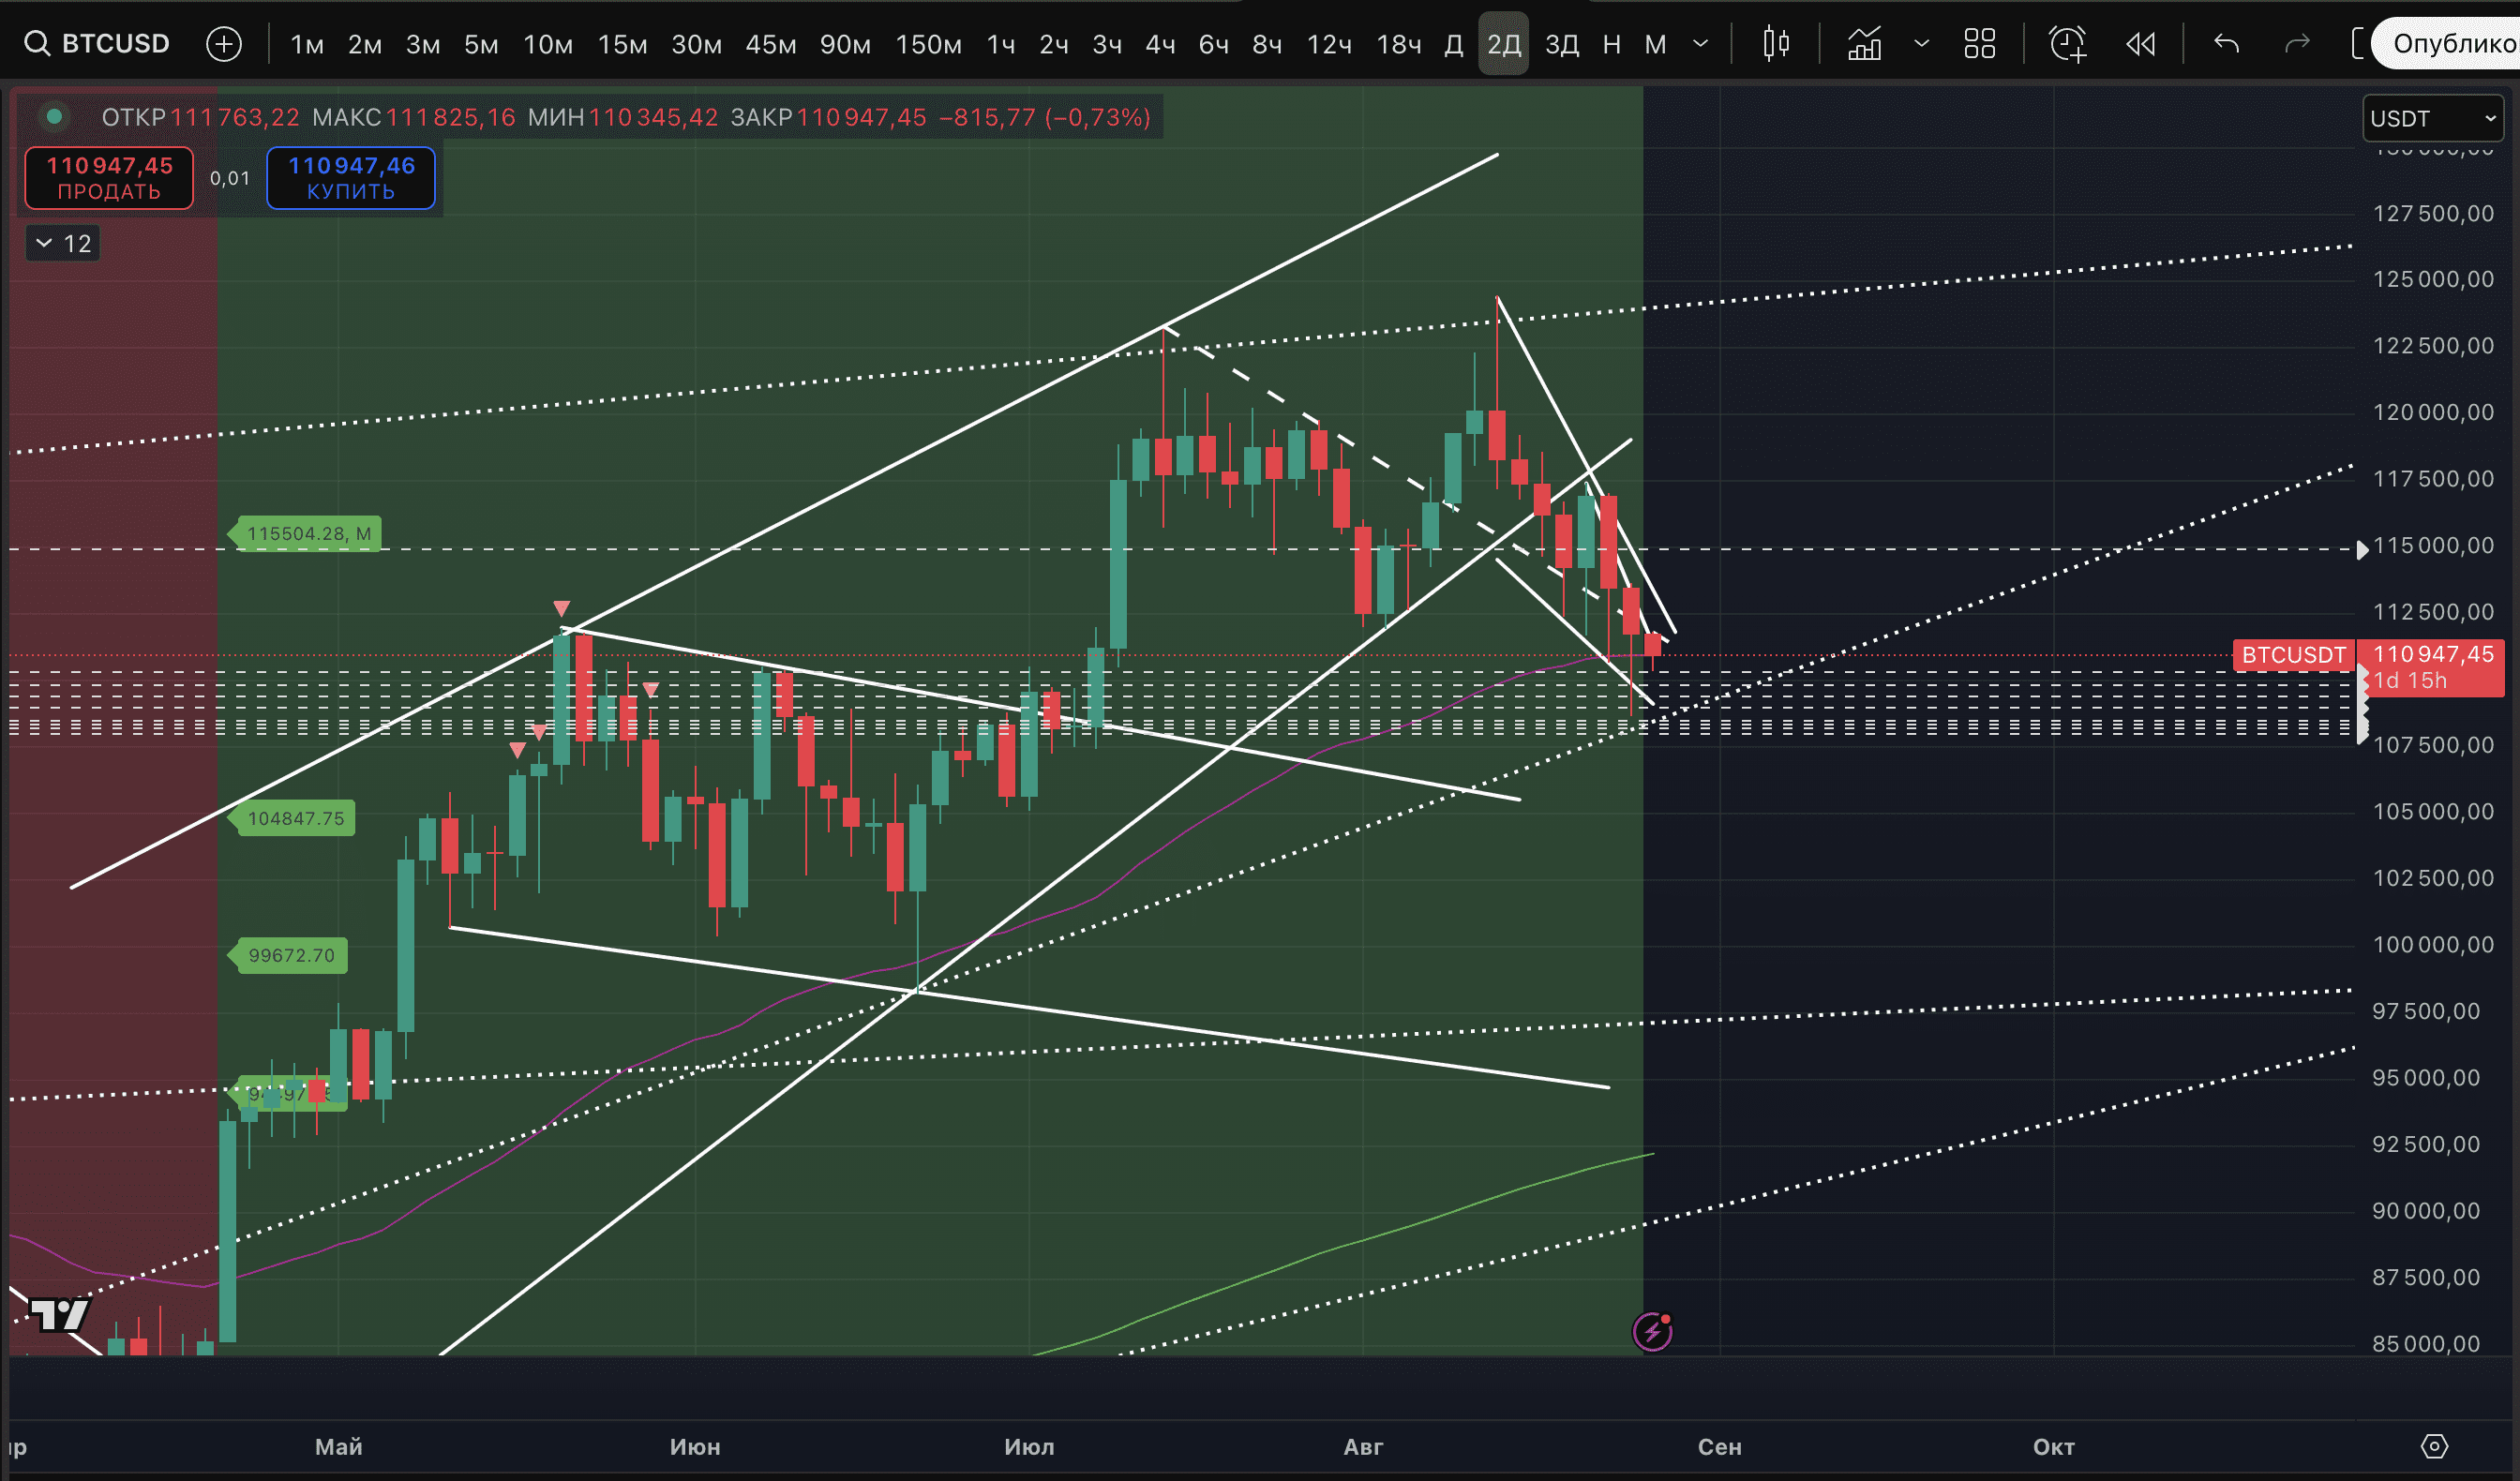
In the screenshot of the same 2-day TF, it is also clearly visible that the price dumps to $108,666, testing the mirror zone, which served as a mirror zone from the end of March to the beginning of July.
In general, we can reasonably assume that we can even talk about maintaining a 'Bullish Wedge', because the move to $108,666 was an anomaly and the price was returned to the figure. If the figure starts to play out now - it would be a rise targeting $123,000, but so far there is certainly not enough buying power for that, and stable downtrends remain on important hourly TFs according to our indicator. Therefore, one cannot be confident in such a wedge scenario.
IN SUMMARY: the current situation can be considered the start of an attempt to recover, BUT there is still no consolidation above $111,728 - everything is shaky.
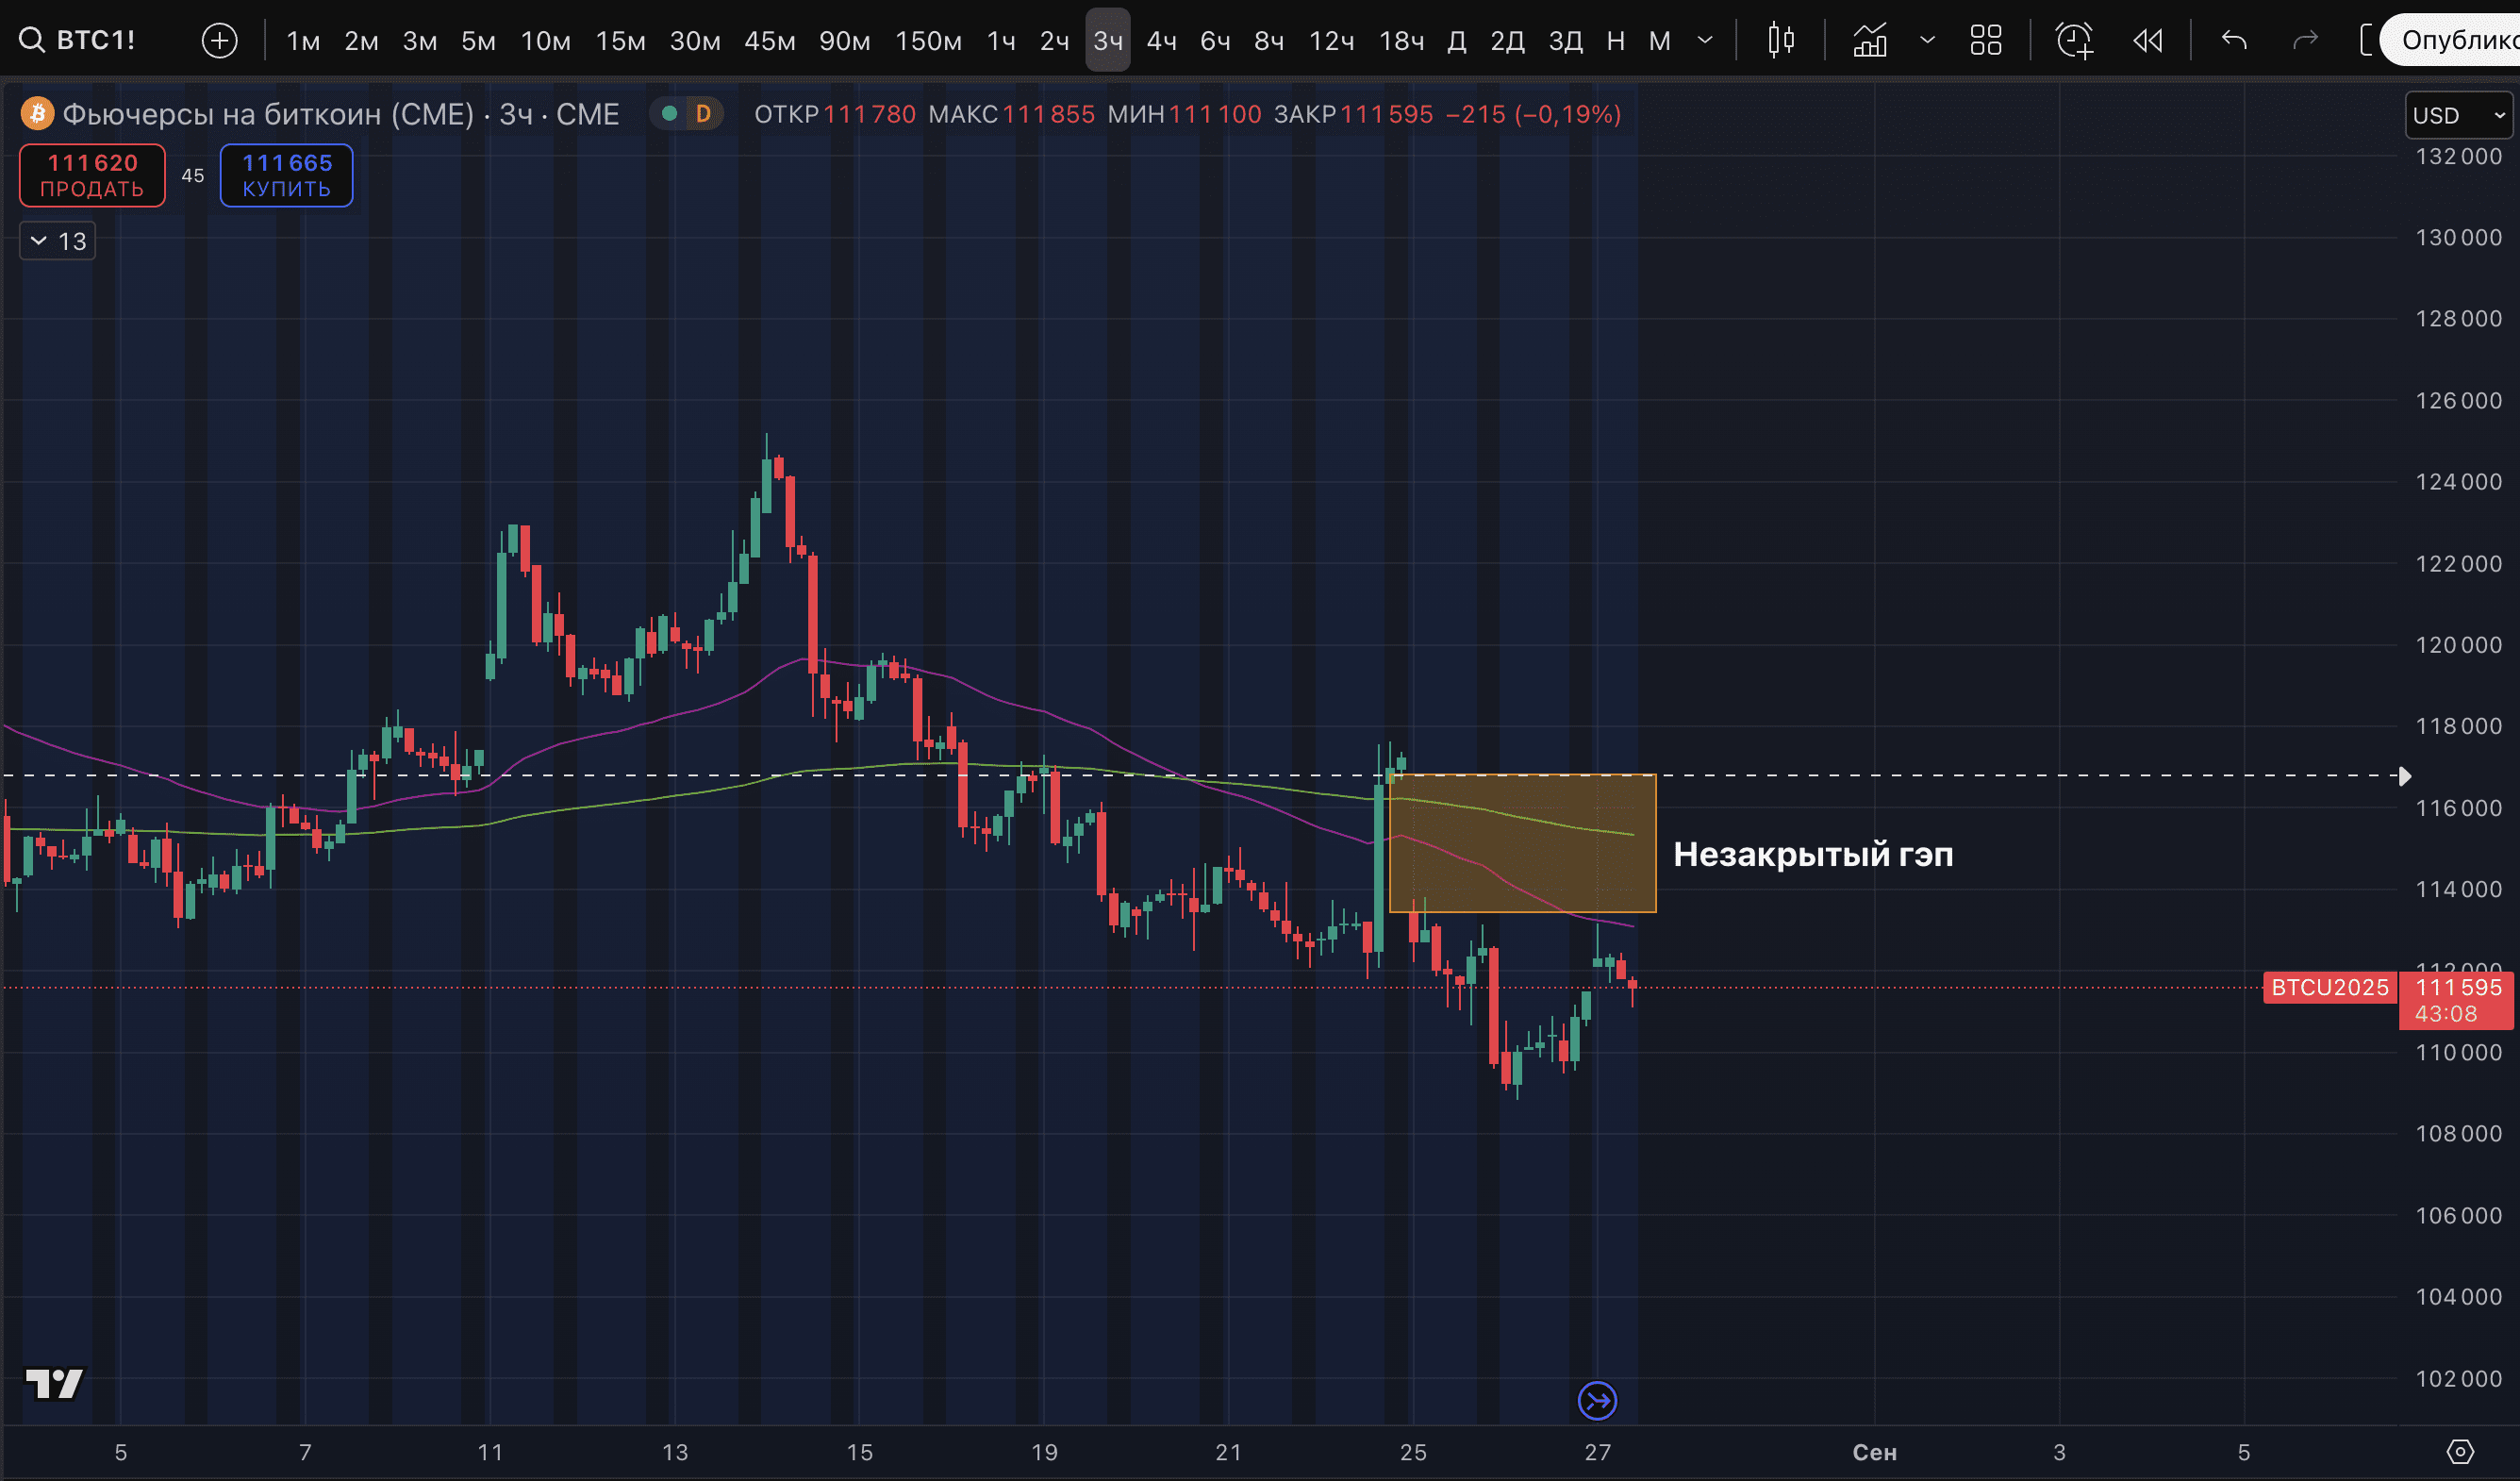
ps: on the BTC futures chart on the Chicago Mercantile Exchange, there remains a gap of $113,450-$116,815. The price almost reached its lower boundary last night, but more confident growth signals are needed to close it.