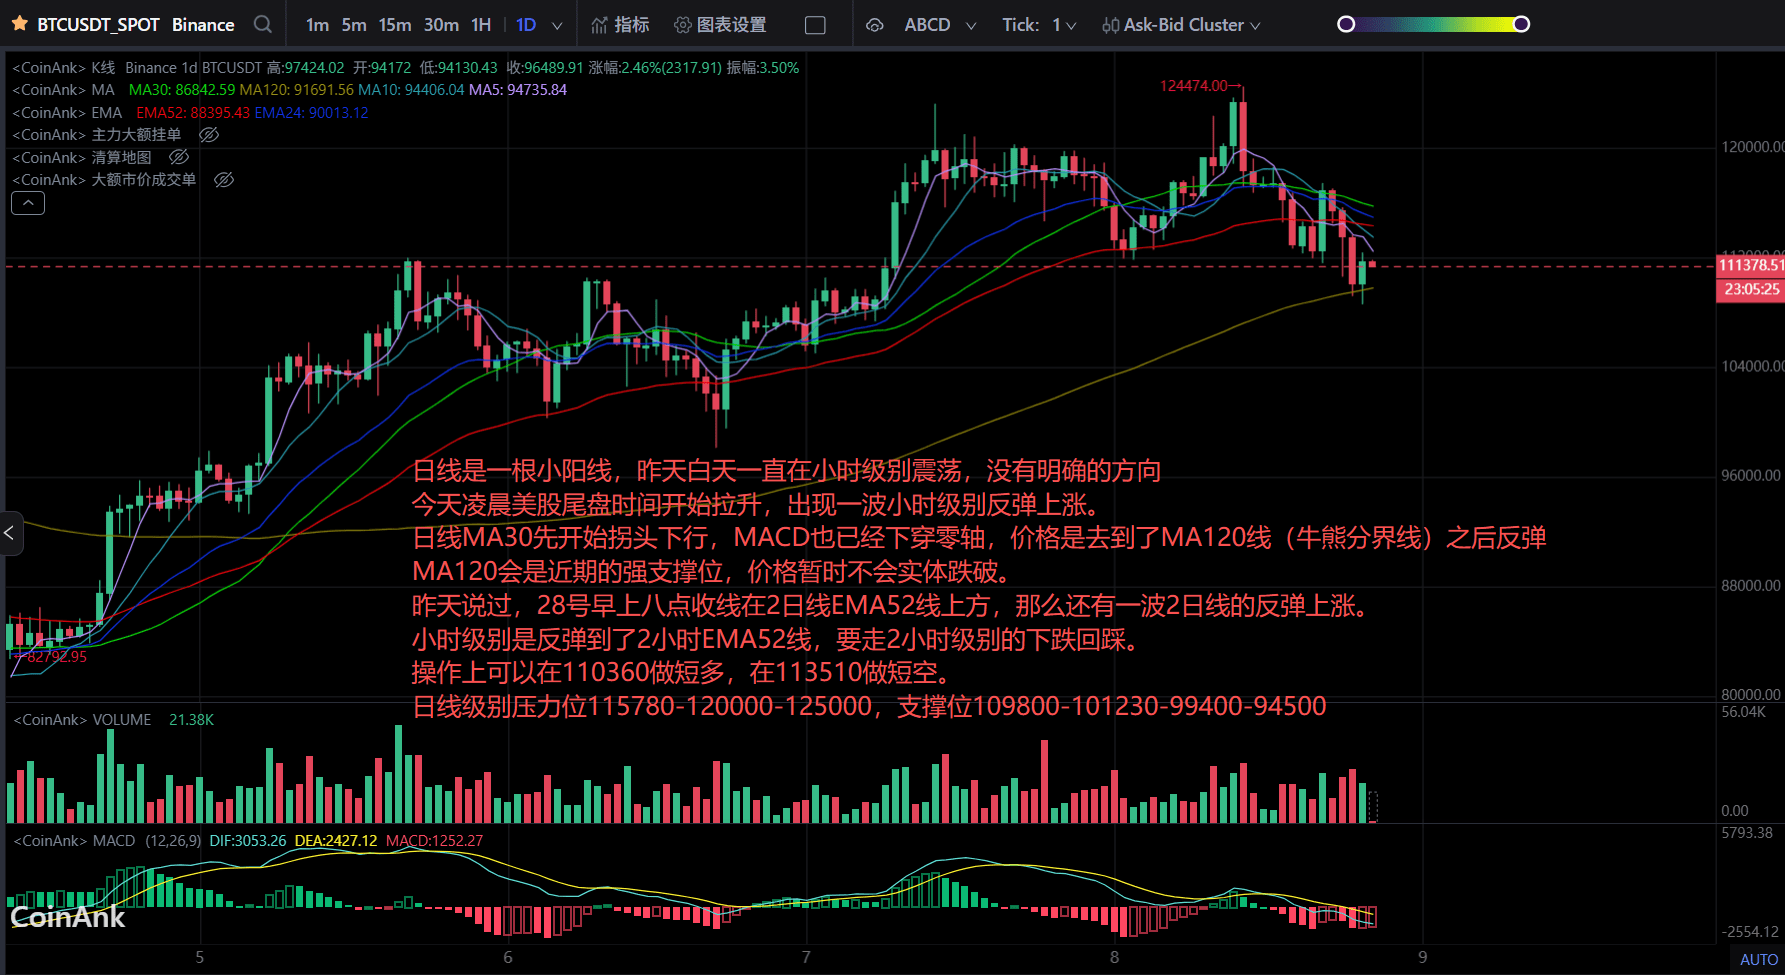
The daily chart shows a small bullish candle. Yesterday during the day, it was oscillating at the hourly level without a clear direction. This morning, as the U.S. stock market approached closing time, there was a rise, resulting in a wave of hourly level rebound upward.
The daily MA30 has started to turn downward, and the MACD has also crossed below the zero line. The price has rebounded after reaching the MA120 line (the bull-bear boundary), and MA120 will be a strong support level in the near term; the price is unlikely to break down below it.
As mentioned yesterday, if the closing at 8 AM on the 28th is above the 2-day EMA52 line, then there will be another wave of rebound upward at the 2-day line.
The hourly level has rebounded to the 2-hour EMA52 line, and it is likely to experience a downward pullback at the 2-hour level.
In terms of operation, a short position can be taken at 110360, and a short position can be taken at 113510.
The daily level resistance is at 115780-120000-125000, and the support levels are at 109800-101230-99400-94500.