On 25/08/26, Bitcoin's box was broken, and Ethereum showed a false breakout, leading to discussions about the bull and bear market.
Bitcoin has officially broken below the bottom support of 112000. After Ethereum reached a new high of 4957, there was a false breakout on the daily line, so the logic that has been running for years hasn't changed: BTC, ETH, altcoins, and MEME continue to cycle. At this point, discussions about whether it is a bull or bear market have arisen, but I choose not to comment.
At the end of 2022, when Bitcoin was over ten thousand dollars, I believed that there would be a Spring Festival rally, and my bullish view on Bitcoin has remained unchanged. The only significant correction I anticipated was during the pullback from 49,000, but after breaking through 49,000, I continued to expect a bull market.
I have always felt that there is nothing new under the sun. The world is bustling, all for profit. After the approval of the gold ETF, a 10-year bull market began. Interestingly, many concerns raised today by skeptics of the Bitcoin ETF are essentially the same as those raised by short sellers of the gold ETF years ago. Below is a comparison of the gold ETF and the BTC spot ETF.
The first gold ETF was launched in 2004, solving problems such as storage and low trading efficiency in traditional gold investment, achieving the 'democratization' of gold investment, which pushed gold into an 8-year bull market. After its launch, the price increased by 286.90% over the next eight years (compared to only 16.84% in the previous eight years).
Early investors are mainly retail investors (with institutions accounting for 36%). There were concerns in the market about how novice investors would react in a bear market, but the transformative impact of ETFs on the gold market is significant.
Comparison between Bitcoin ETF and Gold ETF
Similarity: Both achieve asset 'democratization' by lowering investment thresholds. The Bitcoin ETF also addresses bottlenecks such as self-custody and trust in exchanges. Concerns in the market regarding both are similar (e.g., reversal of capital flows in a bear market).
Difference: The initial performance of the Bitcoin ETF far exceeded that of the gold ETF—BlackRock's Bitcoin ETF (IBIT) surpassed $10 billion in scale within 7 weeks, while the gold ETF (GLD) took two years; in the first three months of 2024, the capital inflow into the Bitcoin spot ETF far exceeded that of the gold ETF, even diverting its funds.
There are too many specific data points to list one by one; I will explain in detail in the video when I have the opportunity.
Bitcoin
Bitcoin's daily line has continued to decline, breaking below the bottom of the 22nd and the support of the daily box. Currently, the entire rebound is weak. As long as the resistance at 112000 cannot be reclaimed, the downward trend will continue. Currently testing the support of MA120. If it continues to decline, support is at 98000 to 100000, which is an important psychological barrier for bulls.
The daily MACD histogram continues to grow underwater, and the OBV indicator's double line is turning downward. It is not specific to guess at which point a rebound signal will appear.
Support: 98000 to 100000
Pressure: 112000 to 114500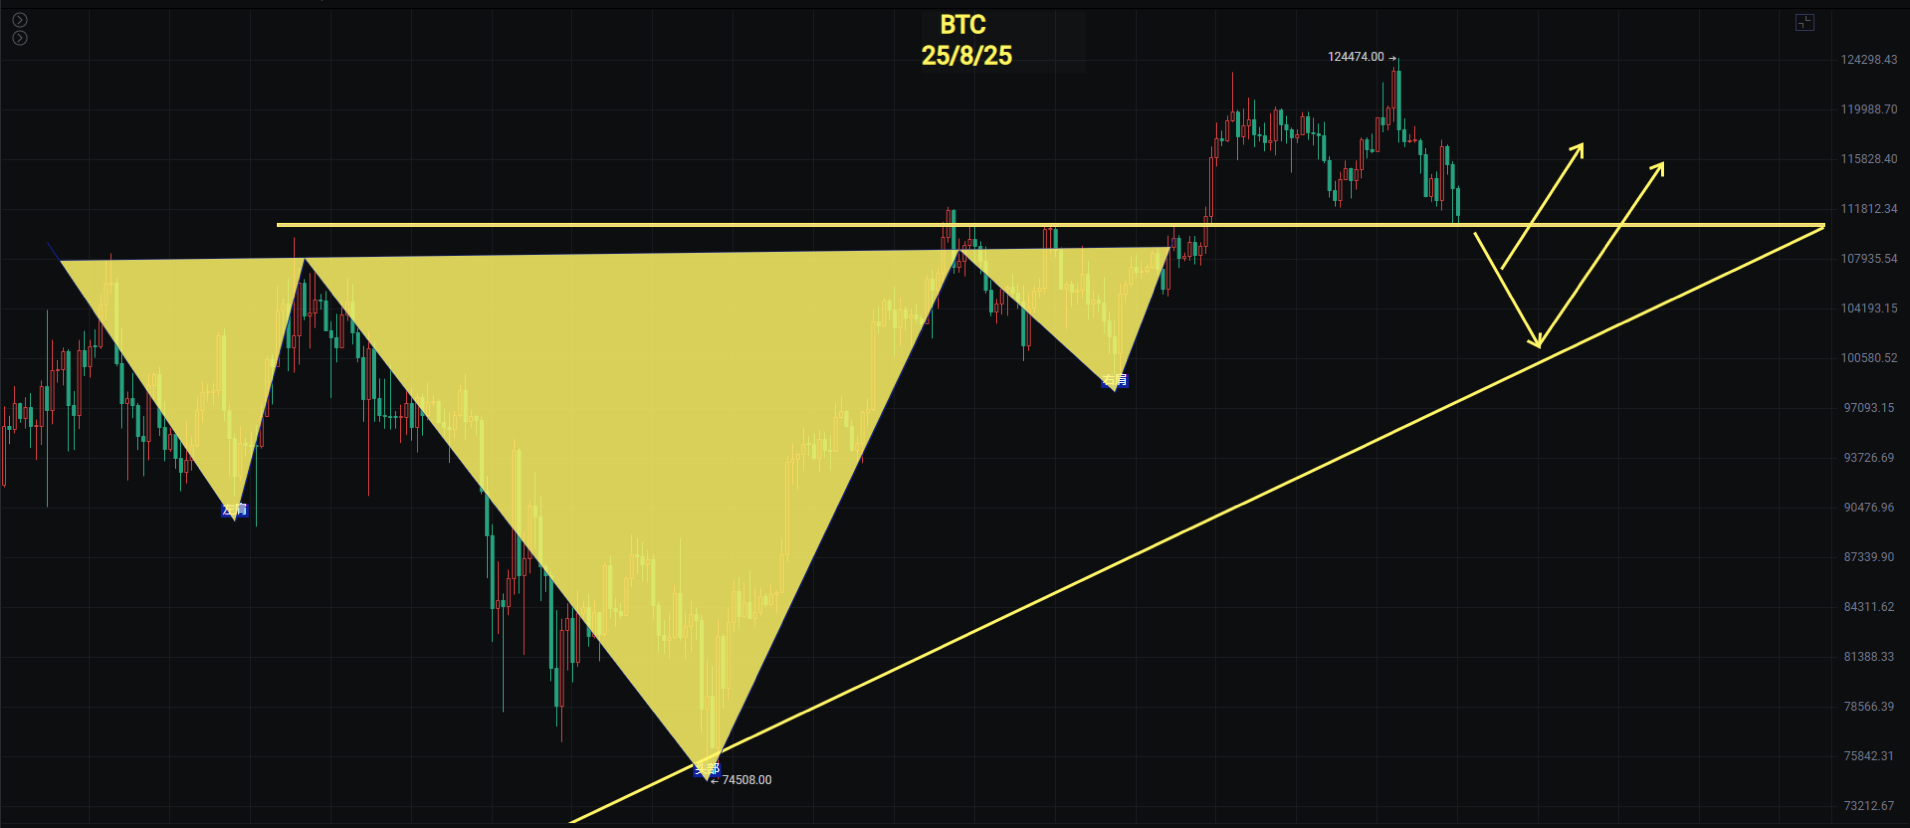
Ethereum
The daily line shows a clear false breakout. There is currently a tendency to form an M-top, and there is also a potential shark pattern in the daily line pointing towards around 3500. The daily line has also shown a continuous top divergence, with this wave increasing by 2.5 times, marking the largest increase for Ethereum in a single wave in recent years. Therefore, the extent of the pullback still needs to be monitored to acquire more cost-effective chips.
In the 4-hour chart, the price tested the rising support line since 2111 and is currently maintaining around 4400. If the 4060M head breaks, it is believed that the price will find good value in the range of 3300 to 3600.
Support: 3500 to 4060
Pressure: 4788 to 4956


