Mig sees through the candlesticks; behind the code is human sentiment.
Technical analysis in depth
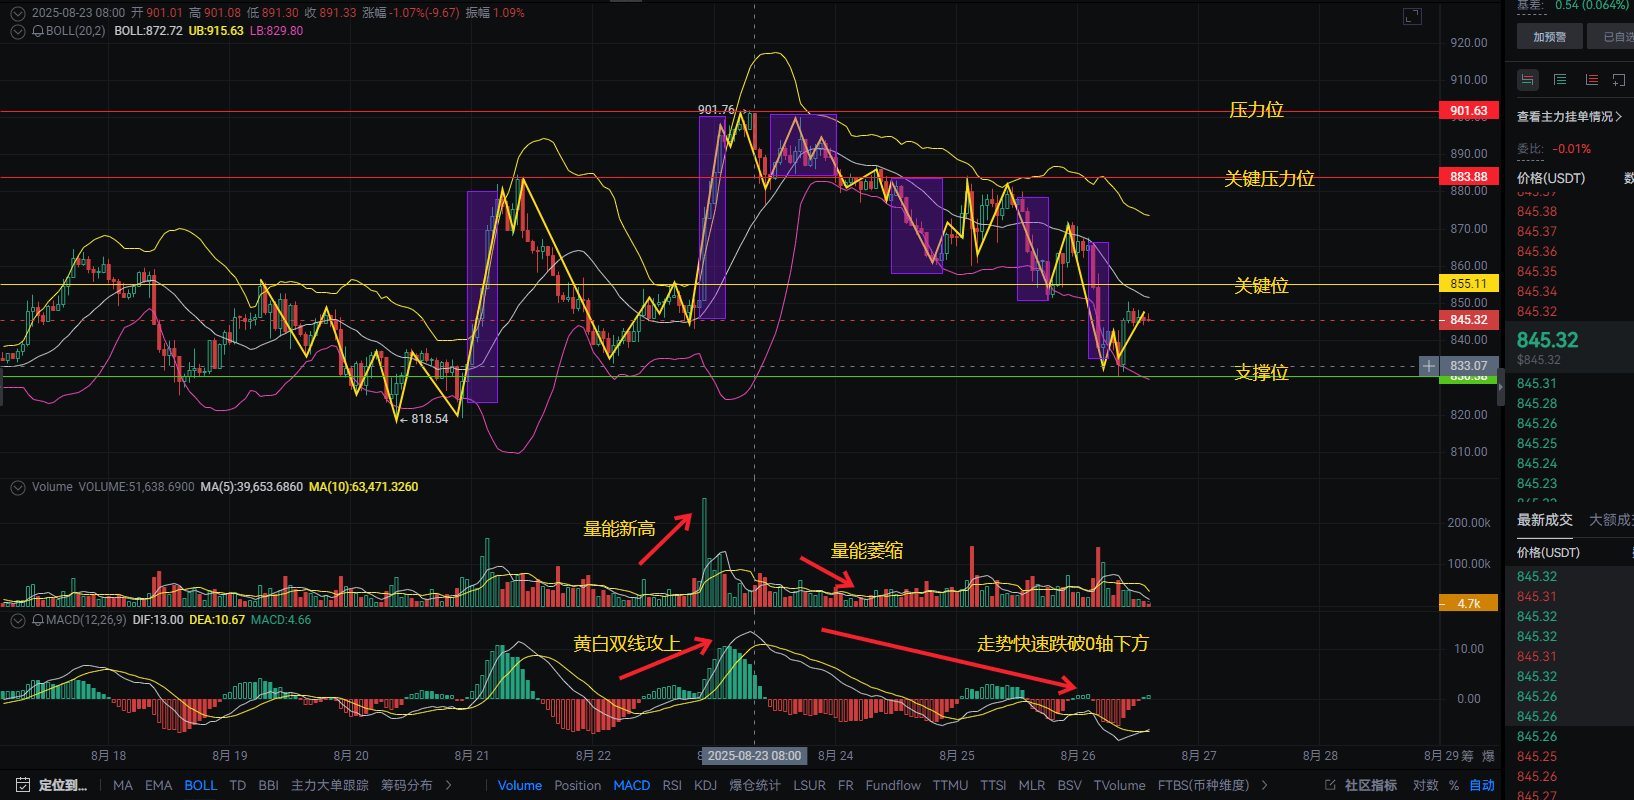
Currently, the BNB/USDT 1-hour candlestick is slightly rebounding near the lower Bollinger band but has not yet stabilized at the middle band, which is a typical inflection point for bulls and bears!
The key level of 855 USD is not only the resistance of the Bollinger middle line but also a dense liquidity area on the on-chain liquidation heatmap—once effectively broken, short stop-loss orders will be forced to close, pushing the price towards 883 USD (first resistance) or even 901 USD (strong resistance)!
However, the MACD is still in a death cross state, and the trading volume continues to shrink, indicating insufficient buying momentum in the short term. If it cannot break through 855 with increased volume, the market may test the support at 830 USD again.
Pay attention here! If 830 is lost, the liquidation wall below will trigger a chain liquidation, and the price may instantly drop below 800 USD!
The liquidation heatmap hides dangers
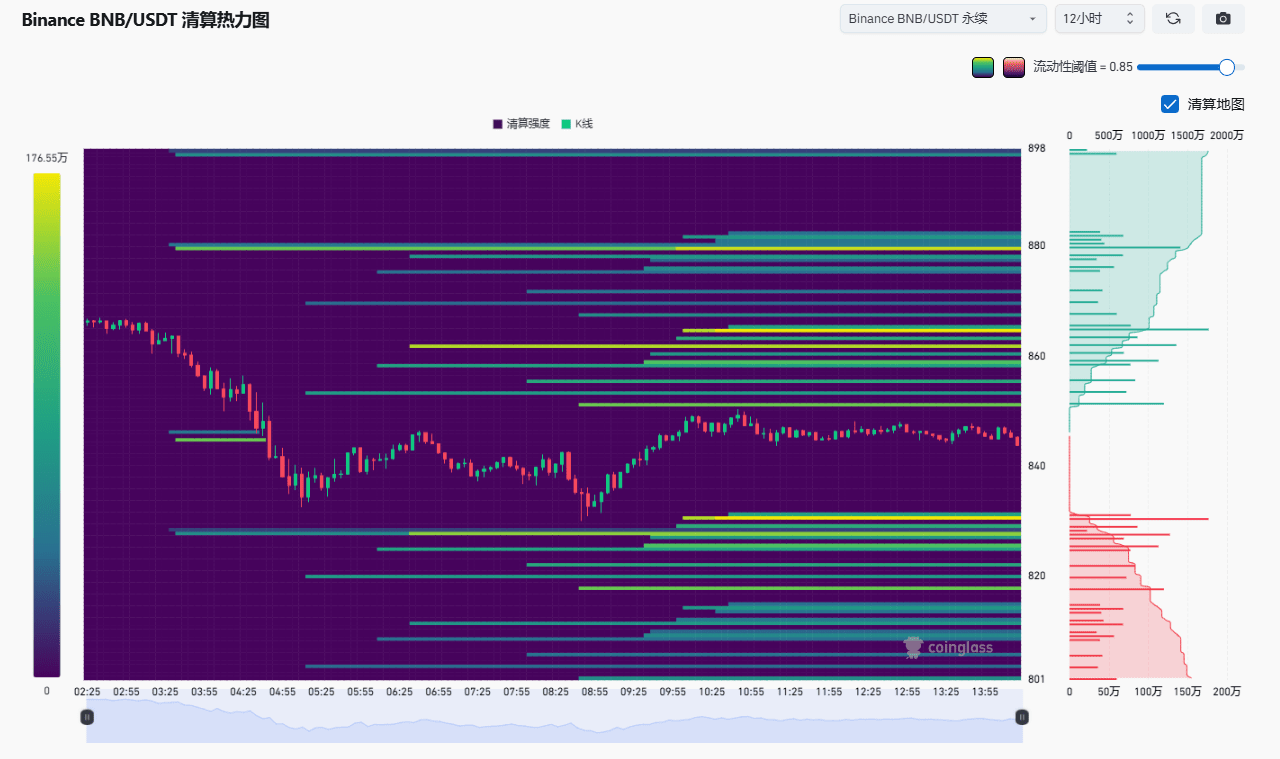
From the liquidation heatmap, it can be seen that the 600-800 USD range has accumulated millions of dollars in liquidation amounts, especially near 830 where there is a large amount of long leverage—this is why 830 has become a key support!
The area near 901 USD above is a dense zone for short liquidations; once broken, the short squeeze will push the price up violently!
Blogger Mig's exclusive viewpoint:
The big players are currently 'drawing doors'—using fluctuations to wash out leveraged retail traders.
855 is the key battleground: a breakout will trigger a short squeeze, heading straight to 901; a drop will lead to a long liquidation, testing 830.
But be cautious! There is a hidden liquidity gap between 842-843 USD on the heatmap, which could be a 'trap level'; the probability of a quick recovery after a false breakout is very high!
Hint: Must-see for fans!
Why is 842 USD referred to as the 'devil's detail'? This price level coincides with both the liquidity gap on the heatmap and the weak points in the L2 order book. If there is a sudden change in trading volume during the night, this could be the starting point for a market explosion!
Want to get the specific operational ideas for the 842 USD strategy?
Follow my next analysis, I will provide real-time breakout signals in the community!
Retail trading advice
Bulls: stabilize at 855 to add positions, targets 883→901, stop loss at 830.
Shorts: try to short near 901, stop loss at 905, target 855.
Onlookers: keep a close eye on the breakthrough direction in the 842-855 range and go with the trend!
Remember: leverage is a devil, position is the king!
Blind trading = losses! Follow Mig and learn professional thinking and strategies, say goodbye to 'feeling-based' trading! Click on my avatar, change starts with following!

