
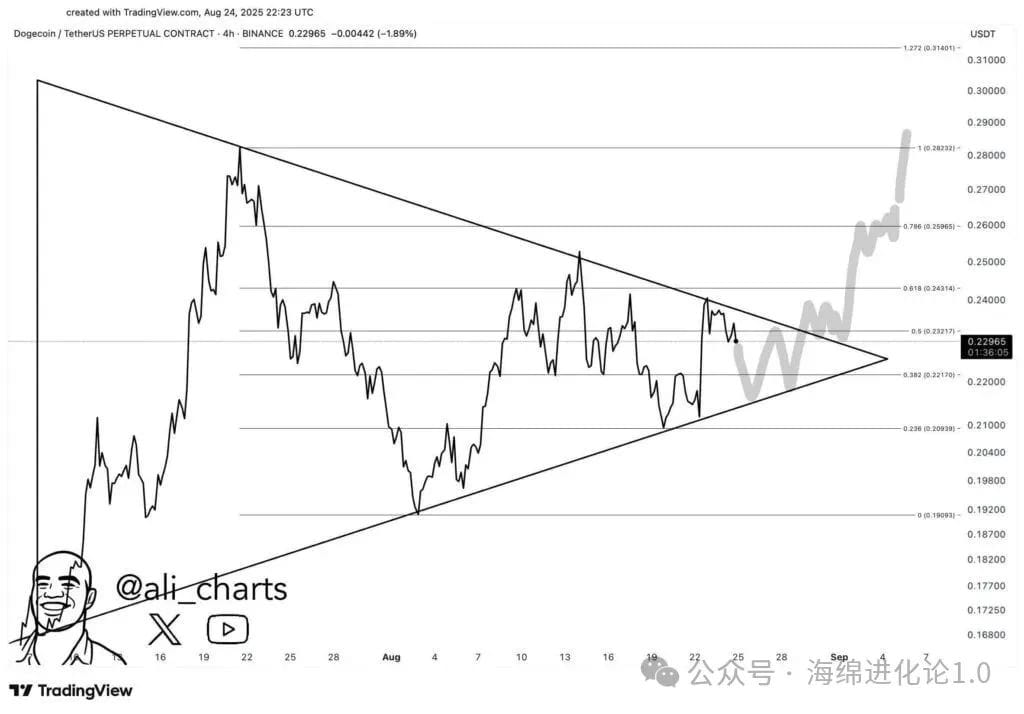
Dogecoin's price is at $0.2296, within a tightening symmetrical triangle; a breakout above $0.243 will indicate bullish momentum, while a drop below $0.2217 may lead to $0.204. Analysts expect a decisive move in early September, at which point trading volume will confirm this trend.

Dogecoin is close to a decisive breakout: currently inside a symmetrical triangle, priced at $0.2296.
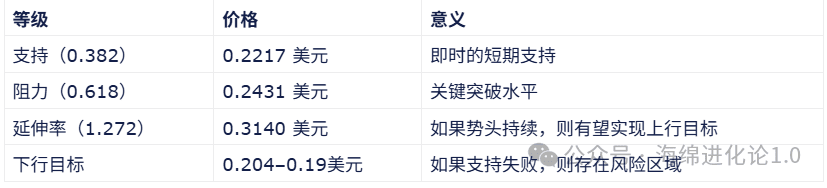
Key resistance at $0.243 (0.618 retracement); support at $0.2217 (0.382 retracement).
Analysts predict: upward targets of $0.243 to $0.314; if it drops below $0.382, the downside risk ranges from $0.204 to $0.19.
Dogecoin is trading at $0.22965 within a tightening triangle, and analysts expect a decisive breakout in early September. Fibonacci levels indicate $0.243 as a key resistance, while a failure at $0.2217 may lead to a drop to $0.204. Analyst Javon Marks notes Dogecoin's long-term structure and predicts that if the cycle repeats, it may retest $0.739.
What is driving the breakout potential for Dogecoin?
Dogecoin's price is consolidating within a symmetrical triangle at $0.2296, with converging trendlines and Fibonacci retracement levels forming a high-probability pattern. The contraction of volume during the compression phase and subsequent surge may determine its trend; analysts expect a decisive move in early September.
How do Fibonacci levels impact Dogecoin's short-term trend?
Fibonacci retracement levels highlight recent decision points: 0.382 at $0.2217 serves as immediate support; 0.5 at $0.2322 is a key resistance level; 0.618 at $0.2431 is a key resistance level. A breakout above $0.2431 with increased volume will confirm sustained bullish momentum; if it drops below $0.2217, the downside probability will increase to $0.204.
What are Dogecoin's price targets and risk levels?
Recent forecast targets first at $0.243-$0.250, then $0.27-$0.28, and may test the 0.786 retracement level at $0.2697 before testing the 1.272 extension near $0.3140. Downside risk: dropping below $0.2217 may push the price up to $0.204 or $0.19.
Summary of Dogecoin targets and support
Why does the long-term outlook suggest accumulation?
Analyst Javon Marks emphasizes the index's multi-year cyclical structure, including a historical accumulation phase (2014-2017) and the peak of $0.73904 in 2021. The current trading range and higher lows along the rising support trendline suggest that the index will enter a long-term accumulation phase, potentially preceding another wave of upward momentum if macro conditions align as expected.
How to monitor the setup?
Pay attention to the trading volume in the breakout direction, watch for the closing price on the daily chart to be above $0.2431 or below $0.2217, and implement layered risk management. Confirming momentum with above-average trading volume can increase the likelihood of sustained increases.
When might Dogecoin break out of the triangle?
Analysts expect a breakout as the triangle tightens, with a decisive move in early September; confirmation requires a closing price significantly above $0.243 (upside) or below $0.2217 (downside), accompanied by trading volume.
How to set stop-loss for this setup?
Using the 0.382 retracement level of $0.2217 as a reference: for long positions, set stop-loss below this level; for short positions, consider setting stop-loss above $0.2431 to limit the risk of false breakouts.
Key Points
Triangle Compression: Dogecoin is at $0.2296 within a symmetrical triangle, indicating an upcoming change.
Key Levels: $0.2217 support level (0.382) and $0.2431 resistance level (0.618) will guide short-term direction.
Risk Management: Monitor trading volume confirmation; set stop-loss near key Fibonacci levels and aim for a target of $0.27 to $0.314.
Conclusion
Dogecoin's price is at a key crossover point within the symmetrical triangle, with Fibonacci retracement levels and historical cyclical structure shaping future trends. Traders should prioritize breakout confirmations with volume and manage risk near $0.2217 and $0.2431.

