Ripple (XRP) had a difficult 2023. However, by the end of 2024, the Ripple price prediction significantly exceeded expectations. This comprehensive XRP price prediction encompasses fundamentals, technical analysis, short-term price levels, and other factors. Its purpose is to assess the likely price path of XRP from 2025 to 2030 and beyond.
KEY POINTS
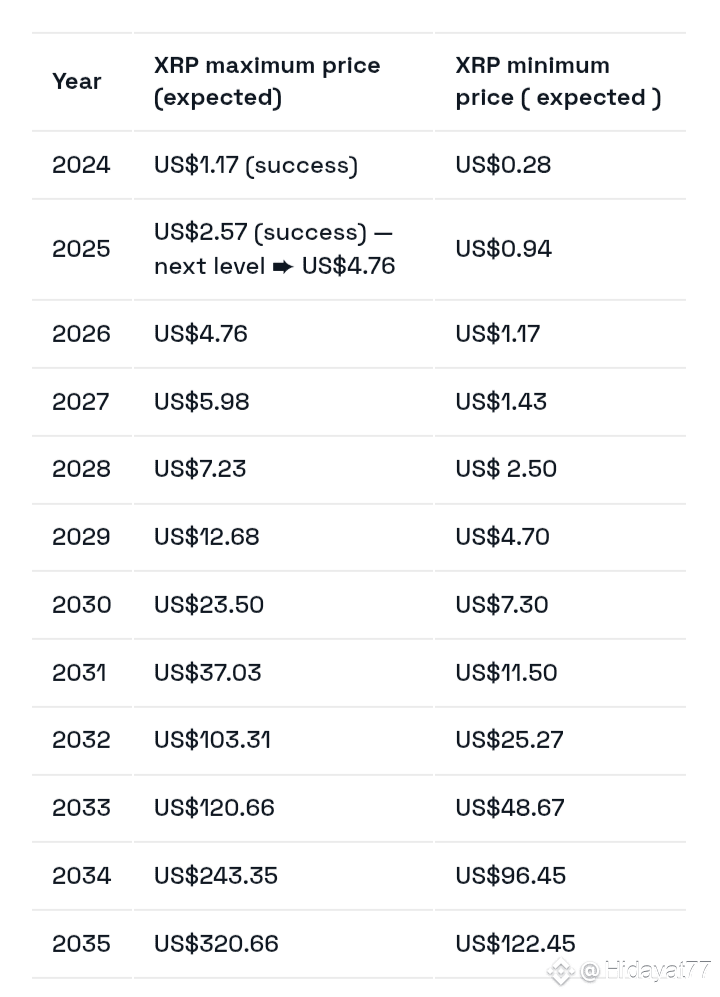
➨ XRP has the potential to reach US$320.66 by 2035, if market conditions align.
➨ While XRP faced a bearish period in early 2024, it broke through a key resistance level in November. This sparked a bullish rally, with increased trading volume, regulatory optimism, and institutional interest.
➨ Despite hurdles such as the SEC appeal and centralization criticism, the XRP price can be boosted by positive sentiment, such as ETF approval, active addresses, and long-term holder confidence—key indicators of continued market support.
Ripple (XRP) price prediction until 2035
Below is a table that captures all possible XRP price prediction levels until 2035.
Note: We will revise each point of this XRP price prediction discussion every year or after each milestone event to recalibrate important levels.
XRP technical analysis
Before we discuss broader price patterns, let's explore XRP's short-term price action, identifying key resistance and support levels as breakout or resistance points.
XRP short-term analysis (November 2024)
XRP broke through two major resistance levels and reached US$0.63 and US$0.64, respectively, on November 11, 2024. This was driven by strong factors such as Trump's re-election and 21Shares filing an S-1 with the SEC, specifically for Core XRP Trust shares.
All of this pushed the XRP price above US$1 rather quickly. Based on key Fibonacci levels , key resistance zones were present at $0.85 and $1.13, both of which were broken by positive market sentiment.
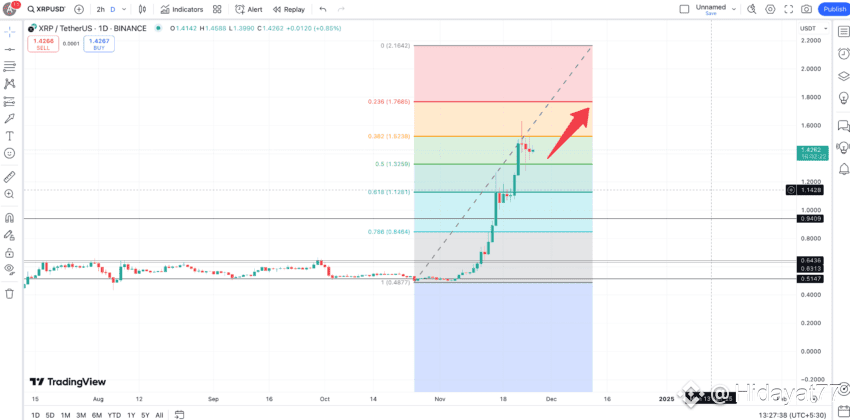
In November 2024, the XRP price was at US$1.42, with the next hurdle at US$1.52. We believed that if it crossed US$1.52 with high volume, it could push the price to US$1.77 and then above US$2. And that's exactly what happened!
XRP short-term analysis (December 2024 post bullish move)
XRP moved past US$2.16 , our short-term interim high predicted using Fibonacci levels, due to overall bullishness . This also changed the interpretation of the current swing high and swing low, prompting us to recalibrate the chart.
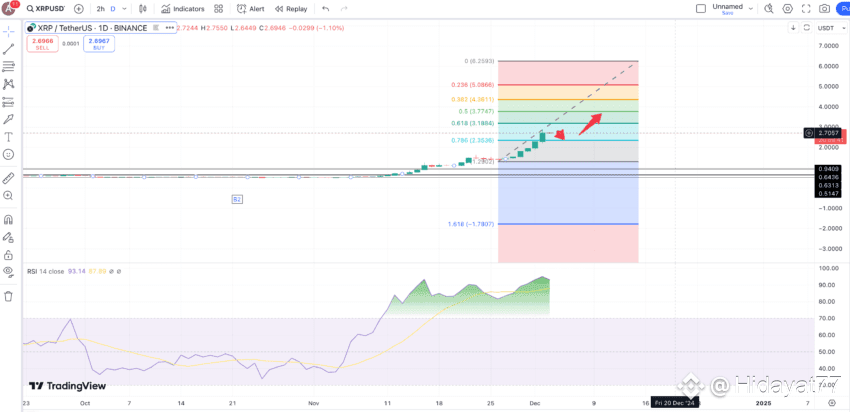
According to the latest analysis, XRP's current price is US$2.68 as of early December 2024. However, the RSI has been in overbought territory for some time now, suggesting a correction or a decline to US$2.36 in the short term. However, new buyers are expected to capitalize on this level to take new positions, which over the next few weeks could take XRP as high as US$3.18 and then US$3.77 in the short term.
But to track the annual movements, let's consider historical patterns.
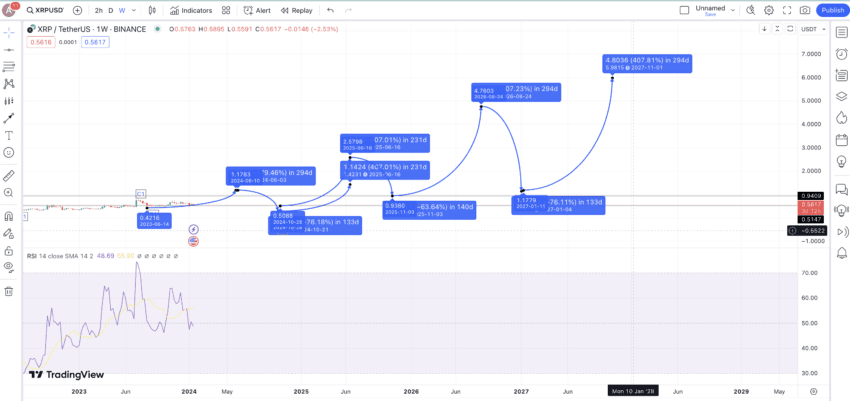
XRP weekly chart analysis
Here's a weekly chart of XRP, using the XRP/USDT pair on Binance. Notice how we've marked the points A to G and G to B1 on the left and right sides of the chart.
At first glance, the chart resembles a crease pattern , with the left side being a rough mirror image of the right. The idea now is to find the distance between each high and low and each low and each high to get an average percentage of the expected value.
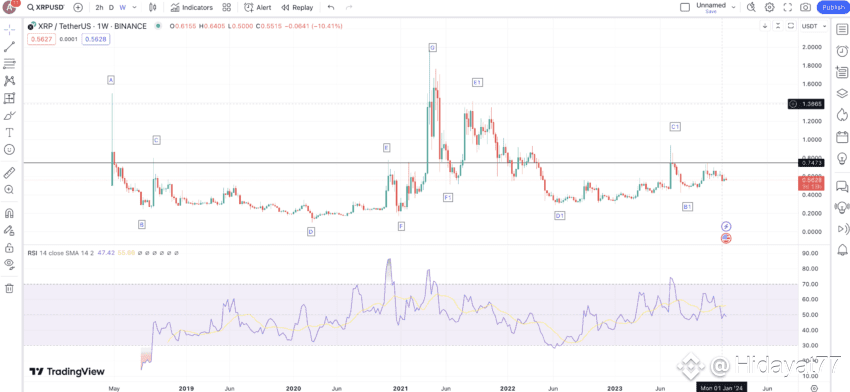
Note: For the sake of simplicity, we have chosen not to consider smaller highs or lows that occur between two important points.
Also, as we go from B1 to A1, we'll take levels from G to F1, F1 to E1, and so on. Therefore, for the left side of the graph, we take levels starting at G and going all the way to A.
Plot and chart calculations
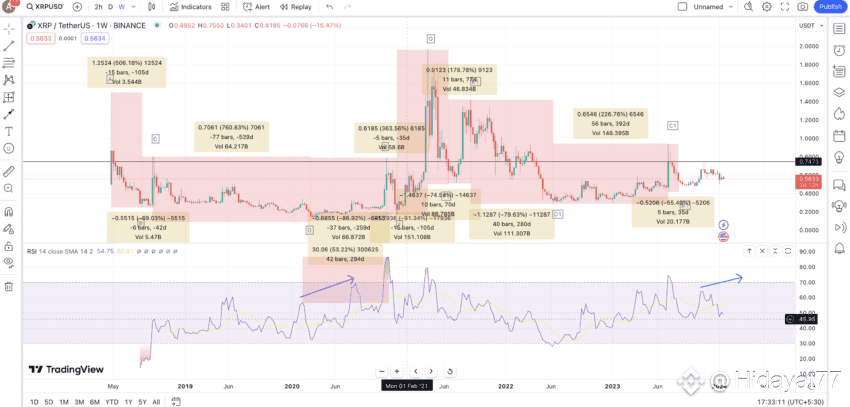
Let's plot the left side of the chart, starting at G and moving towards A. We will take the profit/loss percentage and time frame:
G to F-91.34% in 105 days
F to E363.56% in 35 days
E to D-86.92% in 259 days
D to C760.83% in 539 days
C to B-69.03% in 42 days
B to A506.18 in 105 days
Now let's plot the right side of the graph, starting from G and going down to B1.
G to F1– 74.54% in 70 days
F1 to E1178.78% in 77 days
E1 to D1-79.63% in 280 days
D1 to C1226.76% in 392 days
C1 to B1-55.49% in 35 days
Now let's find the average of all high-to-low and low-to-high (all negative and positive movements to find the next point or A1 on the chart)
Average price increase: 407.22% and 230 days (lowest estimate is 178.78%)
Average price drop: 76.16% and 132 days (highest estimated drop is 91.34%)
Of note, the price spike on the left side of the chart, from E to G, occurred when the RSI made a higher high. Therefore, while we can expect the next high, or A1, to correspond to the average level, a higher high from the RSI would be a good signal. The previous RSI surge took 294 days, which is important to remember.
Ripple (XRP) price prediction 2024 (successful)
XRP has successfully surpassed its predicted price for 2024. Here's how the analysis reads, if you'd like to learn more about our method:
As our calculations led us to an average price increase of 407.22% over 230 days, the target was as high as US$2. However, given the bearish sentiment and the lack of an XRP ETF in sight, the level rose as high as the lowest estimate of 178.78%.
The highest in expectations is between 230 and 294 days (time for the left side RSI spike).
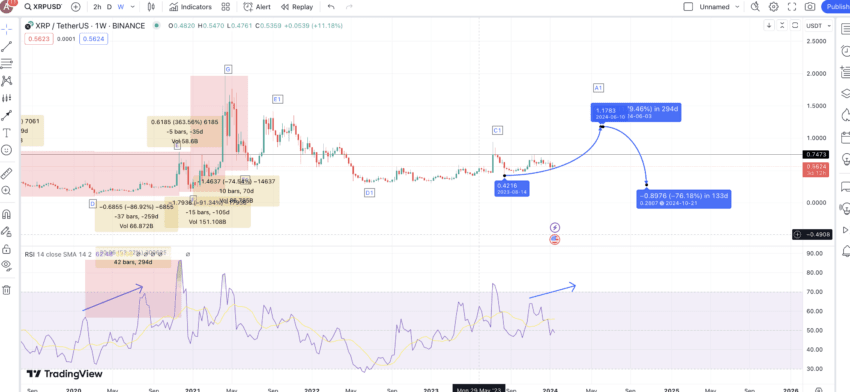
Therefore, a more conservative XRP price prediction for 2024 is US$1.17 , as the lowest projection is 76.16%.
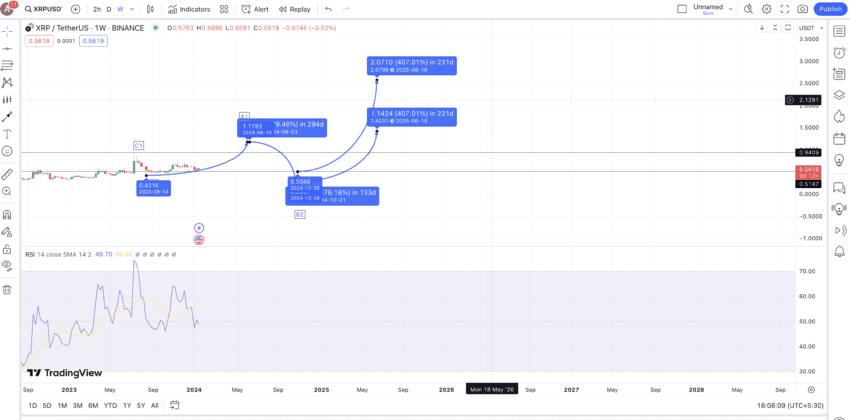
Ripple (XRP) price prediction 2025 (already achieved)
It's important to note that the bull market has pushed XRP past US$2.70, a level already exceeding our 2025 analysis. However, we expect some corrections in the coming months, keeping the 2025 XRP price level on average near US$2.50.
Here is the analysis we will use:
As long as B2, or the XRP price prediction, remains low for 2024, we can extrapolate the next 230-day high by 407.22%. Therefore, the XRP price prediction for 2025 is US$1.42. However, this level is based on the 2024 high of US$1.17, a level that is far from controversial.
Note that this is a conservative estimate, and the final price will depend on the lowest price XRP hits in 2024. If XRP follows the key support level of $0.504, as per short-term analysis, the 2025 high could be $2.57 . This seems highly likely, as only a market crash could bring XRP down, and even then, it seems unlikely to drop below $0.50.
Provided XRP moves into a bull market phase in 2025, the 2025 low could be $1.17, one of the previous highs of 2024, or $0.94, the previous high that occurred in 2023.
But then, if XRP follows the same trajectory, we can even expect the 2026 high of US$4.76 to appear in 2025. In that case, the expected ROI could be close to 230%.
Ripple (XRP) price prediction 2026
Assuming XRP reaches a low of US$0.94 in 2025, the next high in 2026 could be US$4.76, considering the 407.22% level. Furthermore, based on the average price decline of 76.16%, the 2026 low is expected to be US$1.13 to US$1.17. This figure is the highest expected for 2024.
From that low, the next high in 2027 could emerge at US$5.98.
Projected ROI from current levels: 235%
Ripple (XRP) price prediction 2027
2027 marks an exciting period for XRP, building on the momentum established in previous years. Assuming the 2026 low remains around US$1.17 , the potential high for 2027 could reach US$5.98 , based on an average price increase of 407.22%.
This growth aligns with a possible bull market cycle due to institutional adoption, improved global regulations, and Ripple's advancements in payment solutions.
Projected ROI from current levels: 321%
Ripple (XRP) price prediction 2028
In 2028, Ripple could see steady growth, building on its 2027 high of US$5.98 . The projected high for 2028 is US$7.23 , supported by a 76.16% average price decline from the previous high, which serves as a consolidation marker.
The low for 2028 could settle at US$2.50 , reflecting investor confidence in Ripple's long-term prospects.
Projected ROI from current levels: 410%
Ripple (XRP) price prediction 2029
2029 could be a breakthrough year for XRP, with a projected maximum price of $12.68 . This year, Ripple may achieve significant milestones, such as integrating CBDC projects and strengthening its role as a liquidity solution for banks and exchanges.
The minimum price for 2029 could rise to $4.70 , reflecting continued market support and accumulation by long-term holders.
Projected ROI from current levels: 792%
Ripple (XRP) price prediction 2030
Outlook: Bullish
Now, if we use the 2026 low and 2027 high as the swing high and low or even use the 2029 data point, the predicted price level of XRP in 2030 could appear at US$23.50.
However, that would be a generous estimate, considering XRP also continues to grow fundamentally.
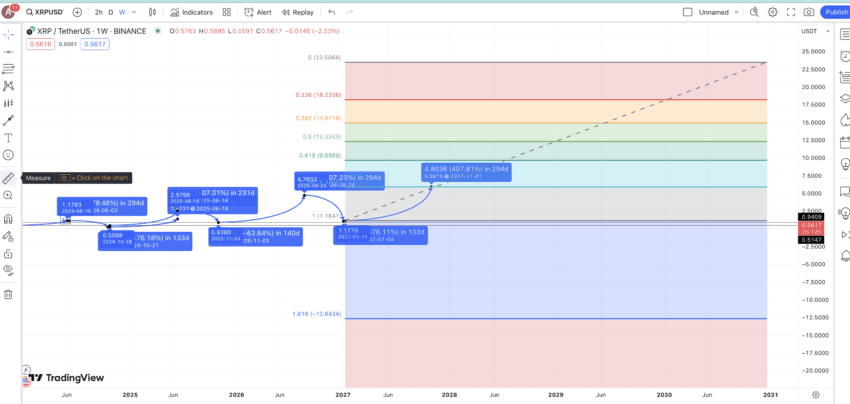
Projected ROI from current levels: 1554%