A significant bill, substantial market captures, and locally tied product launches have led to an undeniable reality: The supply of stablecoins has doubled in less than two years.
Since January 2024, the circulating supply has jumped from $130 billion to $270 billion. In fact, the top four issuers now control up to 96% of the market. Tether (USDT) continues to serve as the liquidity pillar, while Circle (USDC), Ethena (ENA), and Sky (SKY) hold the remainder.
However, the narrative is currently shifting: Layer 1s (L1s) are racing to attract this stablecoin flow. Is this the driving factor behind the recent price differences among L1s?
The stablecoin boom is stimulating competition among L1s.
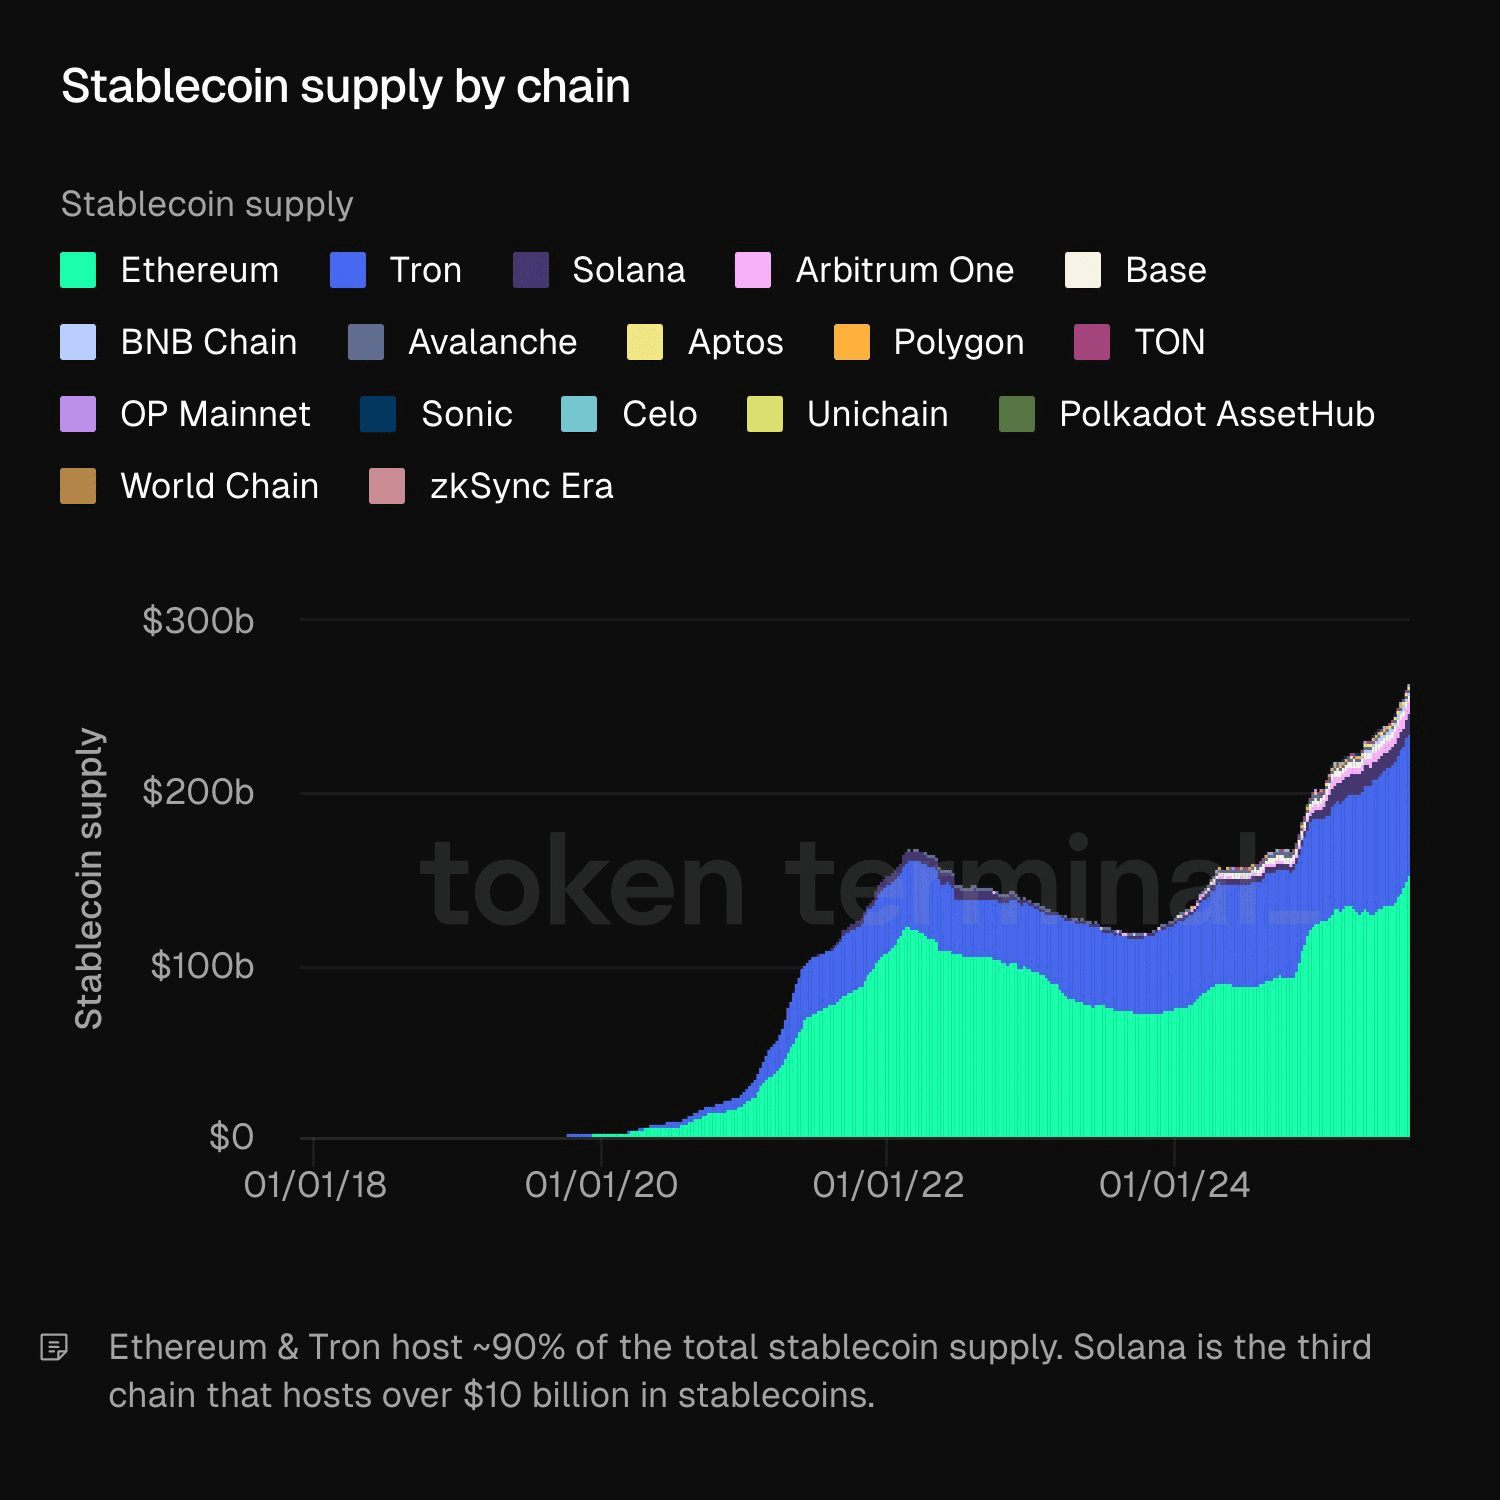
The supply of stablecoins has surged on blockchains since 2018, creating a distinct separation in the dominance of L1s.
Notably, Ethereum (ETH) and Tron (TRX) lead this field, controlling together 90% of the total supply, while Solana (SOL) has surpassed the $10 billion threshold, dominating third place in stablecoin adoption.
Meanwhile, smaller chains and Layer-2s like BNB Chain, Avalanche, Arbitrum One, Base, and zkSync Era are steadily growing, gradually attracting increasing stablecoin flows.
In summary, the L1s are fiercely competing to attract stablecoin capital. The logic is very simple: The widening gap between L1 stablecoins is shaping how money flows and, ultimately, affecting price discovery.
A higher market share means more liquidity will remain on the network, boosting DeFi activity, staking cash flow, and trading demand, potentially driving prices higher as buying pressure increases.
According to Bitcoin Magazine, analyzing the price differences between chains will provide a clear confirmation for this hypothesis.
Tracking capital flows and their impact on prices.
The dominance of stablecoins is clearly aligning with technical factors.
Tron, for example, has absorbed nearly $20 billion in stablecoins this year, pushing the total supply to a record $82 billion. The impact? TRX has risen nearly 80% to $0.36, marking nine consecutive weeks of growth.
In contrast, Solana has added about $8 billion in stablecoins to its network, but the price has still dropped 2% from the year's opening level of $213.
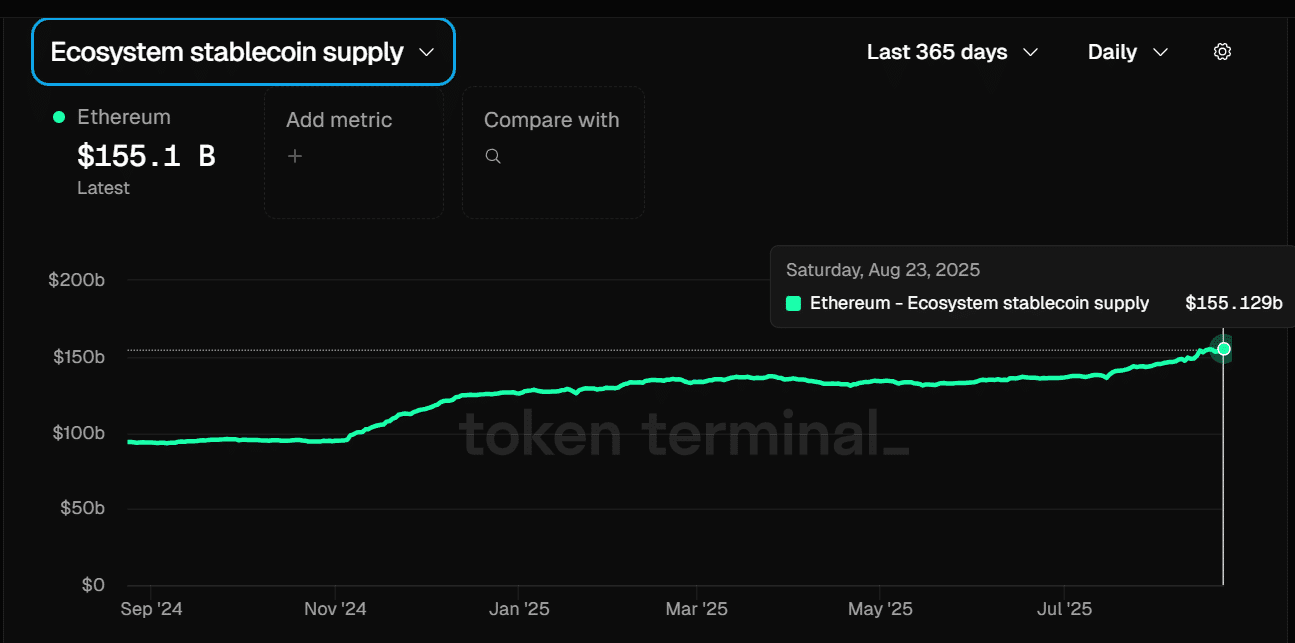
Ethereum, meanwhile, is showing a clear superiority over the rest.
As the chart shows, the network has absorbed nearly $30 billion in stablecoins. Interestingly, nearly 90% of this capital flow has occurred since May, coinciding with ETH's growth of over 150% from $1,800 in Q2.
In summary, this disparity shows that the flow of stablecoin capital translates into price action unevenly. With 90% of the supply concentrated in two networks, the dominant L1s in liquidity are clearly leading the largest price fluctuations.