🚀 Chainlink skyrocketed 38% in August! How far can this rebound go?
Chainlink (#LINK ) has been on fire recently 🔥, soaring 38.6% in August. Even with fluctuations in Bitcoin (#BTC ), LINK bulls remain steadfast! As NVTS (Network Value to Transaction Volume Signal) returns to the levels of November 2024, new addresses and active addresses are continuously increasing 📈, and market sentiment is clearly bullish. So what are the secrets behind this surge? Let's dig deeper.
🌊 On-chain heat continues to accumulate
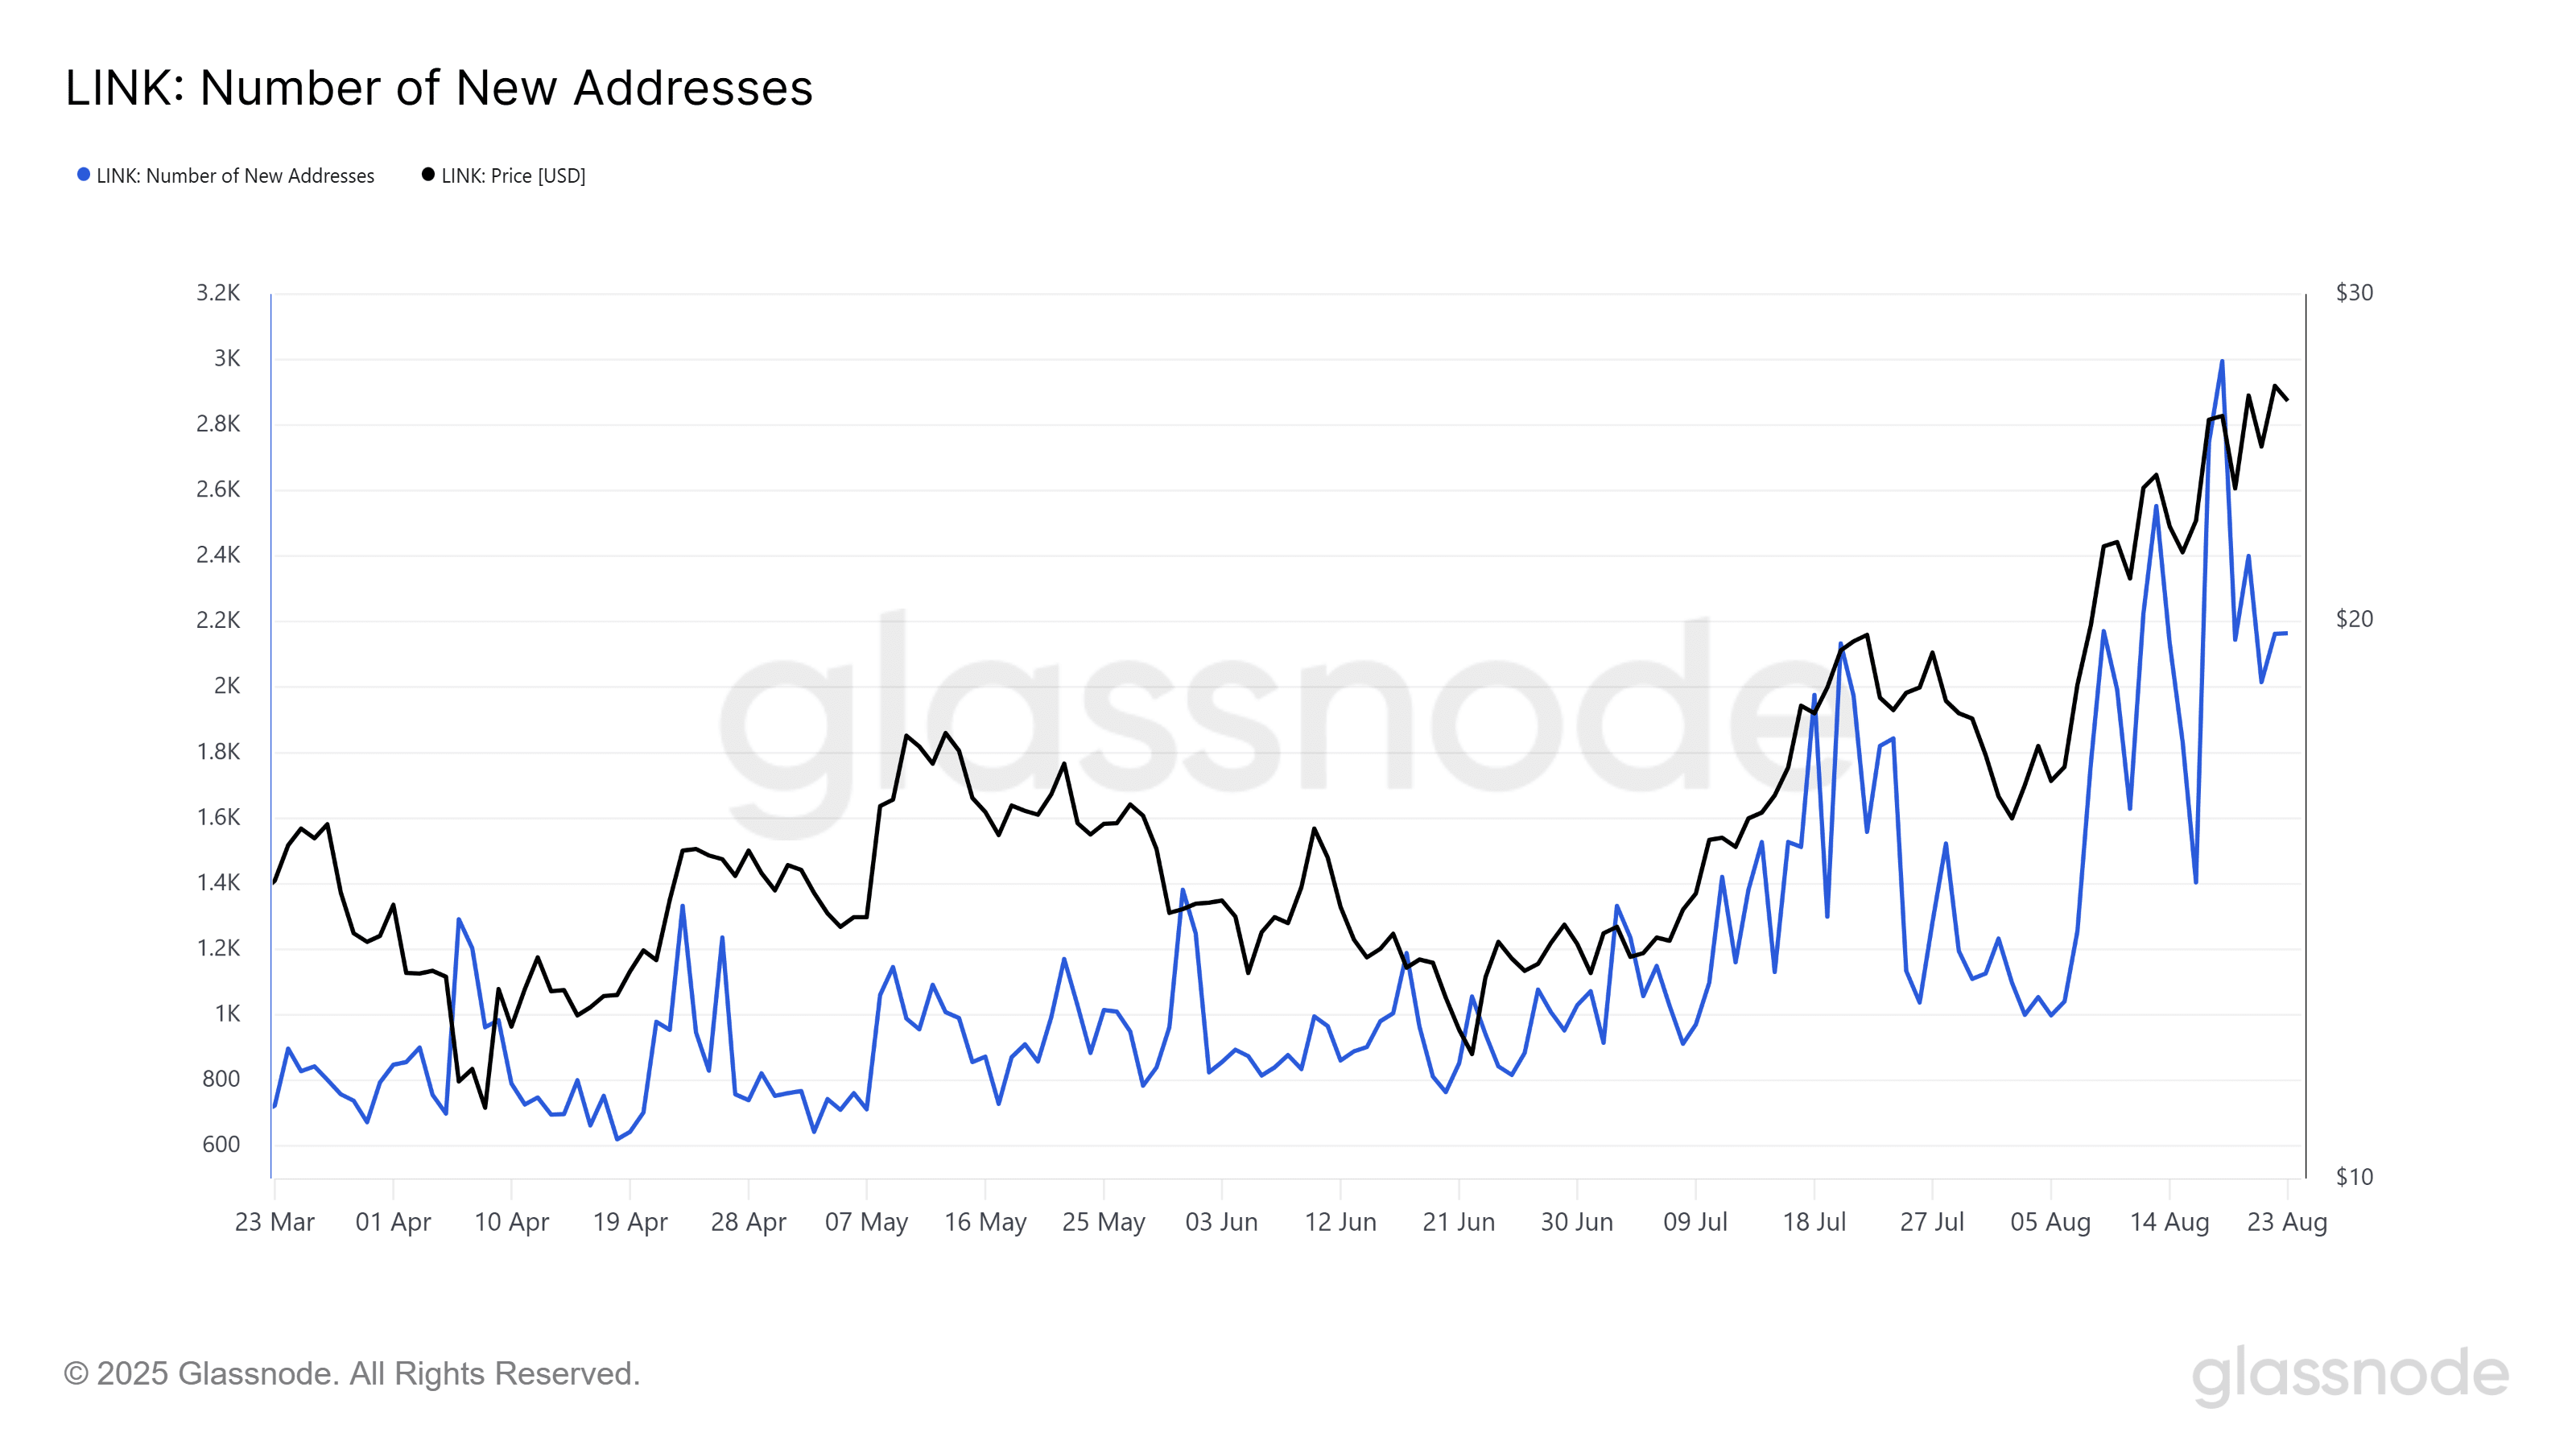
First, from the perspective of on-chain activity, Chainlink is indeed very lively. AMBCrypto used Glassnode data to find that since June, the number of new addresses has steadily increased, reaching 2,163 new addresses as of the time of writing, comparable to the levels of November 2024 💡.
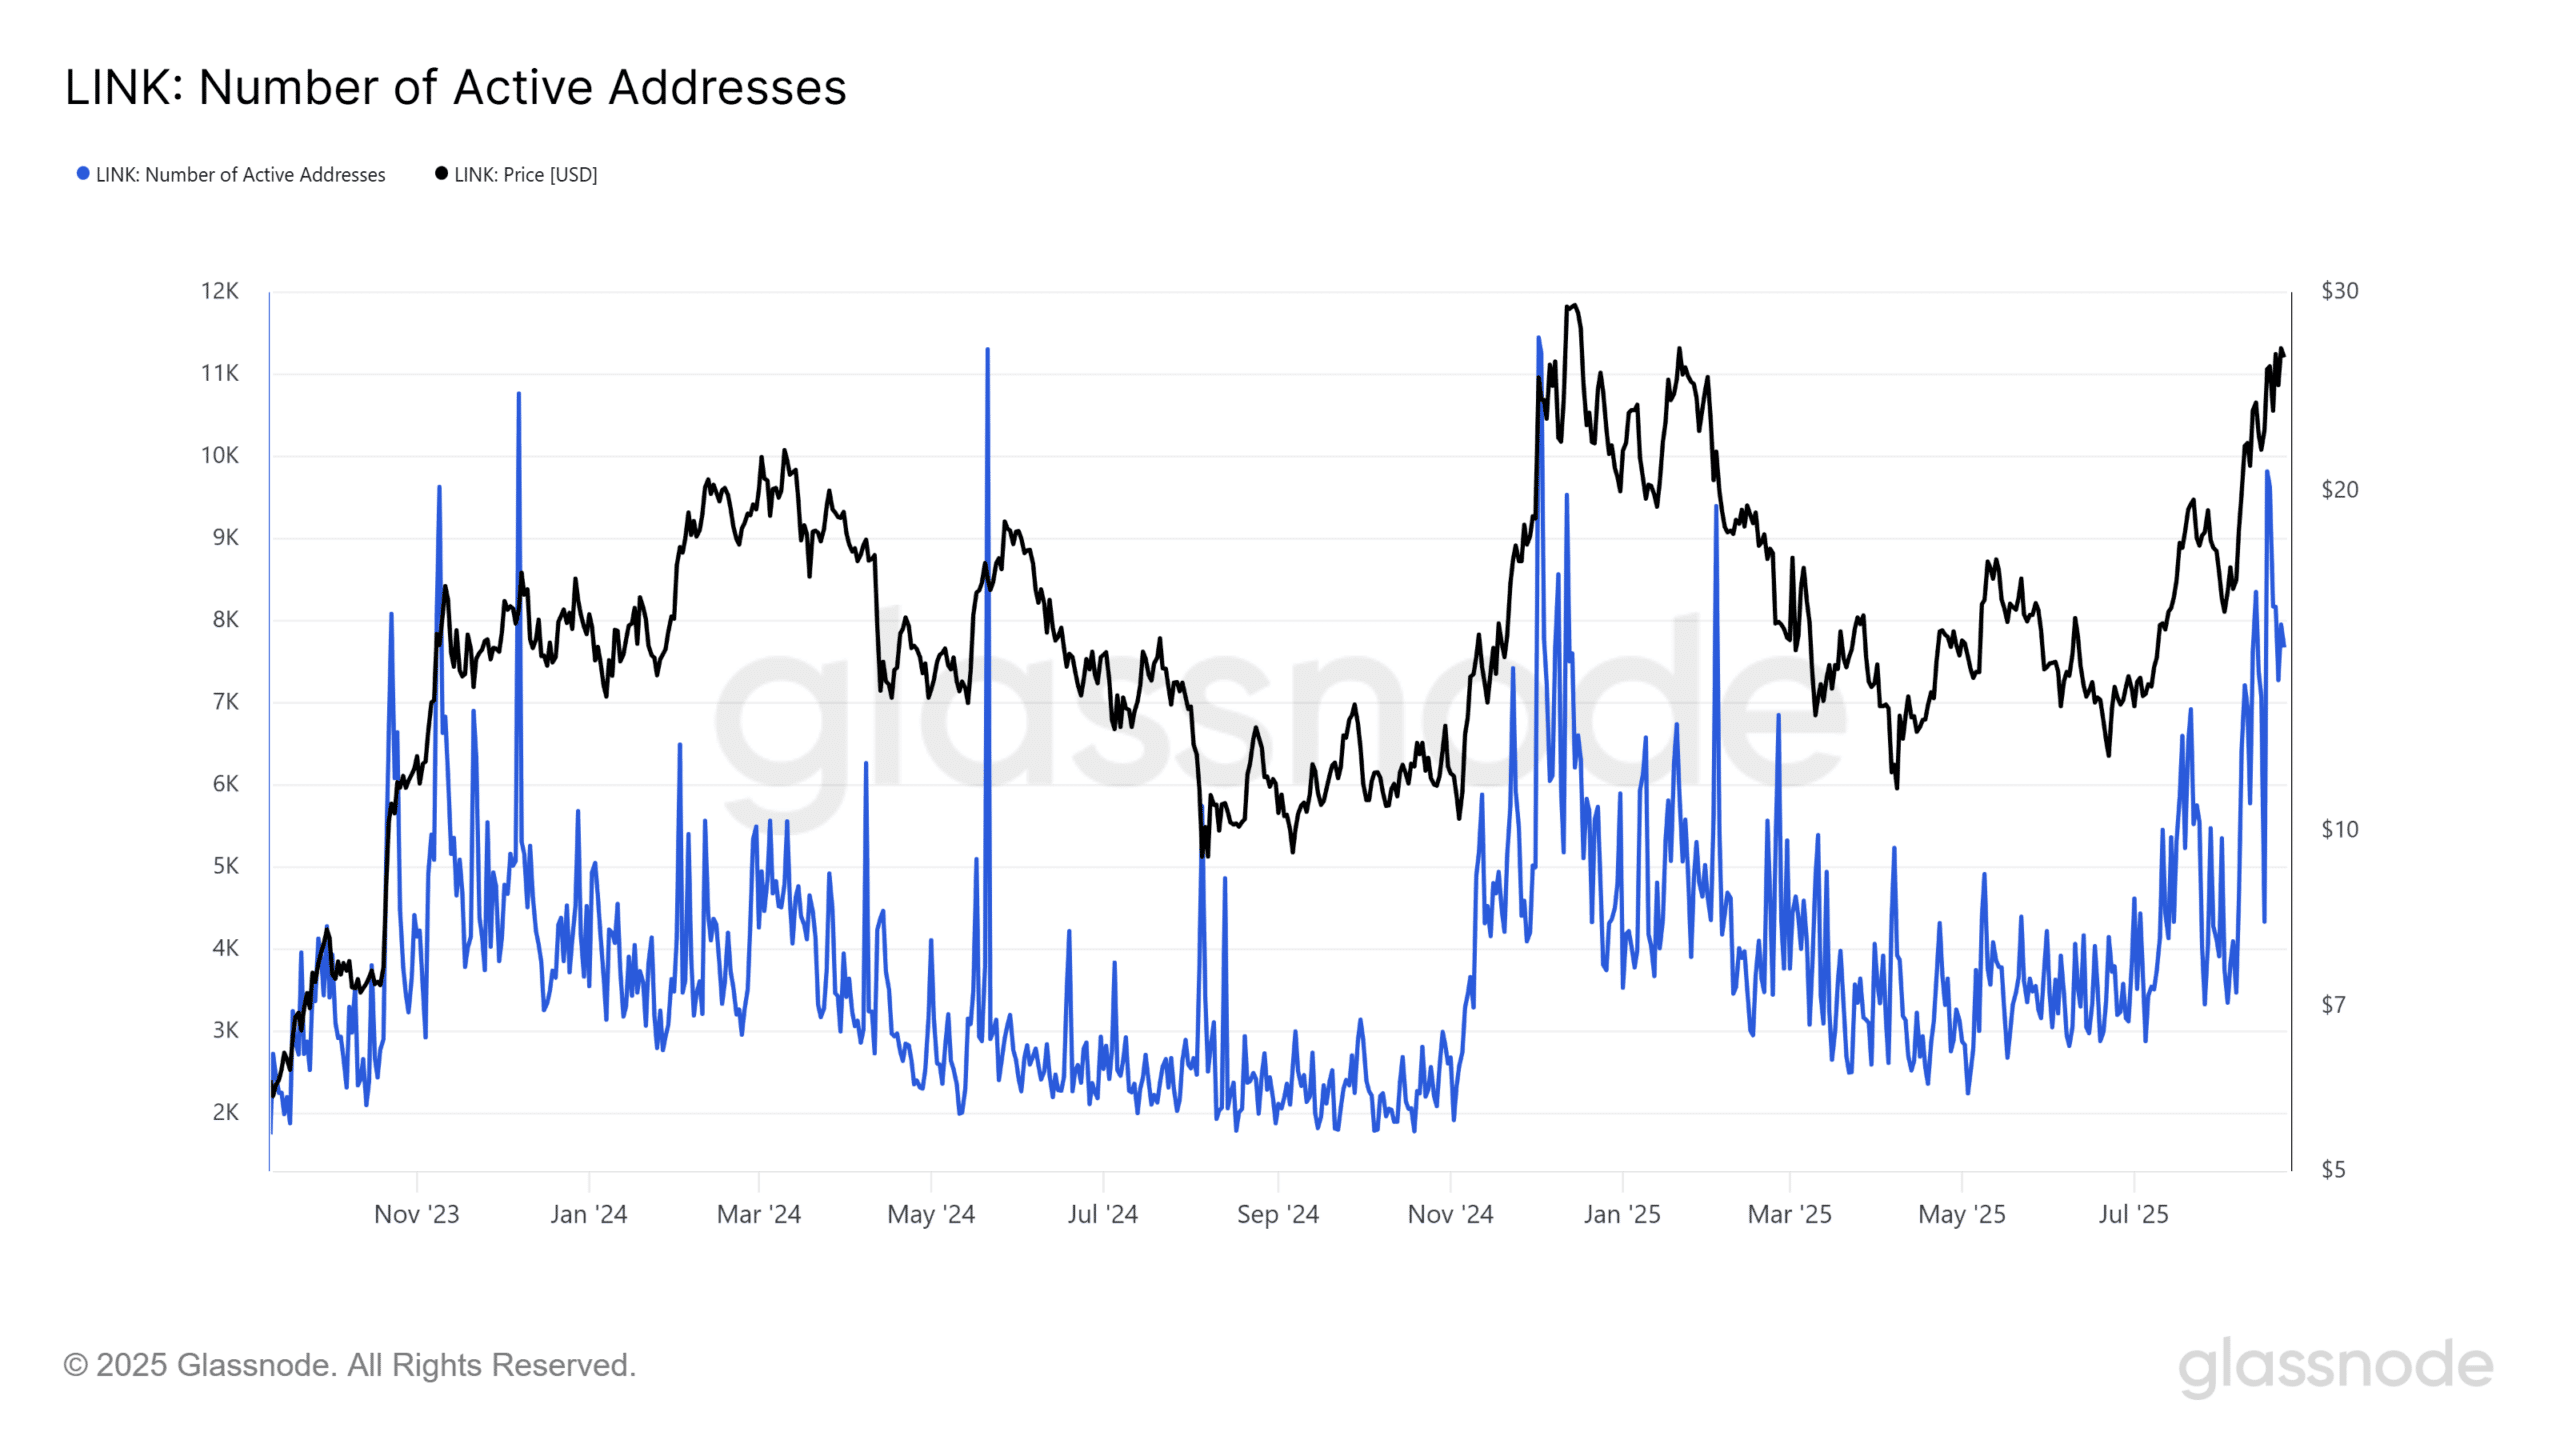
Not only are new addresses increasing, but active addresses are also on the rise, nearing the active levels of November 2021. What does this mean? Simply put, more and more people are operating on-chain, increasing capital inflow and trading activity—this is a very encouraging signal for long-term investors and potential buyers 💎.
Of course, some might wonder, 'Hey, with such high popularity, is the risk also high?' ⚠️
Indeed, excessive on-chain heat may also indicate that short-term sentiment is being overly inflated, but if historical data repeats, Chainlink's rebound potential could still be large. In other words, this is not a guarantee, but it provides a possibility for investors to consider.
💥 Price chart and support level analysis
From a technical perspective, Chainlink's 4-hour and weekly charts both show positive signals 📊:
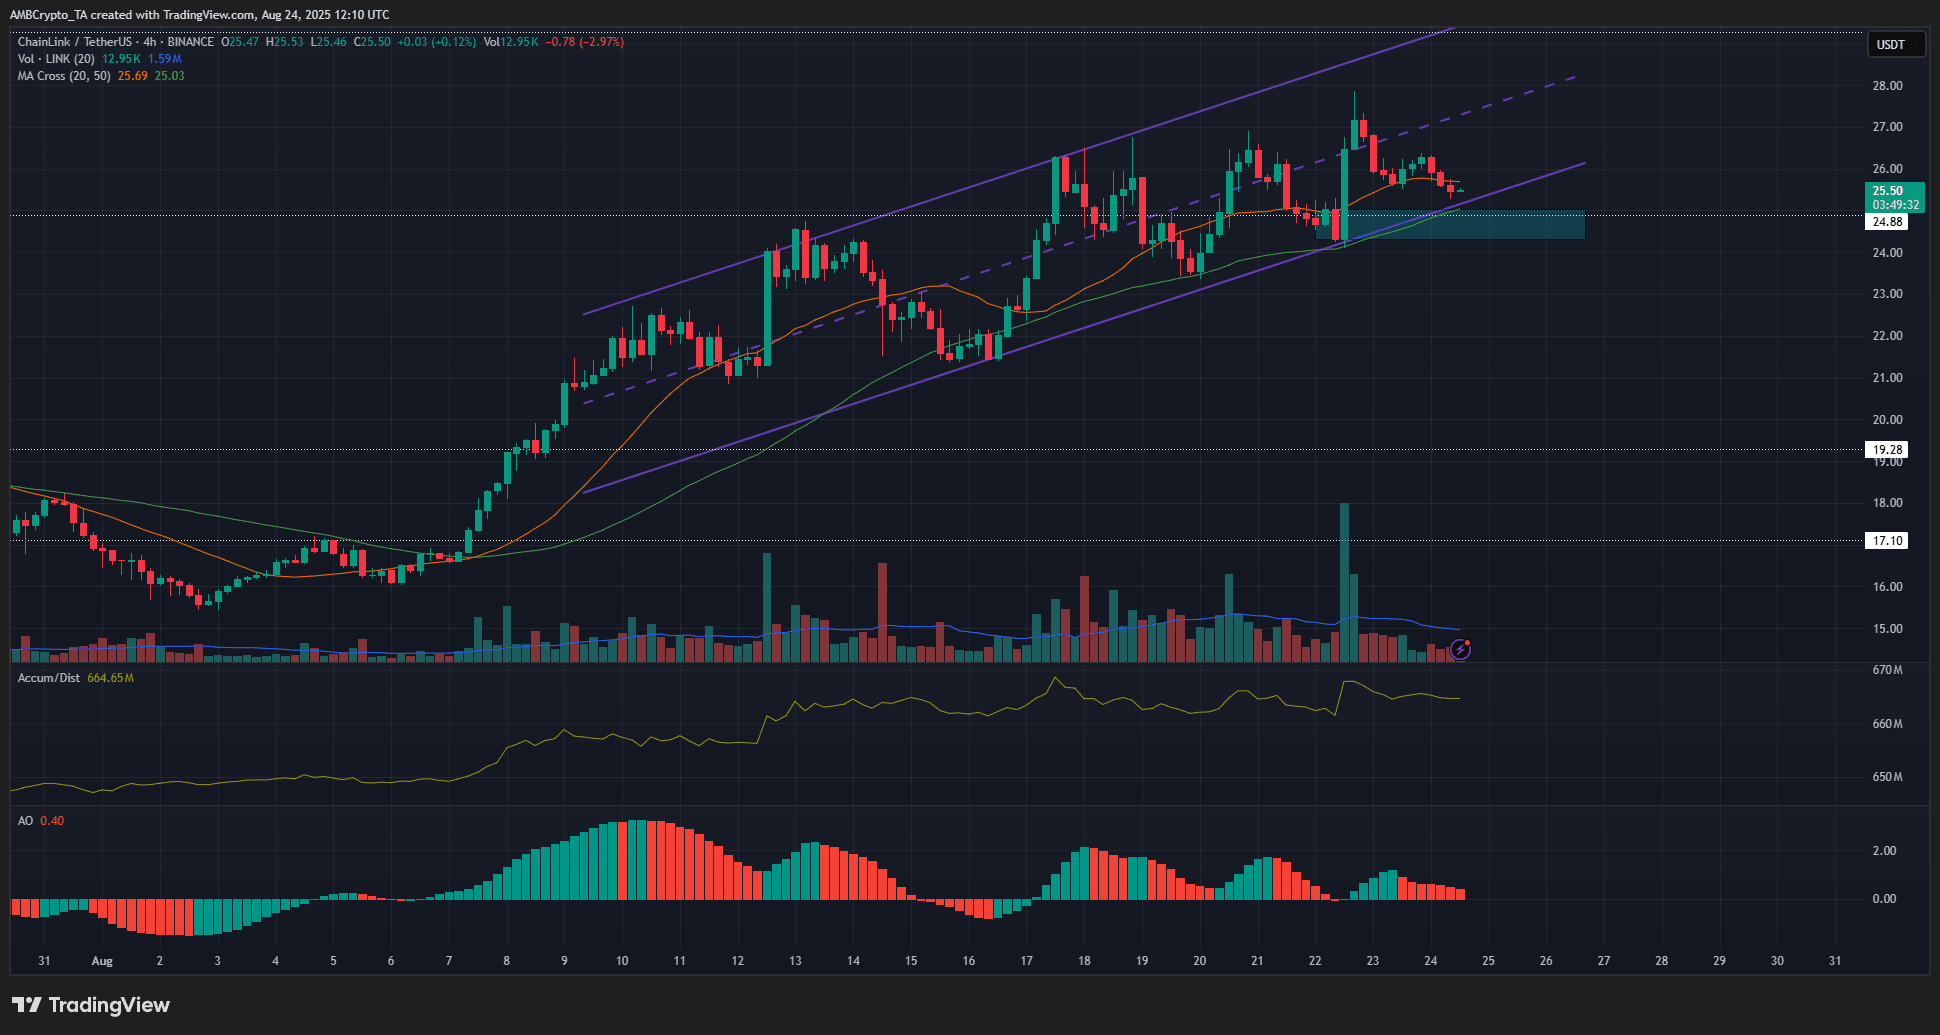
Key support level: $24.3–$25
Next resistance level: $29.26
Currently, LINK has broken through the previous resistance level of $24.88, and prices are operating within an upward channel (purple channel). If it can hold the demand area of $24.3–$25, bulls are expected to push the price towards the channel high 🔥.
In terms of technical indicators, moving averages, momentum oscillators, and A/D indicators are all supporting buyers, indicating that the current trend is bullish. If history repeats itself, LINK rose from $10.56 to $29.26 in November 2024, which gives us more confidence—the potential for future growth should not be underestimated 💪.
💡 Does the NVTS indicator suggest undervaluation?
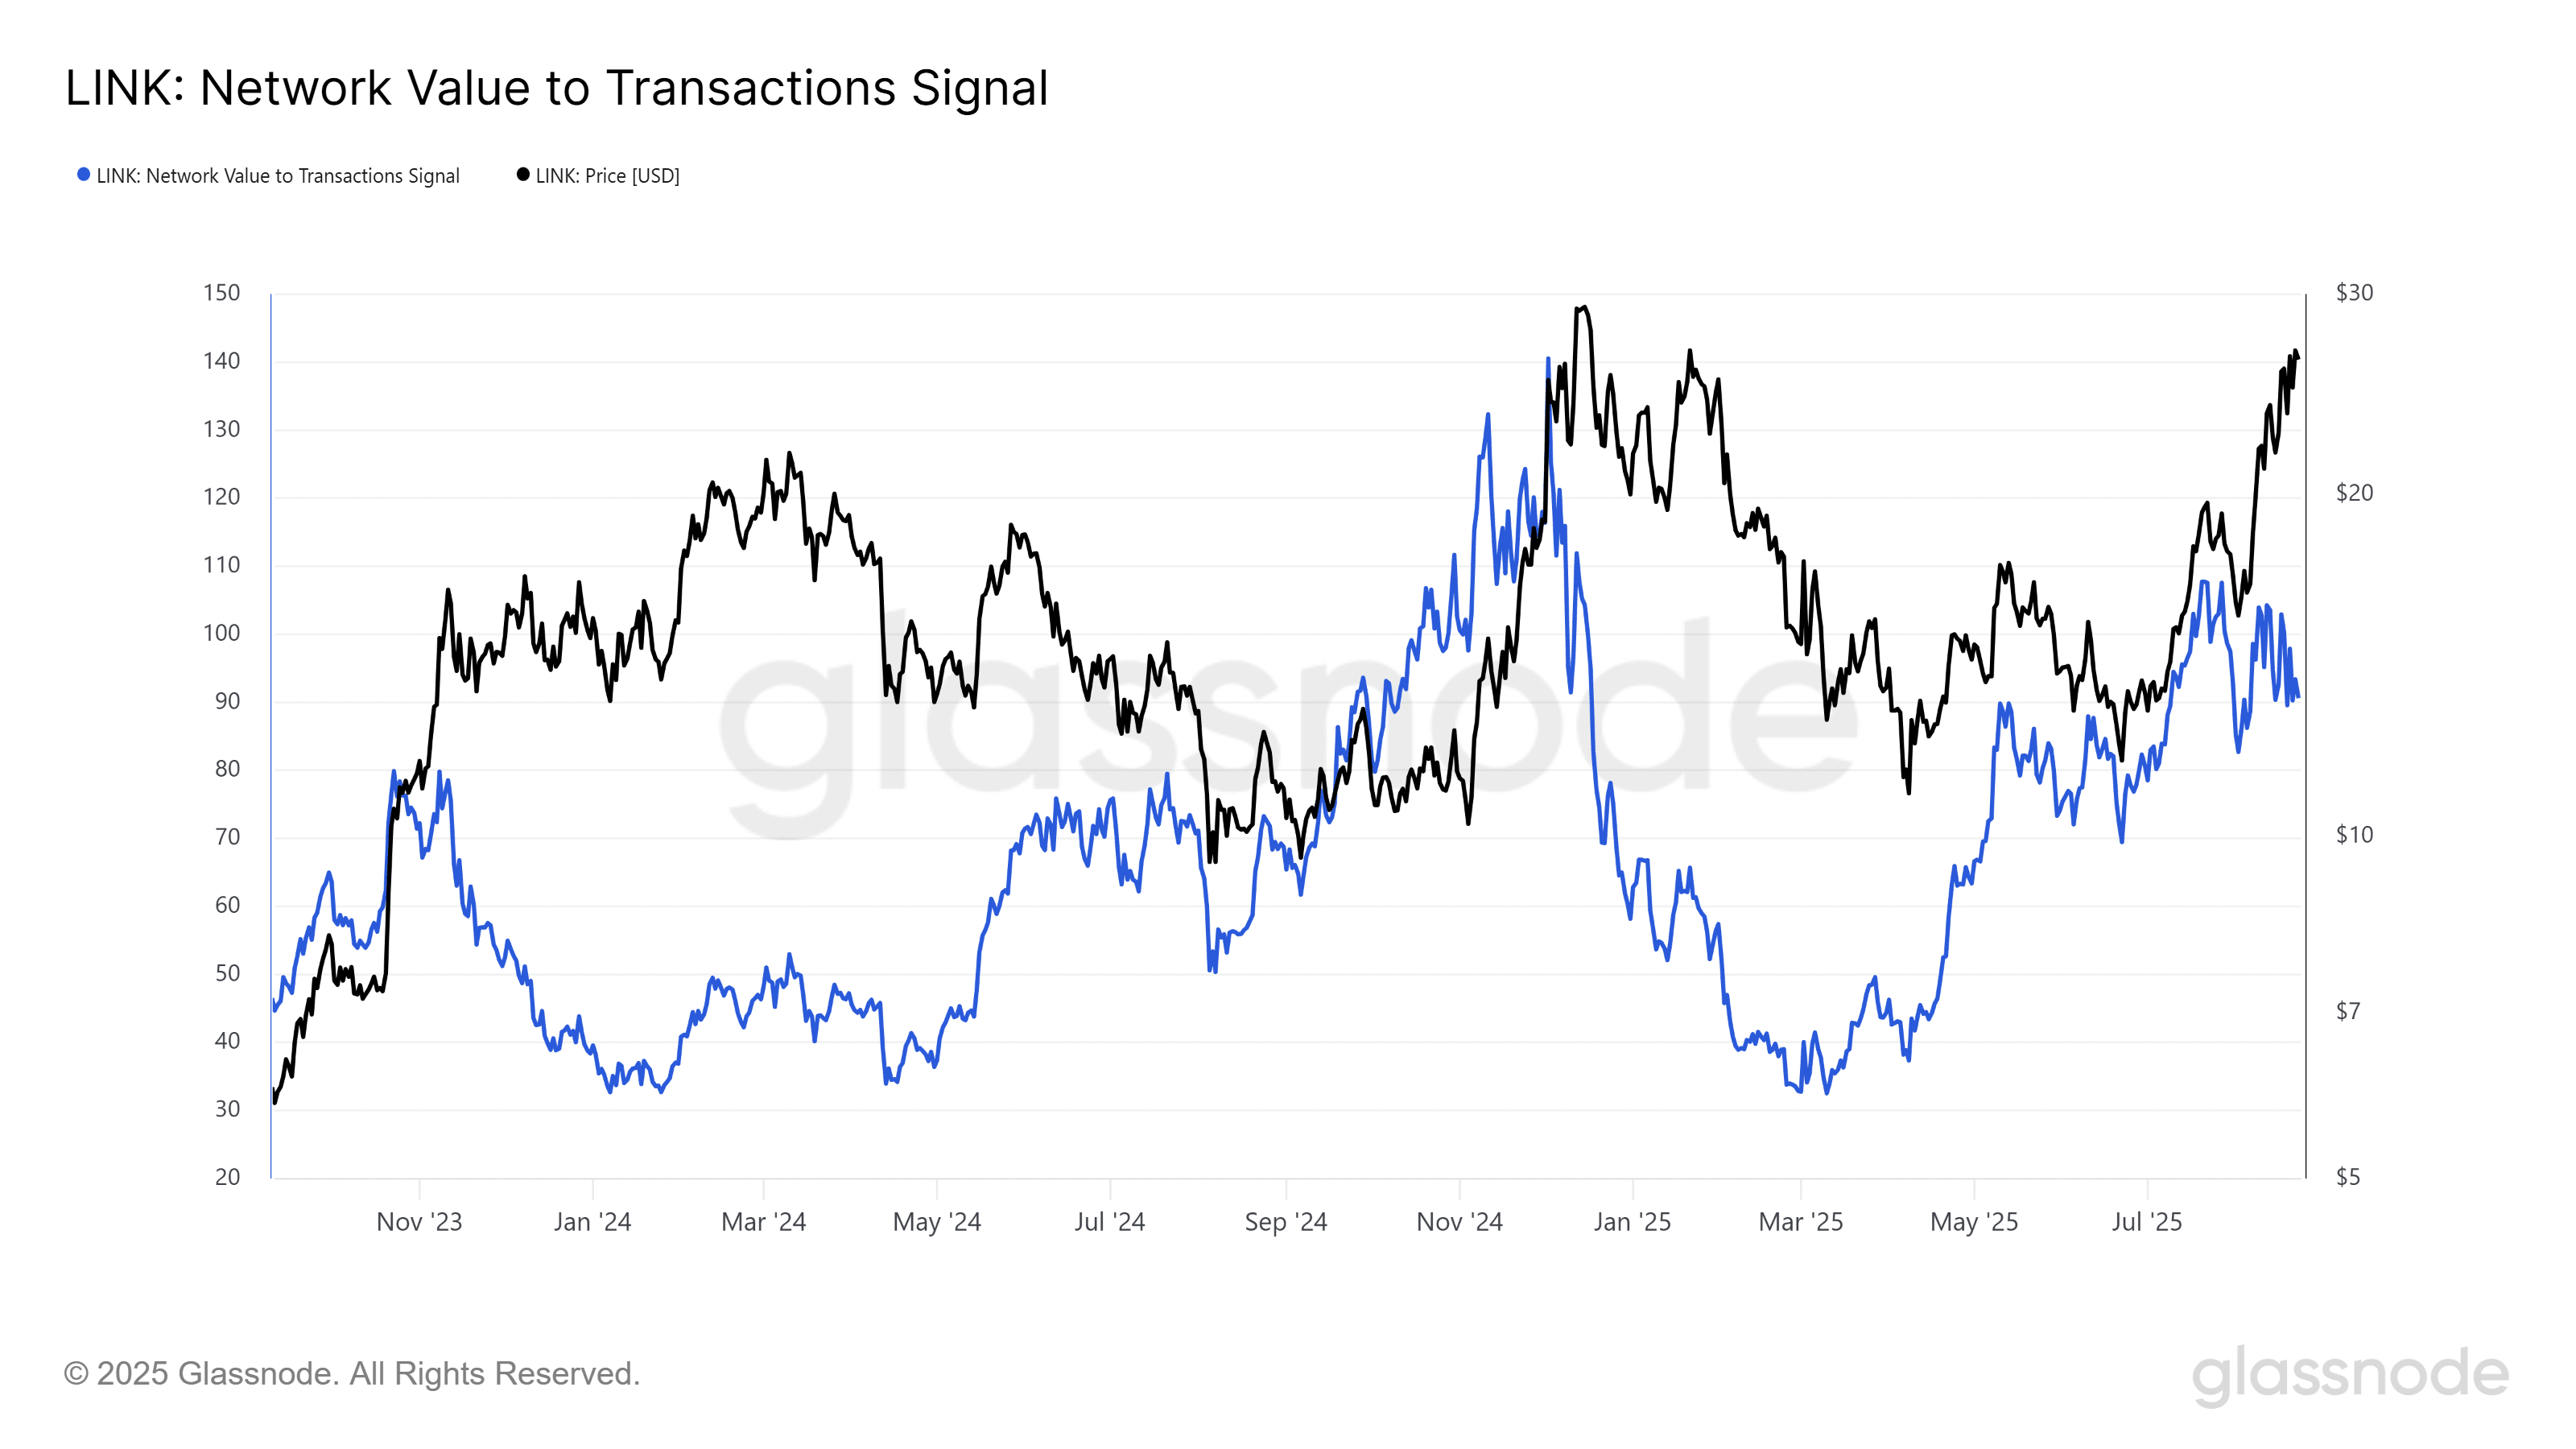
Now let's look at NVTS (Network Value to Transaction Volume Signal). Simply put, it compares the market capitalization of an asset with its daily trading volume, helping you determine whether the price is undervalued relative to its value.
The lower the NVTS → the more likely it is to be undervalued
The higher the NVTS → the more likely it is to be overvalued
Currently, LINK's NVTS has returned to the levels of early November 2024, which was the starting point for the surge from $10.56 to $29.26. This indicates that, according to historical experience, this rebound indeed has a precedent—there may still be room for capital to enter the market 💸.
🔍 Bullish confidence and market sentiment
In addition to on-chain indicators and technical charts, market sentiment is also a factor that cannot be ignored. In the past 30 days, LINK has risen by 38.6%, and the bulls have performed relatively stably, indicating that investors remain confident about the future.
In addition, further rises in Bitcoin and Ethereum may also bring more capital inflow to LINK 🌊. During market uptrends, capital often flows into quality altcoins, and as the leader in DeFi and smart contracts, Chainlink naturally becomes a focal point for capital allocation.
In other words, if BTC/ETH continues to strengthen, the upward momentum for LINK could be further amplified ⚡.
🚀 Why is Chainlink still worth watching?
On-chain activity continues to increase
Both new addresses and active addresses are on the rise, indicating that user participation and capital inflow are increasing simultaneously, keeping the market heat intact 🔥.Strong technical support
Once the $24.3–$25 area stabilizes, bulls are expected to challenge $29.26 again, or even break historical highs.Historical patterns can be referenced
In November 2024, LINK rose from $10.56 to $29.26, and the NVTS returned to the same level, providing psychological reference for investors 💡.Market trends drive
The rise of Bitcoin and Ethereum may lead to capital flowing into LINK, creating a 'follow the trend' effect 📈.Strong bullish indicators
Moving averages, momentum oscillators, and A/D indicators all show that buyers are dominant, indicating that the market is currently leaning towards bullish 💪.
Overall, whether it's on-chain indicators or technical charts, we are receiving signals that 'bulls still have opportunities.' But remember, investing carries risks, and caution is required when entering the market ⚠️.
💬 Summary
Chainlink's performance in August was quite impressive 📊, rising by 38%, with continuous increases in on-chain activity and solid technical support, and historical data also indicates potential rebound space. In the coming days, if the $24.3–$25 support area holds, bulls are likely to challenge $29.26, or even higher.
At the same time, the performance of BTC/ETH may also provide additional support for LINK 🌊. For investors, this market trend is full of opportunities but also hides risks: on-chain heat is high, capital inflow is fast, but price fluctuations still exist.
In summary: Chainlink remains popular, bullish forces are gathering 📈, and the short-term potential for price increases is enormous, but prudent investment and risk control are equally crucial 💡.


