

$HUMA /USDT trading snapshot (intraday performHuma Finance is a crypto in the CRYPTO market.
The price is 0.02627057 USD currently with a change of -0.00 USD (-0.05%) from the previous close.
The intraday high is 0.02817485 USD and the intraday low is 0.02621122 USD.
24-Hour HUMA/USDT Trading Analysis
Huma Finance (HUMA) has seen a modest decline in the past day—down by roughly 5%—reflecting the ongoing bearish tone affecting altcoins broadly. The token continues to trade within a constrained range, showing both caution and consolidation.
Price Movement & Technical Landscape
Current range: Across exchanges like MEXC, HUMA fluctuated between $0.02614 and $0.02826, settling near the lower end of that range. (MEXC, CoinMarketCap)
Support level: Around $0.0323, defended by buyers; a break below may open downside toward $0.0315. (Binance)
Resistance zone: Between $0.0340–$0.0345. A breakout above this could spark a short-lived rally. (Binance)
MACD: Flat, signaling indecision.
Volume: Low—neither bulls nor bears are strongly in charge yet. (Binance)
Market Context & Broader Trends
Bearish momentum: HUMA is trading below key moving averages (7-day SMA at ~$0.0313 and 30-day SMA at ~$0.0344), underscoring persistent downward pressure.
Oversold conditions: RSI-7 sits around 23.9, indicating oversold territory—but MACD still suggests negative momentum.
Liquidity drop: 24-hour trading volume shrank by ~40% to around $37M, highlighting weakening liquidity that can amplify price swings.
Altcoin headwinds: Bitcoin dominance remains high (~57.4%), pulling investor attention and capital away from mid-cap altcoins like HUMA. (CoinMarketCap)
On-Chain News & Fundamentals
Real-world utility growing: On August 15, HUMA launched same-day settlement services for Asian e-commerce merchants via partnerships with Arf, Geoswift, and PolyFlow, enhancing its PayFi infrastructure narrative. (CoinMarketCap, CoinGecko)
Volatility event: A notable price anomaly occurred on August 15, where HUMA reportedly plunged 1,324.67% in 24 hours—likely a reporting glitch or misprint—but it underscores how high volatility draws attention.
Token supply dynamics: Only 2.5% is currently in circulation; future token unlocks raise the risk of additional selling pressure. The project is backed by institutional firms like ParaFi Capital, Circle, and others.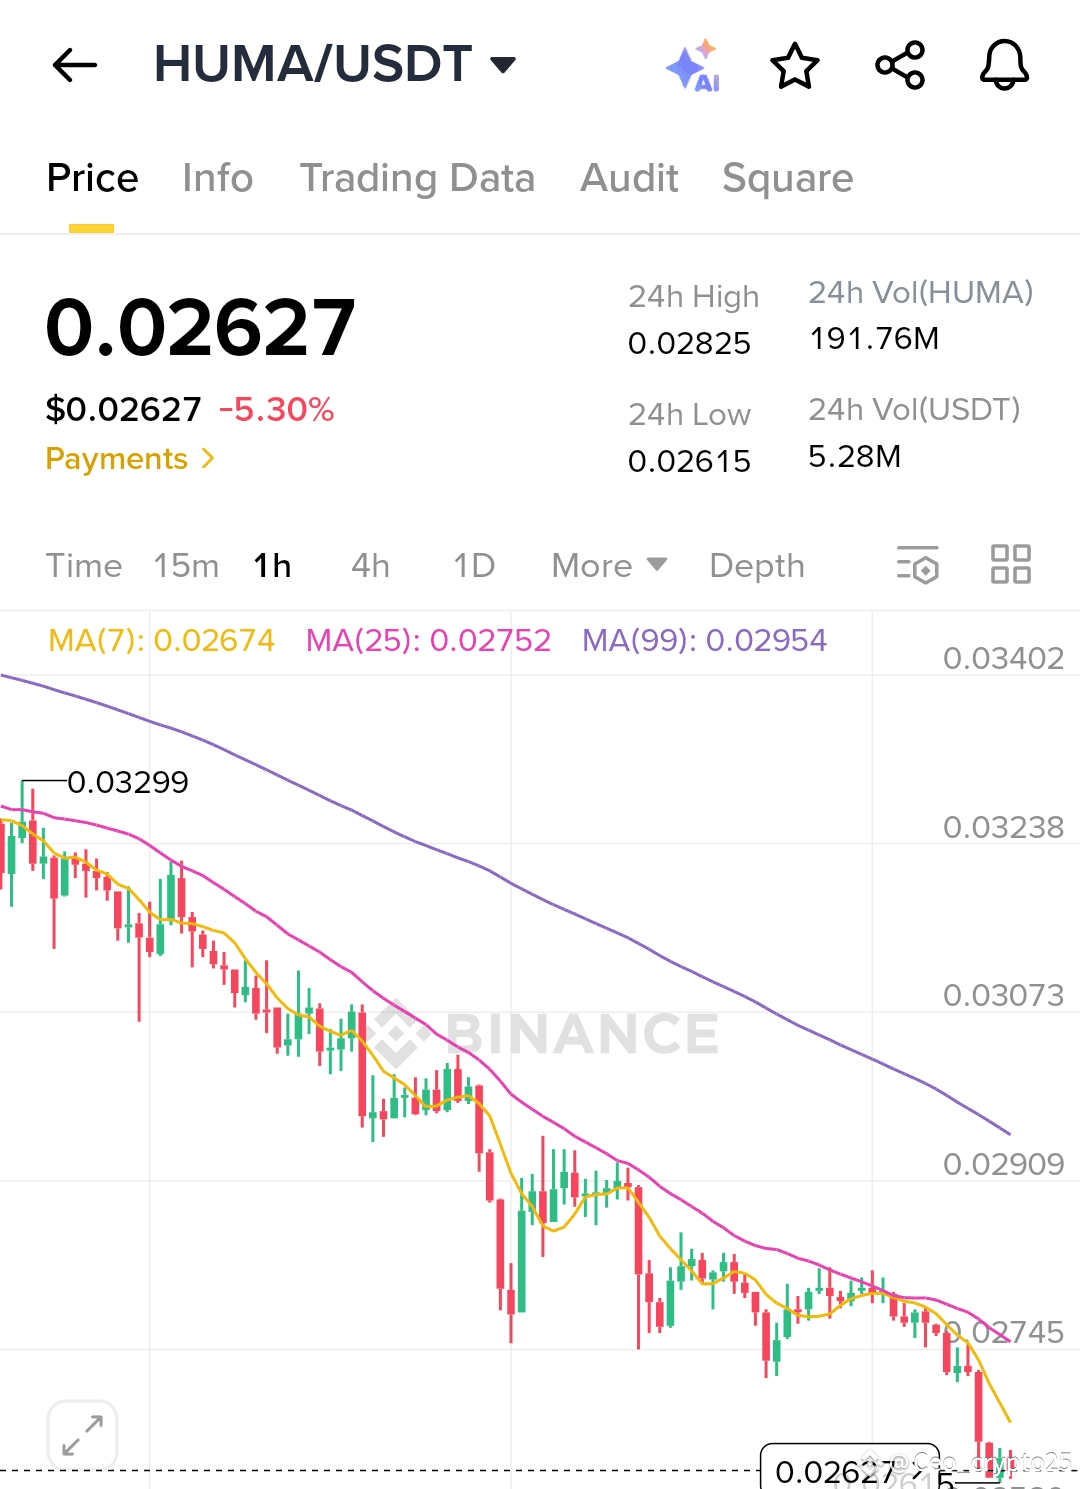
Summary Table: 24-Hour HUMA/USDT Overview
Category. Insight
Price Range~$0.0261 – $0.0283 (volatile, but in a tight corridor)
Key LevelsSupport: $0.0323 → next target $0.0315 Resistance: $0.0340 – $0.0345
MomentumOversold RSI (~24), but MACD remains bearish
VolumeDropped ~40% → thinner liquidity = higher volatilitySentiment
Altcoin weakness as Bitcoin dominates; cautious investor environment
FundamentalsReal-world partnership boost (same-day settlement); tokenomics risk due to low circulating supply
OutlookRanging—but bullish potential if resistance breaks and partnerships gain traction
Final Thoughts
Imagine HUMA’s price as a tightrope walker—precariously balancing between cautious sellers below and hopeful buyers above. For now, the act is on hold: volume is low, momentum is thin, and the next step depends on whether confidence re-enters the ring or sellers reclaim control.
What to watch next:
A firm hold above $0.0323 could pave the way for a bounce toward $0.0340+.
Falling below that may open downside pressure toward $0.0315 or lower.
Real-world adoption headlines or exchange developments could inject fresh momentum.
Keep an eye on macro crypto trends—especially Bitcoin’s share of the spotlight.


