
Basic concept of the pattern
Among the entire harmonic trading toolkit, the Bat pattern is perhaps the most precise pattern.
This pattern contains many explicit elements that define an excellent potential reversal zone (PRZ).
This pattern usually represents another deep test of support or resistance, which is often very rapid.
Rapid reversals starting from the Bat pattern PRZ are common.
In fact, effective reversals starting from the Bat pattern often include very extreme price action.This pattern contains a strong 0.886 XA retracement, which is a decisive element in the PRZ.
Point B retracement must be less than 0.618, preferably 0.50 or 0.382 of the XA arm.The most ideal B point ratio is 50% of the XA arm.
Point B is one of the main methods to distinguish between the Bat pattern and the Gartley pattern.
If a pattern is forming and point B is exactly at 0.50 of the XA arm, then it is likely a Bat pattern.The BC extension used in the Bat pattern is at least 1.618.
The BC extension can be as long as 2.618.
However, the most ideal BC extension for the Bat pattern is 1.618 or 2.0.
It should be noted that the BC extension must not be 1.27, because if the BC extension is less than 1.618, then the structure will fail.
In addition, the 1.27 BC extension is usually seen in the Gartley structure.AB=CD in the Bat pattern is also an element that distinguishes this structure from other structures.
This pattern is usually extended, and ideally, the Bat structure contains a 1.27 AB=CD calculation result.
However, the equidistant AB=CD pattern is indeed the minimum requirement for any Bat pattern to be a valid architecture.The accuracy of the Bat pattern is incredible, and the required stop loss is much smaller than most other patterns.
The 0.886 retracement is the most important number in the PRZ, but tight convergence is a common feature for other harmonic numbers within the structure to define a precise range.
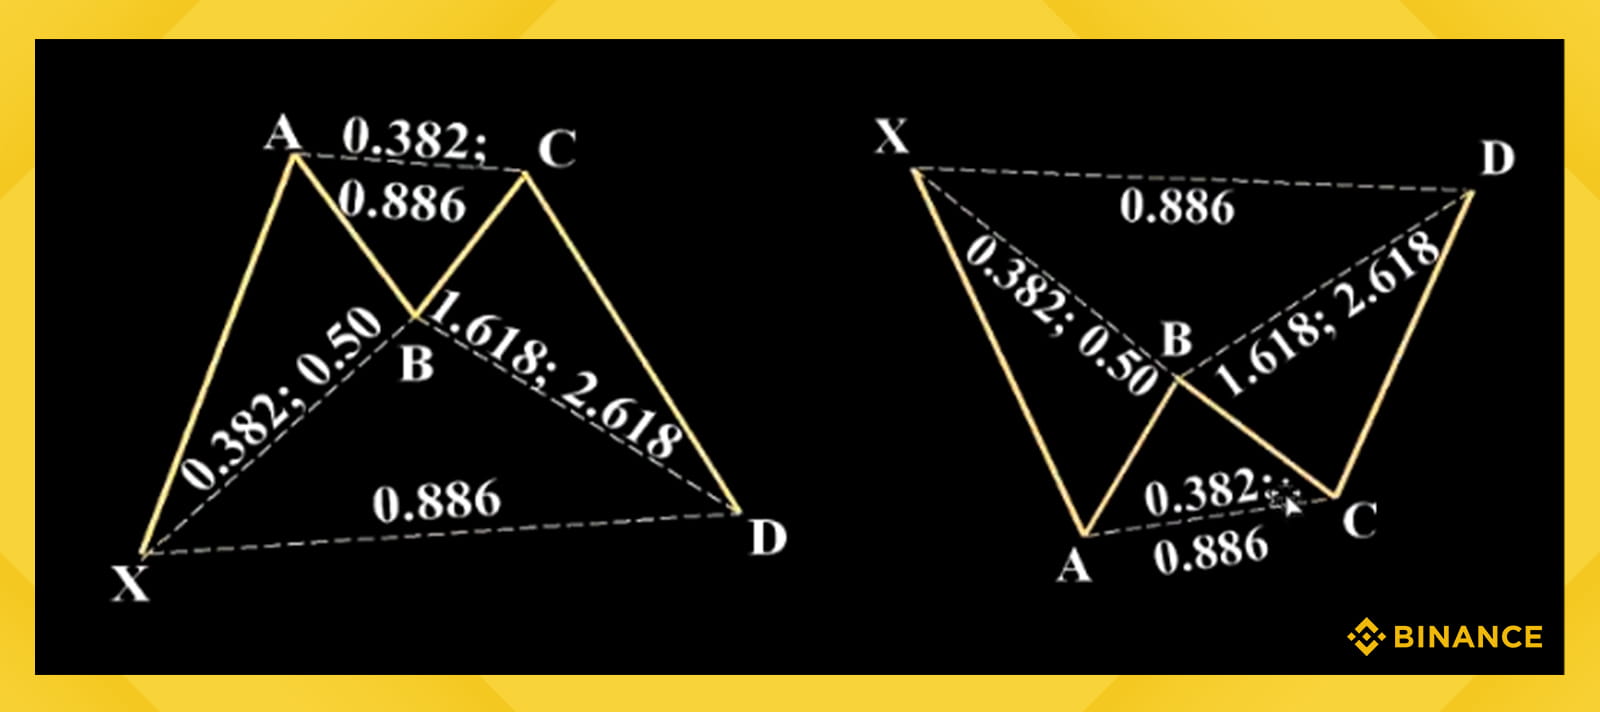
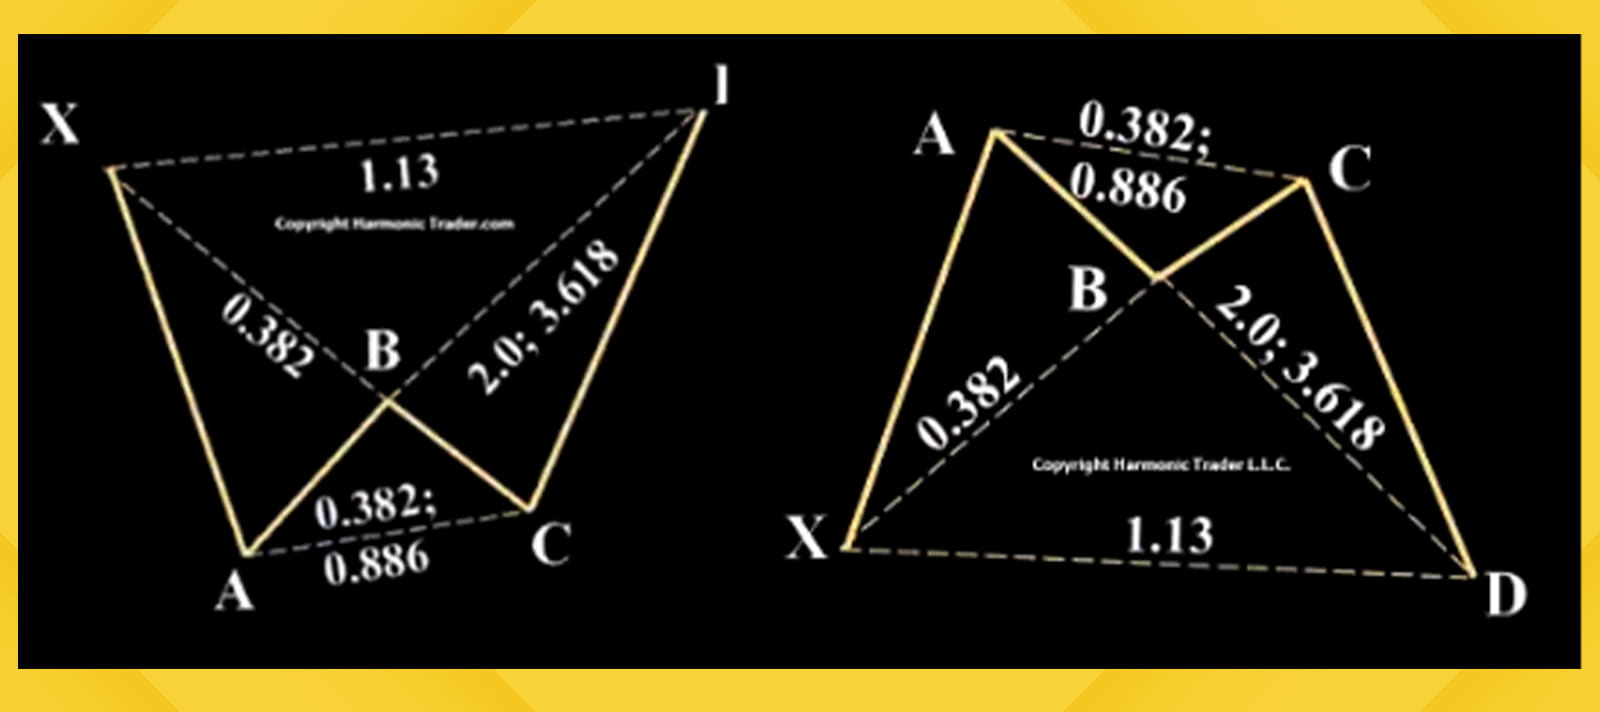
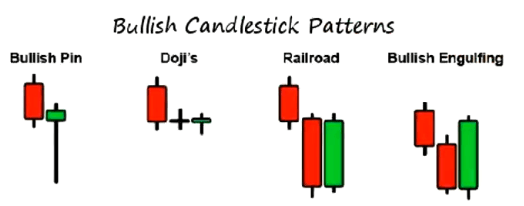
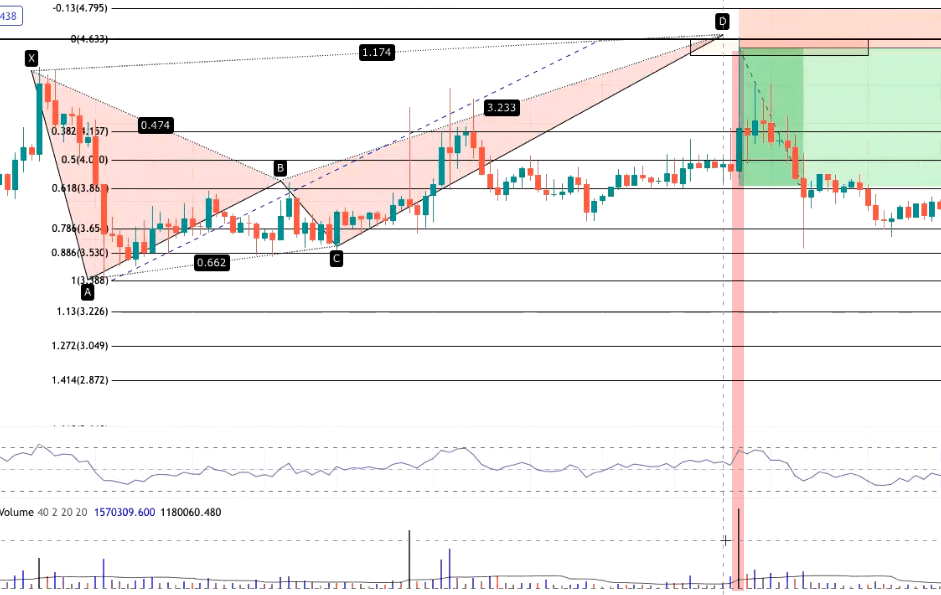
Pattern classification: Bullish Bat pattern
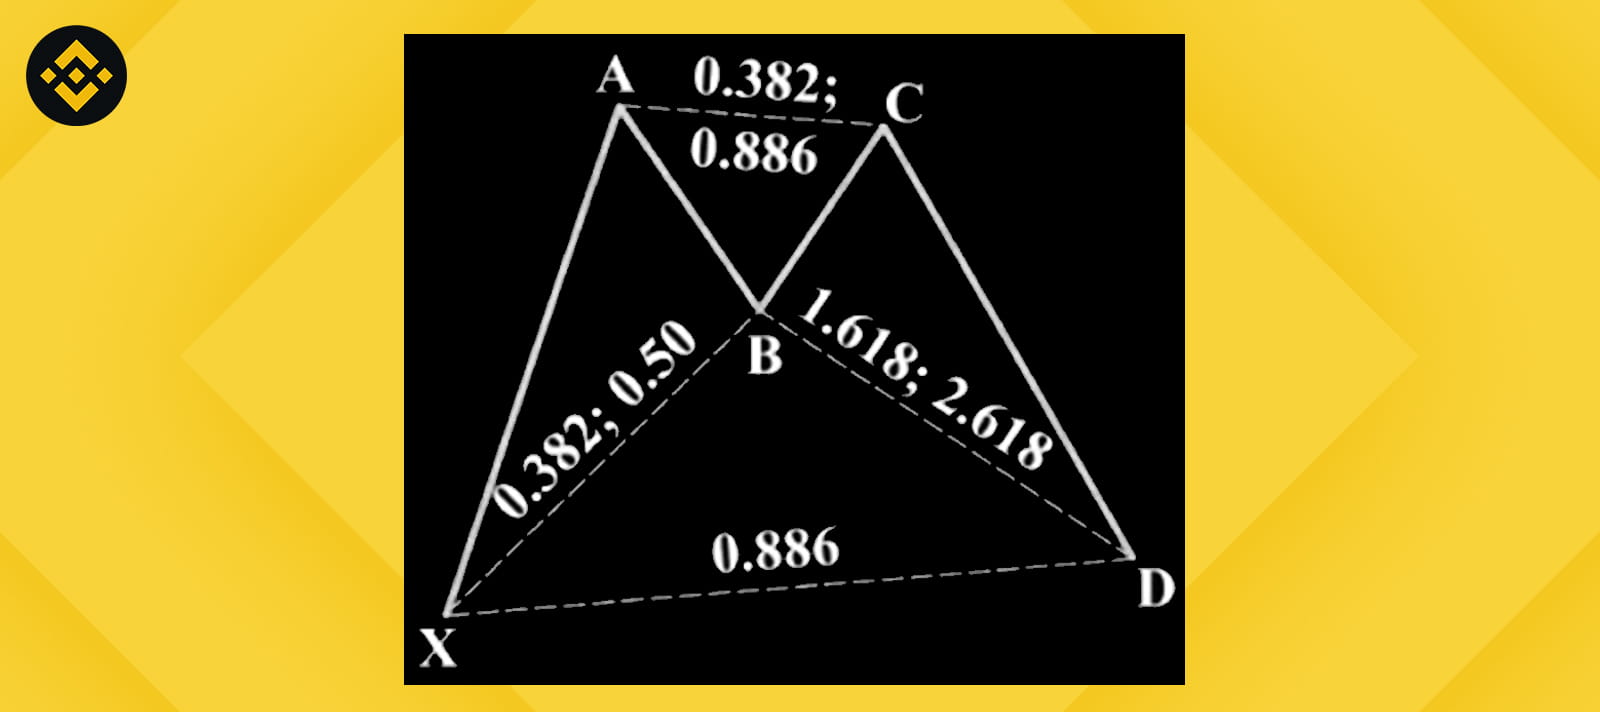
Point B is lower than the 0.618 retracement, preferably 0.50 or 0.382 of the XA arm, then the bullish Bat pattern is defined.
In this architecture, the bullish 0.886 retracement is crucial.
Typically, the bullish Bat pattern is an excellent 5-point adjustment structure that appears at a clearly defined support level.
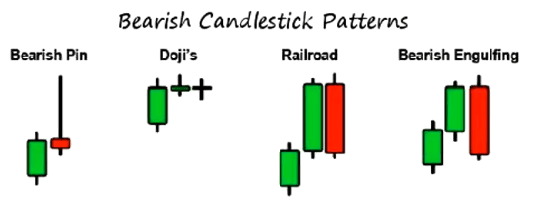
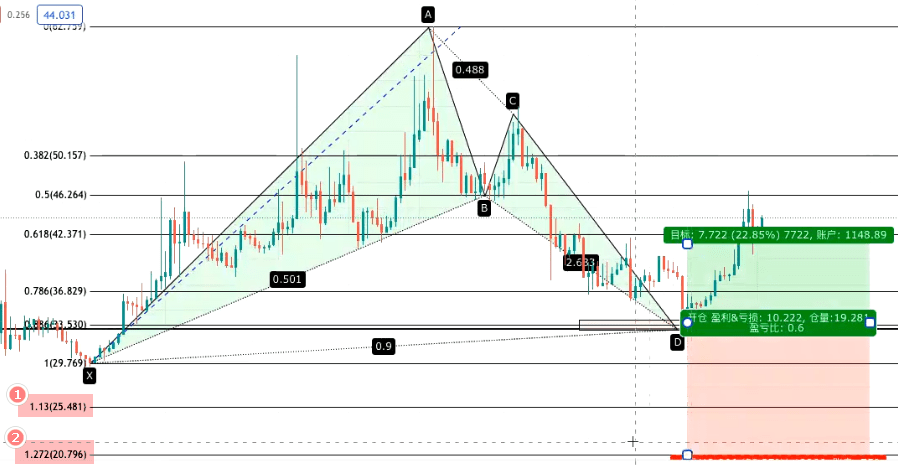
Pattern classification: Bearish Bat pattern
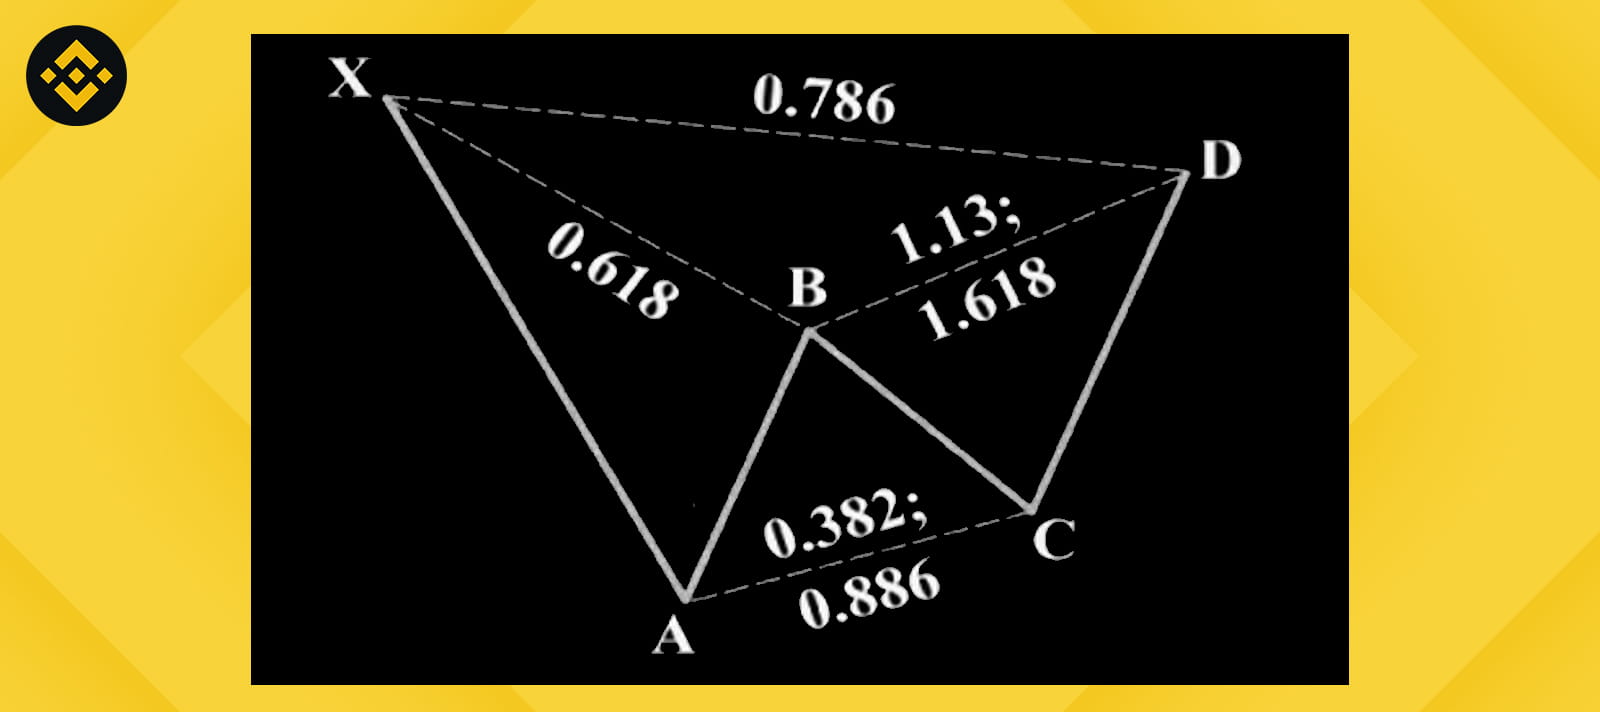
Point B is lower than the 0.618 retracement, preferably 0.50 or 0.382 of the XA arm, then the bearish Bat pattern is defined.
The bearish Bat pattern is a very excellent 5-point adjustment structure that often forms after a pullback to a key high point.
In addition, when these structures form at obvious resistance levels, they are excellent trading opportunities.
💻💻💻💻💻💻💻💻💻💻💻💻
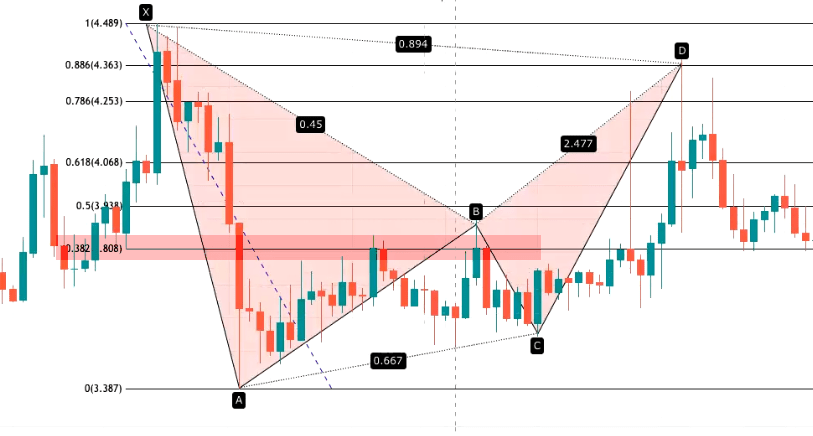
The 0.886 XA retracement is the most critical price level in the bearish Bat pattern.
Since the appearance of this retracement is close to the previous high point ——— the initial starting point of the pattern (X), the price action represents a major challenge to the previous resistance.
The structural signal exhibited by the Bat pattern is an important technical factor, the importance of which is higher than other simple retests.
The Bat pattern formed at the obvious resistance level often indicates that there will be a substantial change in the trend ——— this is true on any time frame!
It is very important to wait for such clear opportunities.
Needless to say, wait for the entire PRZ range to be tested to confirm the completion of the pattern.
Although this may delay the execution of the transaction slightly, an effective reversal will provide a decisive signal shortly after the pattern is completed.
💻💻💻💻💻💻💻💻💻💻💻💻
Rules - How do I draw the Bat pattern?
🌞Pattern elements
👉 Point B is lower than the 0.618 retracement of XA, preferably an obvious 0.5 or 0.382 retracement
👉 BC extension is at least 1.618
👉 The AB=CD pattern is usually extended
👉 0.886 XA retracement
👉 Point C is within the range formed by 0.382 and 0.886
🌞Pattern confirmation
👉 The most critical Fibonacci for this pattern is the 0.886 retracement of XA
👉 The B point retracement must be between 0.382 - 0.5 of XA, and cannot touch 0.618
👉 Like the Gartley pattern, point D needs 3 overlapping Fibonacci lines to be considered established
👉 A failed bat may become a 113 bat or a crab pattern
Operating steps:
⭐ The first step is to find available X points: X points are generally obvious V or U high/low points (there may be multiple, test them all)
⭐ [Fibonacci Retracement] tool, pull from X to A to find point B
If point B retraces between 0.382 - 0.5 XA, then it is qualified
If it reaches 0.382 XA exactly, it is likely to be a variant bat
⭐ [Fibonacci Retracement] tool, pull from A to B to find point C
If the retracement of point C is between 0.382 - 0.886 AB, then it is qualified
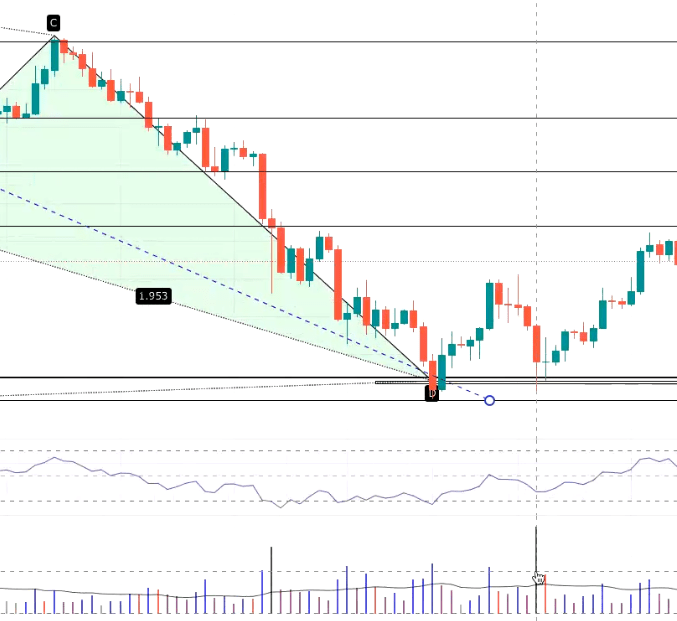
⭐ Point D is composed of 3 Fibonacci lines, and the overlapping area of these 3 lines is the so-called D point or potential reversal zone (PRZ)
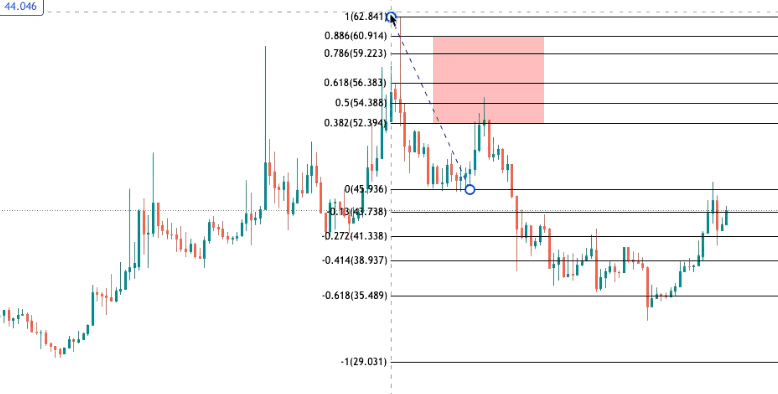
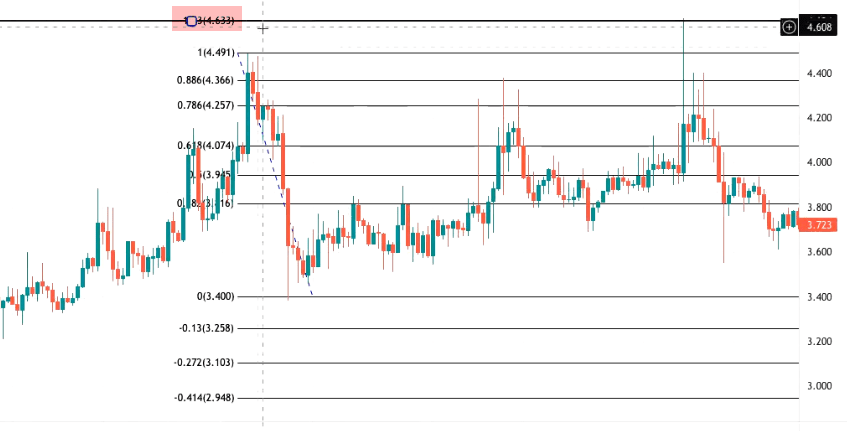
👍 Step one: XA 0.886
[Fibonacci Retracement] tool, pull from X to A to get the XA retracement, and draw a horizontal line at 0.886 XA
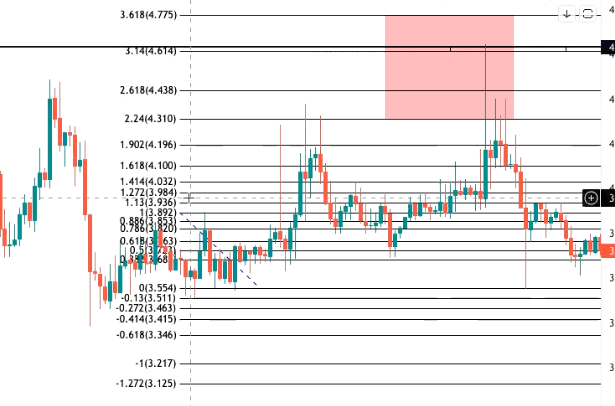
👍 Step two: BC 1.618 - 2.618 (It is not established if BC does not reach 1.618)
[Fibonacci Retracement] tool, pull from B to C to get the BC extension, find the Fibonacci parameter line closest to 0.886XA, and draw the interval block
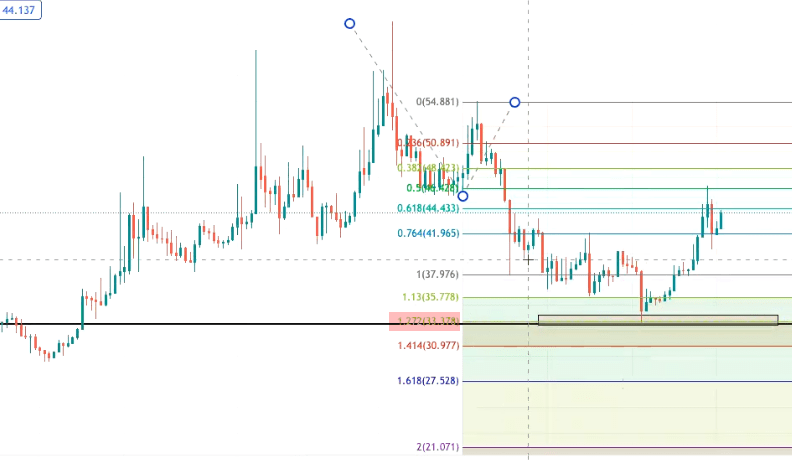
👍 Step three: AB = CD (generally to 1.27 AB=CD)
[Fibonacci Trend Extension] tool, from A to B to C, find the position of 1.27, and fine-tune the above interval block
💻💻💻💻💻💻💻💻💻💻💻💻
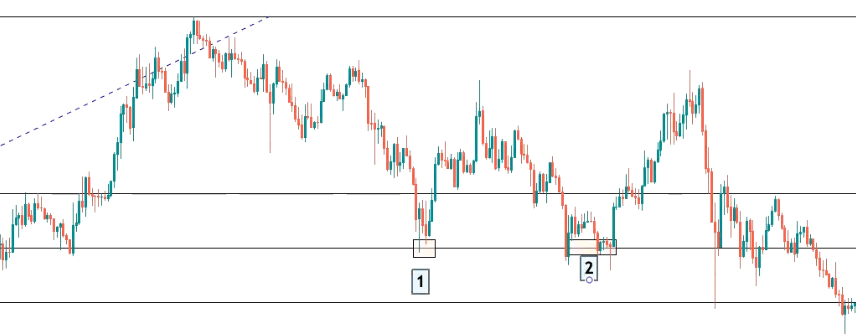
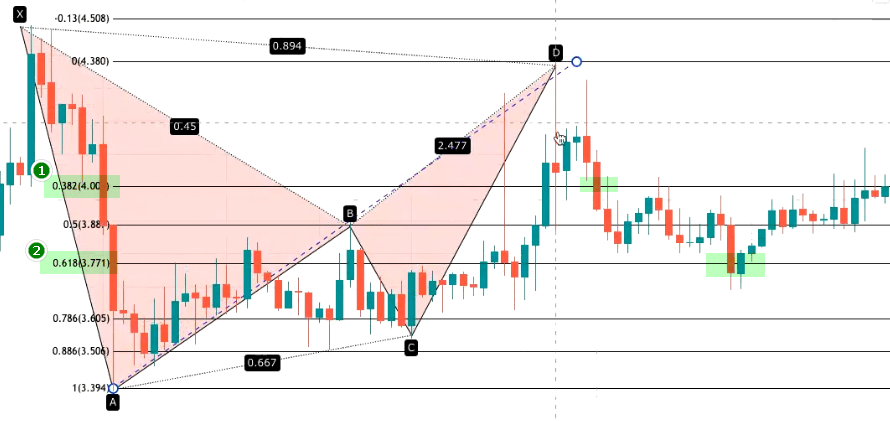
Special situation: XA is qualified, how to choose if there are two retracement B points?
💻💻💻💻💻💻💻💻💻💻💻💻
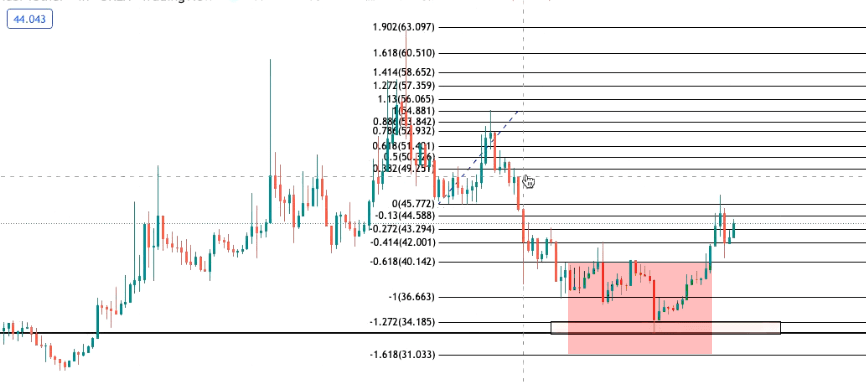
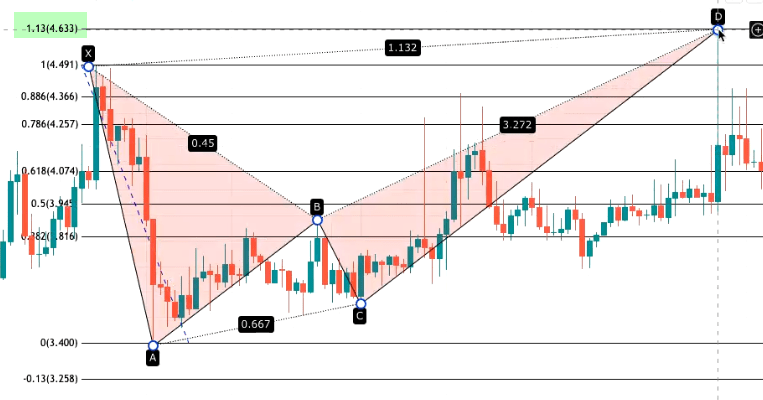
Pattern classification: Variant Bat
👉 The position of point B is around 0.382 XA, less than 0.5 XA, and may reverse after completing the bat, or may directly follow the trend to a higher D point
👉 At this time, the position of D point is at 113, and you need to be vigilant about this situation
Operating steps: The preceding steps for finding XABC are the same, and the D point confirmation steps are as follows:
👍 Step one: XA 1.13
[Fibonacci Retracement] tool, draw a horizontal line at XA 1.13
👍 Step two: BC 2.0 - 3.168
[Fibonacci Retracement] tool, extend BC, find the Fibonacci parameter closest to the above horizontal line, and draw the reversal zone
👍 Step three: AB = CD (generally to 1.618AB=CD)
[Fibonacci Trend Extension] tool, from A to B to C, find the position of 1.618, and fine-tune the above interval block
Entry Timing - How do I look at the Bat pattern to enter the market?
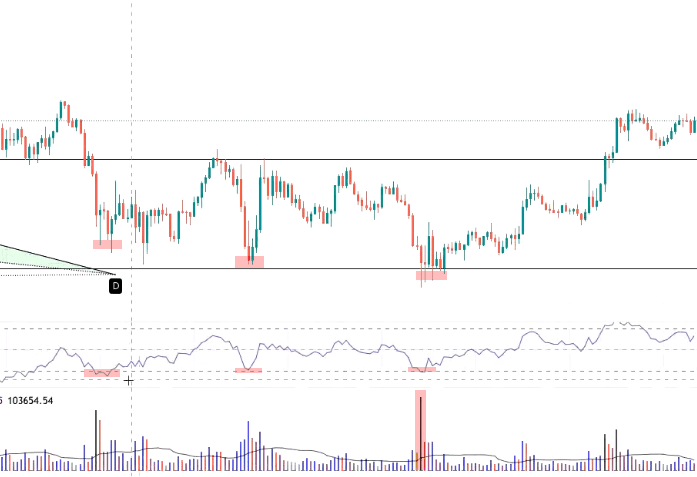
🌞886 Ordinary Bat
👉 The most important thing is to touch the horizontal line of XA 0.886, otherwise the 886 bat pattern is not established
👉 May not test the entire PRZ
👉 If testing the PRZ 1-3 times is acceptable, be careful of pattern failure if testing more than 3 times
👉 Check whether the RSI has reached overbought or oversold, and observe after the RSI comes out:
Reversal candle pattern (simplest)
Break the trend line in a small time frame (poor profit-loss ratio)
After the candle reverses, place an order to enter the market in the reversal zone (may miss it)
Surge in volume
👉 Enter the market in batches
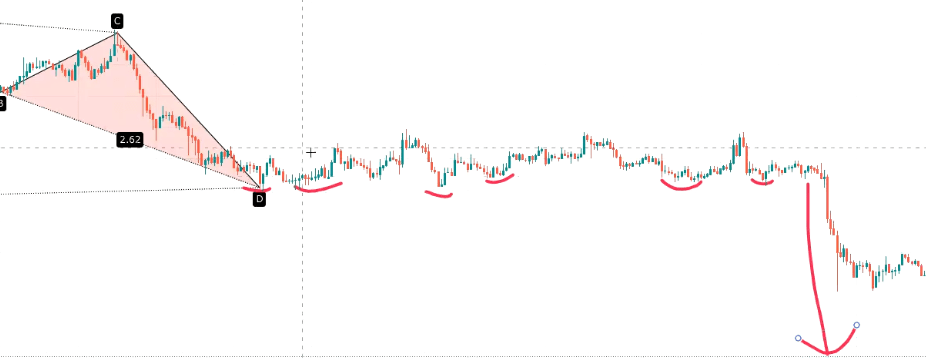
🌞113 Variant Bat
💻💻💻💻💻💻💻💻💻💻💻💻
Ordinary bats (Point B 0.5XA) may also become 113 bats
Therefore, whether trading bats or 113 bats, if the price reaches XA 0.886 and does not reverse, pay attention to the second potential reversal opportunity of XA 1.13.
If BCD is completed quickly, it means the momentum is too strong, and it is likely that both 886 and 113 will fail, and it will break through to Crab
💻💻💻💻💻💻💻💻💻💻💻💻
👉 The most important thing is to touch the horizontal line of XA 0.886, otherwise the 886 bat pattern is not established
👉 May not test the entire PRZ
👉 If testing the PRZ 1-3 times is acceptable, be careful of pattern failure if testing more than 3 times
👉 Check whether the RSI has reached overbought or oversold, and observe after the RSI comes out:
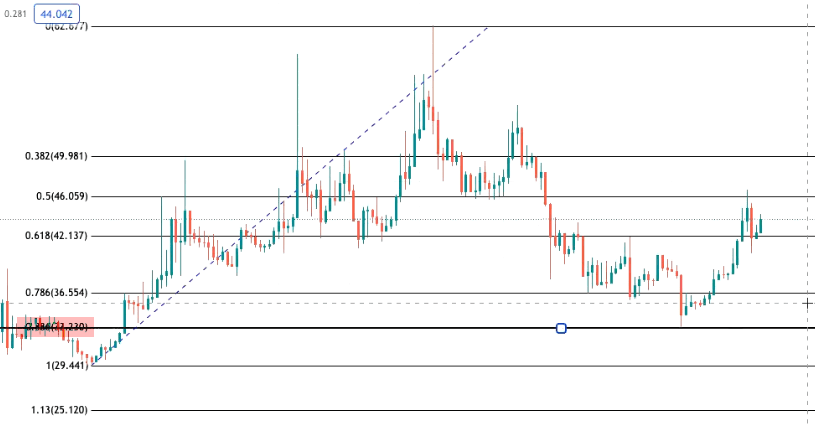
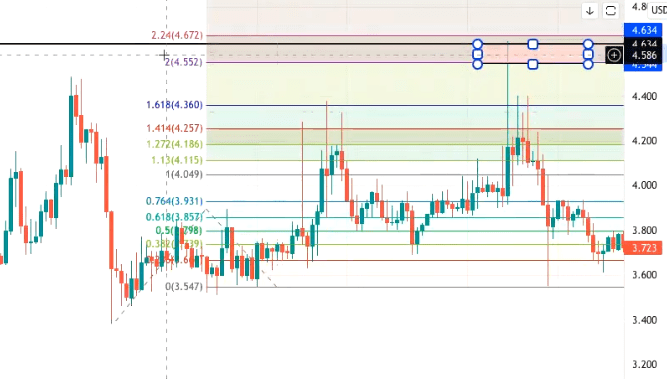
Take Profit and Stop Loss - How should I look at the Bat pattern to do take profit and stop loss?
👉 [Fibonacci Retracement] tool, pull from X to A
👉 Stop loss position: The first stop loss position is 1.13 XA, and the second stop loss position is 1.27 XA. Generally placed in the second position to prevent being hit by the stop loss in the first position and then reversing.
👉 [Fibonacci Retracement] tool, pull from A to D
👉 Take profit position: The first take profit position is 0.382 AD, and the second take profit position is 0.618 AD
After reaching the first position, half of the position can be closed, and the remaining position's stop loss can be moved to the cost price
👉 Stop loss position: The third position is 1.13AD
If there is a surge in volume, the stop loss can be placed below point X, which is around 1.13AD.
🧧😘🧧😘🧧😘🧧😘🧧🧧😘🧧😘🧧
Other to be added


