Alright, fellow Crypto Builders and Degens, welcome back to my channel. I am your old friend, the KOL who has surfed the Web3 world with you and also stepped into pitfalls together.
Today, I won’t discuss the FOMO emotions surrounding hundred-fold coins, nor do I want to analyze those complicated white papers that can make one’s head spin. I want to talk about a 'small thing' that has profoundly impacted me recently, even slightly changing my investment habits — Bubblemaps.
Having been in the crypto space for a long time, we are all used to looking at K-lines, analyzing TVL, and digging into project GitHub. We think we have mastered all the information, but in reality, we may have been 'blind men touching an elephant'.
Let's take the simplest example: a new project goes live, and you see a whale buying in. Doesn’t that feel stable? But if I tell you that seven of the top ten holding addresses are 'aliases' controlled by the project team themselves, and they are frequently transferring between each other to create a false sense of trading activity, would you still dare to jump in?
This is actually a very common yet extremely hidden issue in the industry — 'linked wallets'. We use Etherscan every day, but to be honest, aside from checking transaction records and balances, those cold code addresses mean almost nothing to us ordinary users. We cannot see the relationships behind the addresses or the true flow of funds on the network.
And Bubblemaps is the tool that breaks through this layer of 'window paper'.
What it does is simple, but it hits the pain point directly: it visualizes the relationships of on-chain wallets.
It no longer gives you a string of dry address lists but turns each wallet into a 'bubble'. The larger the bubble, the greater the holding amount. More importantly, if there is a token transfer relationship between two wallets, Bubblemaps will connect them with a line.
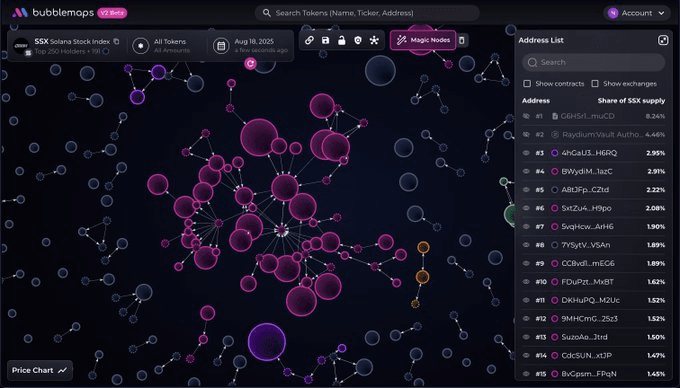
When the associations of hundreds of wallets are clearly displayed before you, how can that feeling be described? It's like suddenly putting on a pair of 'X-ray glasses'.
Some interesting and real stories have occurred:
'Witch Attack' Revealed: There was a project that airdropped tokens, with the rule that any address participating in the testnet could claim them. As a result, using Bubblemaps, we saw a staggering number of small wallets, all distributing test tokens from the same initial address. This standard 'witch attack' arbitrage model is clear at a glance on the bubble chart. For the project team, it serves as a mirror; for us ordinary users, it's a guide to avoiding pitfalls.
Tracking the real path of 'smart money': We often say to 'Follow the smart money'. But many times, you only see a well-known VC's address buying a token, without knowing that this VC might have quietly divided and arranged their purchases through several anonymous wallets before buying in. With Bubblemaps, you can trace the complete 'hunting path' of these top players, as their layout ideas and cooperative networks may be hidden in these linked bubbles. This information is more real and raw than anything a paid Alpha group could provide.
The 'Death Ledger' of Meme Coins: We have all rushed into meme coins, and the biggest fear is the project team dumping. Many times, the project team will claim that the token was 'fairly launched' and that the liquidity pool is locked. But as long as you throw the token contract address into Bubblemaps, you often discover a shocking scene: those 'early investor' wallets that claim no connection actually have countless ties to the project's deployment wallet. When these bubbles are tightly clustered together, you should realize that the little bit of money in your pocket is just a dish on their table.
Why talk about it now? — From 'information symmetry' to 'cognitive symmetry'
At this point, you might think Bubblemaps is just a tool for 'checking the project team'. But in my view, its significance goes far beyond that.
What is the core spirit of Web3? It is decentralization, transparency, and being Trustless. But for a long time, we have only had 'data transparency' rather than 'information transparency'. The data is all on-chain, anyone can look, but only a few can understand it.
The emergence of tools like Bubblemaps is quietly bridging this cognitive gap. It presents complex on-chain data in an almost intuitive way to everyone. This is not just a victory for the tool but also a landing of the Web3 spirit. It gives us ordinary investors the chance to examine a project from a relatively fair perspective, standing alongside those whales and VCs who hold vast amounts of money and information.
It is a 'defensive' weapon; it cannot guarantee you profits but can greatly help you avoid losses. In this market full of traps, surviving is more important than anything.
I have not received any advertising fees from Bubblemaps. The reason I want to talk to you about it today is that I genuinely feel this type of data visualization tool is becoming the 'new infrastructure' for future Web3 investments. While others are still fixated on K-line fluctuations, you can already see the iceberg and undercurrents beneath the surface.
Your investment decisions will no longer be based solely on community sentiment and KOL recommendations but on the on-chain facts you have personally witnessed and cannot be forged.