Previously, in the teaching of wave theory, I specifically explained the triangle consolidation as a corrective pattern. This issue takes the opportunity to explain the ascending triangle separately and reflect on missing the 600 points in Ethereum yesterday.
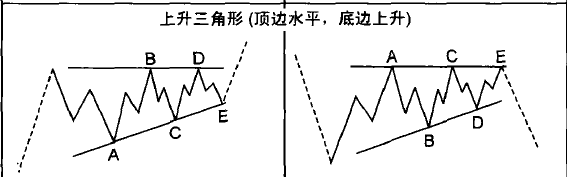
The ascending triangle explained previously generally appears as a continuation pattern, representing the ascending triangle consolidation in an uptrend and the ascending triangle consolidation in a downtrend.
(Technical Analysis of Financial Markets) provides a comprehensive explanation of the ascending triangle; friends who are interested can take a look.
The ascending triangle often appears in an uptrend and is a continuation pattern, indicating that this pattern is relatively common in an uptrend, while it can also appear in a downtrend but is less common. Sometimes it manifests as a bottom pattern, which is not surprising when an ascending triangle appears at the end of a strong downtrend. I noticed this back then, but I didn't pay much attention.
Summary: The ascending triangle appearing in a downtrend can occur as either a continuation pattern or a reversal pattern.
The left image explains the two movements of the ascending triangle appearing in a downtrend. The right image is a typical expanding triangle movement. Similarly, triangles that act as bottom patterns could be ascending triangles, descending triangles, symmetrical triangles, or expanding triangles.
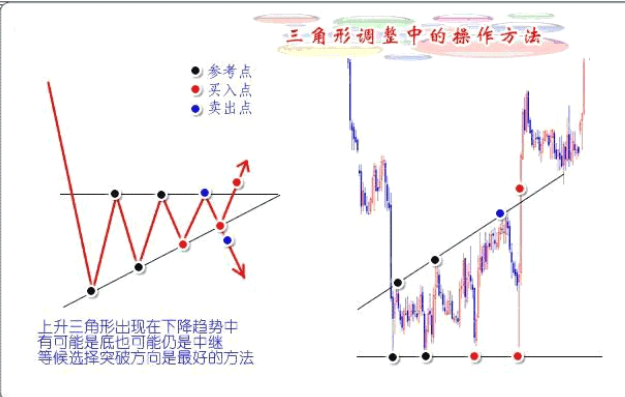
However, in actual operations, two situations may arise: 1. False breakout: How to judge a false breakout? Two recommended methods: 1. The closing price crosses the breakout line principle, 2. The breakout magnitude principle.
2. If the breakout doesn't retrace, won't that mean missing the opportunity to build a position? Breaking out and building a position in the direction of the trend belongs to right-side trading, which has a higher probability of success. However, for left-side traders, they may make an early prediction, which can be summarized as betting on the direction based on comprehensive analysis, where the advantage lies in the entry point and the disadvantage lies in the risk.
Having said so much, let's return to our chart and review where the mistakes were in yesterday's operations:
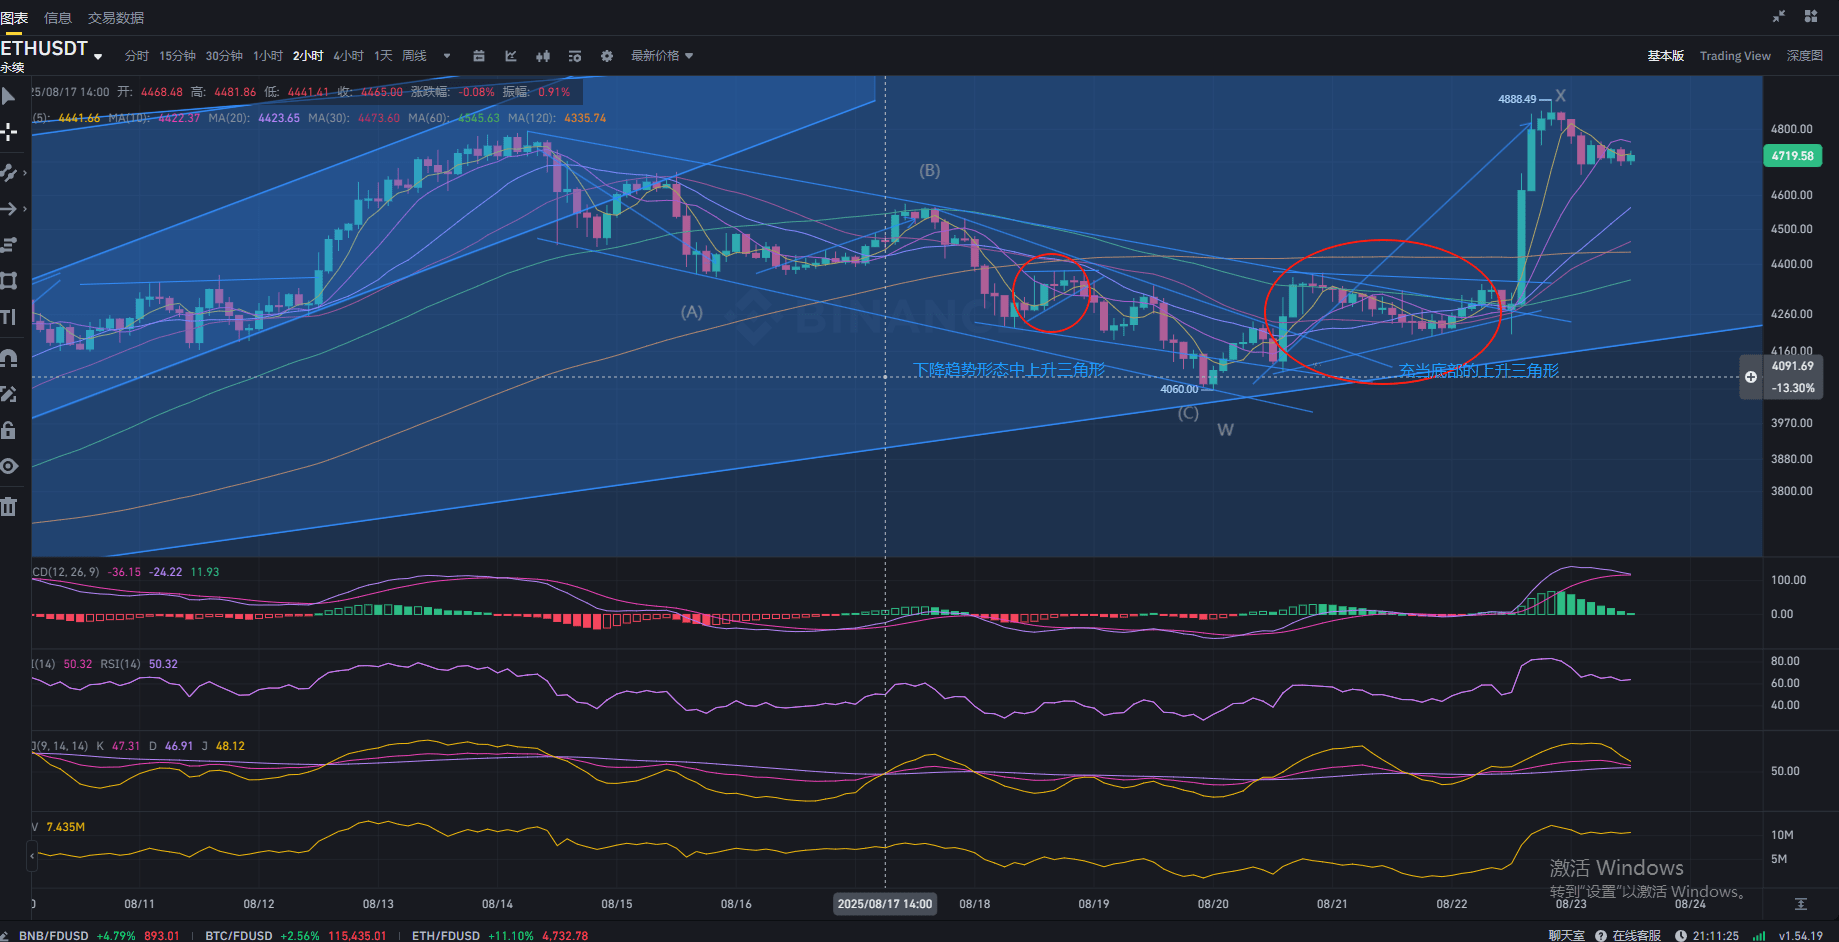
The image shows two ascending triangles: one appears as a continuation pattern in a downtrend, and the other appears as a bottom reversal pattern. The most common should be the ascending triangle in an uptrend.
Why do the same patterns appear in a downtrend but have different movements? The answer is simply that their positions are different.
Carefully look at the first red circle on the left: the entire ascending triangle is below the descending trend line. In contrast, the second one: part is below the trend line, and part is above the trend line; the difference lies here. Therefore, the key point is: the trend line is a supplementary verification tool. The triangle also has a measurement function: measure the widest distance within the triangle and project the same distance upwards from the breakout point.
When this pattern appeared at 19:50, what I was thinking was: Focus points: lower support, upper resistance. No matter which direction it breaks, once it breaks, there will be at least 300 points of space.
Yesterday around 20:00, ETH even temporarily broke below the support line of the ascending triangle. When it broke, I even had an illusion because I glanced at BTC, which had broken below yesterday's low. In the morning analysis, I also found that BTC had a bottom divergence phenomenon on the 4H chart, suggesting a potential rebound. Moreover, ETH's movement was relatively strong, BTC weakly rebounding, and ETH strongly rebounding; if BTC strongly rebounds, then ETH would surge. That was the initial thought, but because there was a speech from Mr. Powell in the evening, and I personally felt it would lean towards a hawkish tone. At 21:00, the hourly chart showed ETH's entity breaking below the support line, which made me a bit anxious and led to misjudgment. However, before 22:00, the closing price remained above the ascending triangle and above the major trend resistance line, indicating short-term strength.
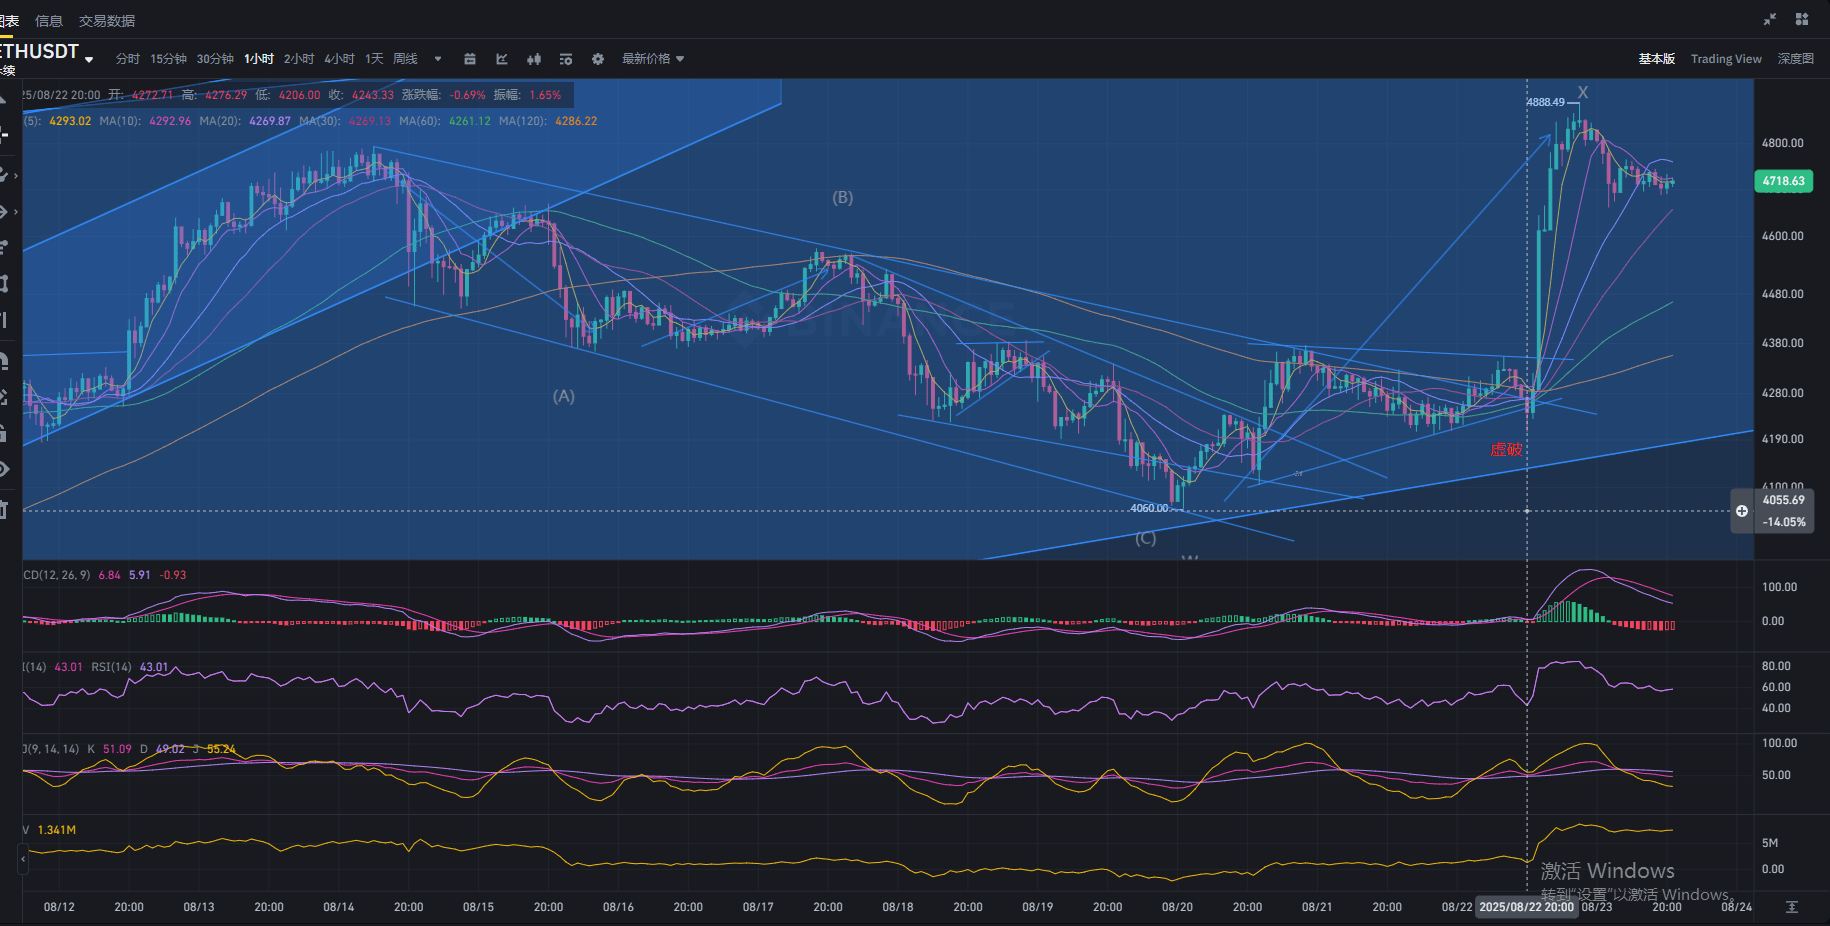
At 22:00, at the moment of the 2-hour closing, I missed the first opportunity to build a position around 3285. During Mr. Powell's speech, there was a sudden surge in volume, breaking through the 4380 resistance level and the 4400 resistance level. Logically, it should have been a breakout to build a position, but I did not enter, thus missing at least a 300-400 point surge (according to the triangle projection principle).


