🟡 Current Market Situation
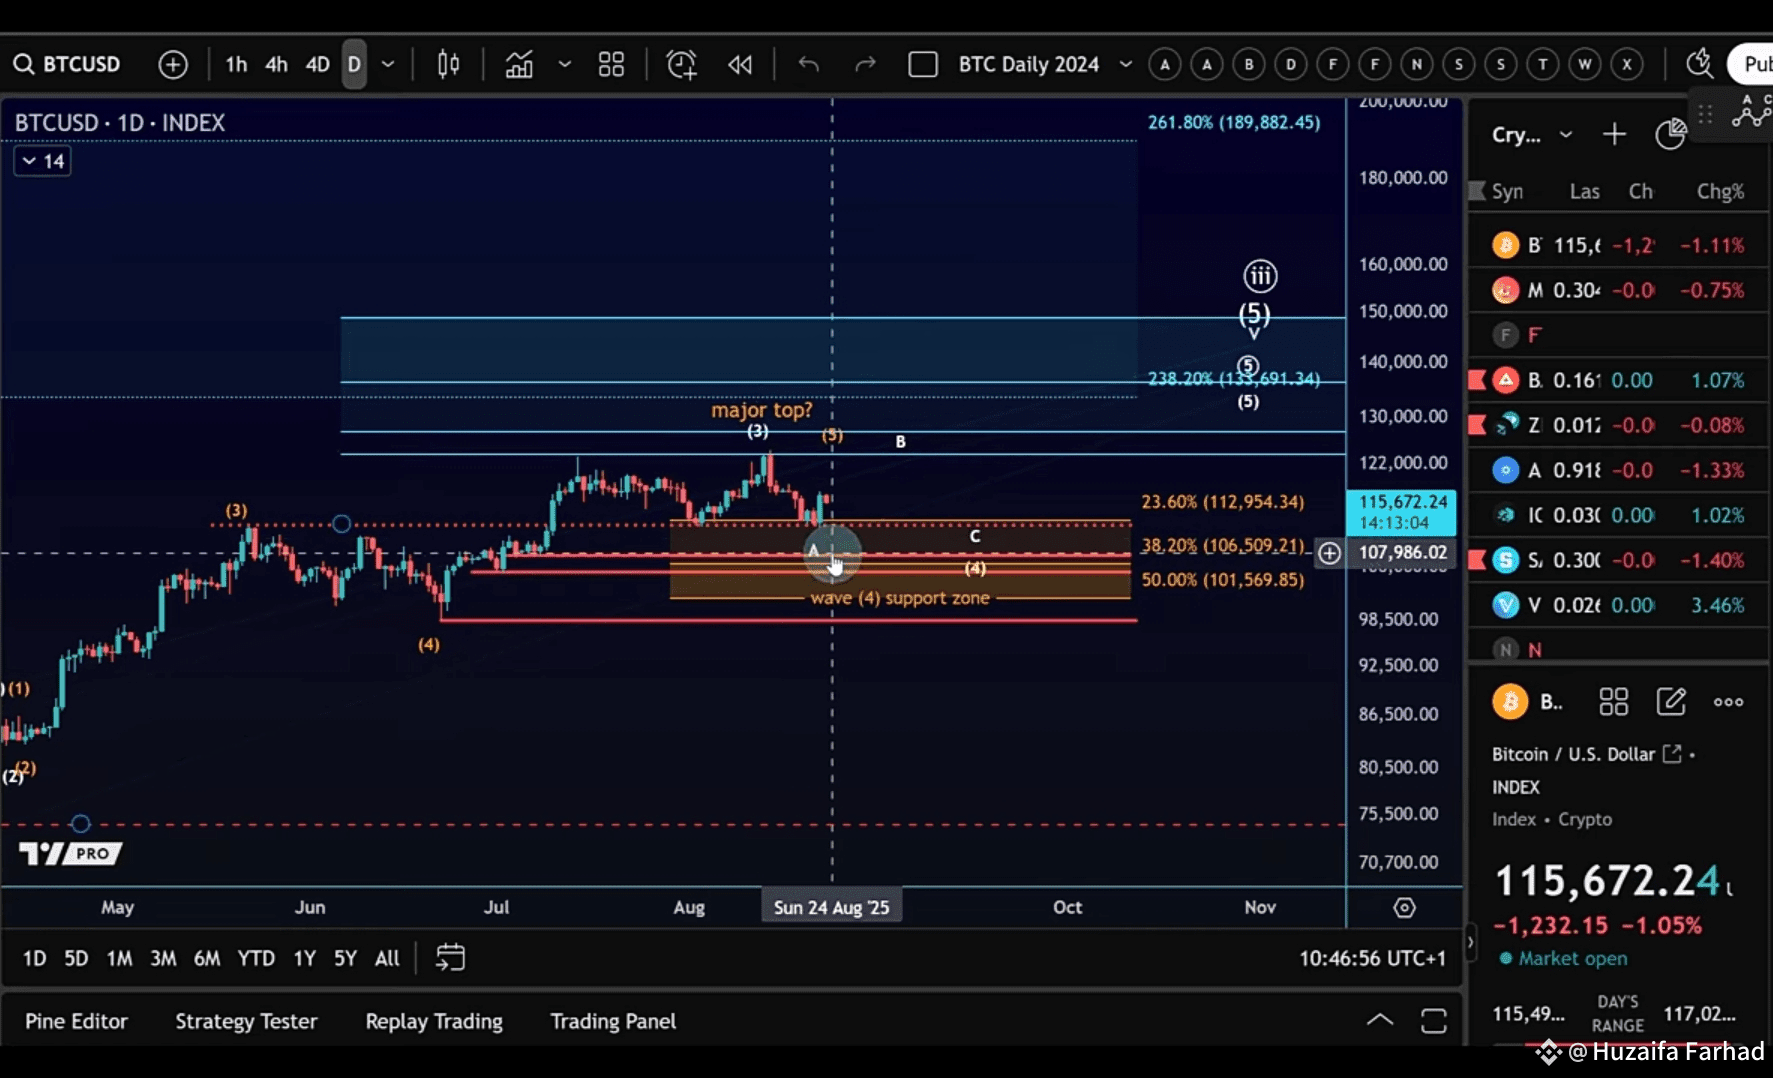
On the daily timeframe, Bitcoin appears to be in a wave 4 correction after hitting a new all-time high last week.
✅ Price has retraced into the Fibonacci support zone between $101,569 – $112,954.
✅ This support area is critical to keep the bullish Elliott Wave scenario intact.
⚠️ A break below $101,569 would shift probabilities and open the door for a deeper bearish scenario.
🔮 Upside Scenarios
If Bitcoin holds the support, one more high seems likely. Key Fibonacci targets to the upside:
$127,436
$133,690 – $136,520
These are the levels to watch if bulls manage to push higher.
🟠 Risk Factors to Watch
A 5-wave decline would be a bearish signal, suggesting the bears are gaining real control.
For now, the short-term pullback still looks corrective rather than a full trend reversal.
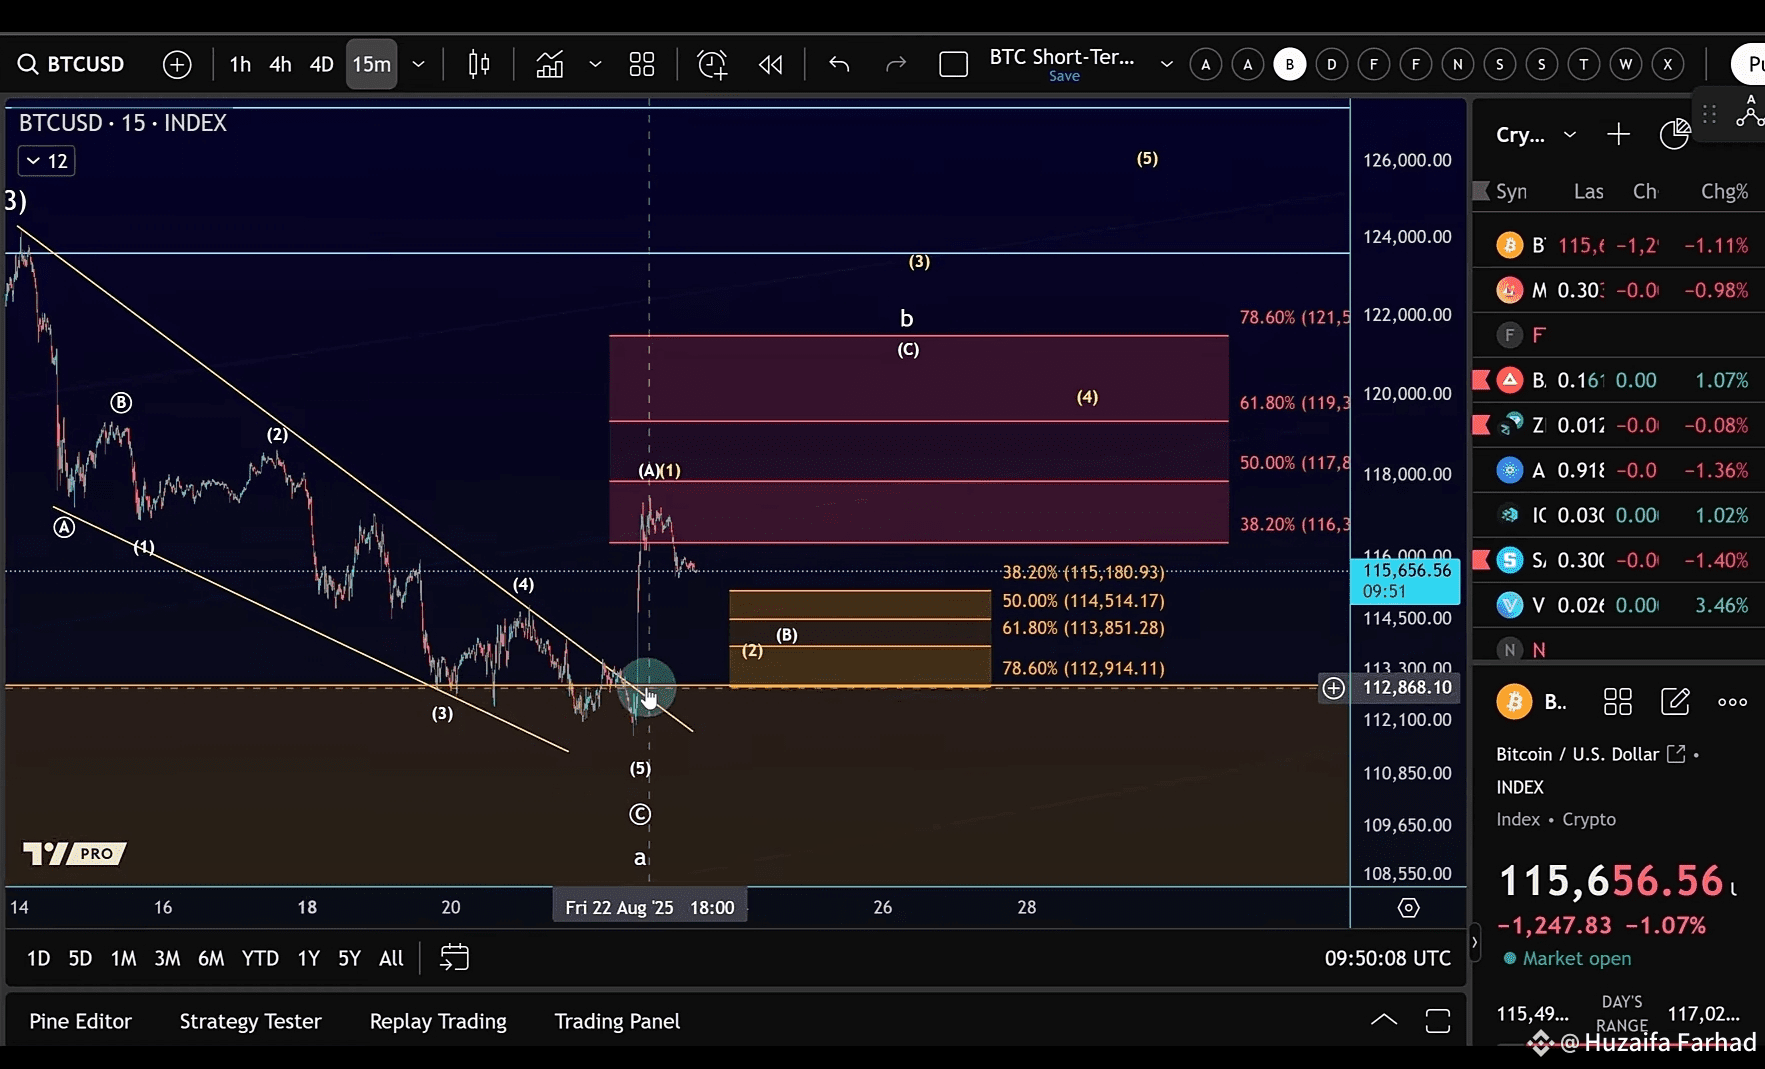
📊 Short-Term View (4H Chart)
We’ve already seen a bounce from 112.8K (23.6% Fib + August structural support).
Currently:
Market has moved from support into resistance.
An impulsive move up is visible – potentially wave A of B (within the wave 4 correction).
👉 Possible scenario:
Support for the pullback: $112,914 – $115,180
From here, Bitcoin could rally toward $119K – $121K in a C-wave.