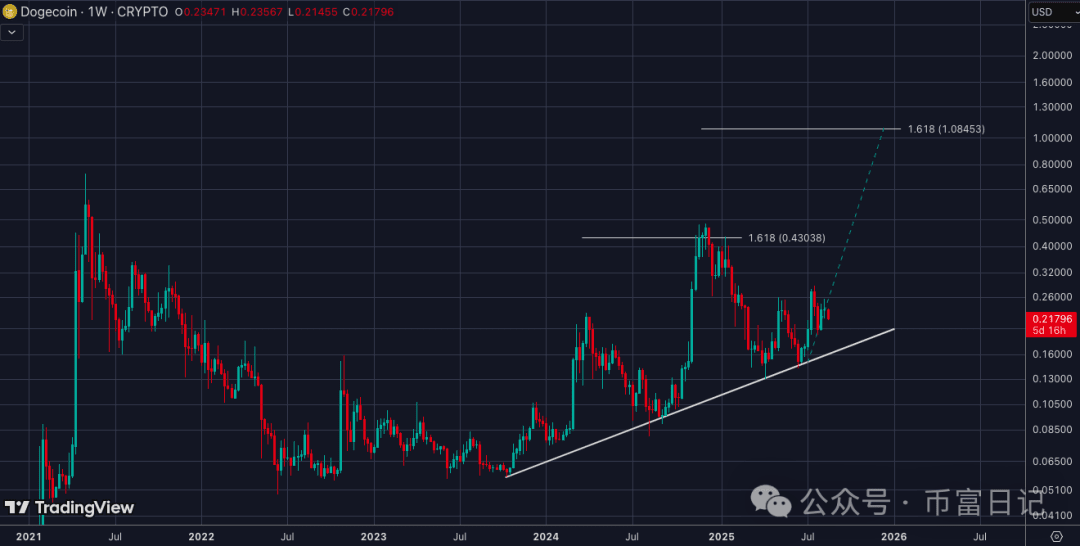
Dogecoin's price is currently holding above a clear rising support trend line, forming a bullish weekly structure, with a target price of $0.43, and the Fibonacci target near $1.08. If the weekly close decisively breaks $0.43 with increased volume, a sustained breakout above $1 is expected.

The rise of the weekly support confirms accumulation and the rise of lows, maintaining the integrity of the bullish structure.
The Fibonacci extension places the first resistance level at $0.43038, with a larger target at $1.08453.
Weekly candlestick charts and volume behavior indicate strong buyer confidence; a weekly close above $0.43 is a key trigger.
Dogecoin's price remains above the rising support level, with target prices of $0.43 and $1.08; please read our technical analysis and monitor the weekly close at $0.43 to confirm the breakout.
What is driving Dogecoin's breakout potential?
Dogecoin's price is supported by a multi-year rising trend line and consistently higher weekly lows, indicating steady upward movement. The combination of confirmed rising support and Fibonacci extension targets (at $0.43038 and $1.08453, respectively) provides a clear path for potential breakouts if volume and weekly closing prices align with bullish sentiment.
How do Fibonacci targets and volume confirm DOGE's upward movement?
The Fibonacci extension lines for the 2023-2024 uptrend indicate the current resistance level at $0.43038, with a secondary target at $1.08453. Historically, Dogecoin tends to accelerate after a consolidation phase, as the breakout weekly trading volume expands. Traders should monitor for spikes in weekly trading volume, higher weekly closes, and the maintenance of rising support as confirmation signals.
Based on the current structure, when can Dogecoin reach $1?
If Dogecoin holds the rising support level and decisively breaks $0.43 with volume confirmation, momentum could push the price into the $1 region within months. The timeframe depends on macro liquidity, the strength of the broader cryptocurrency market, and the ability to maintain the rising trend line during pullbacks.
Dogecoin is holding above rising support, and a bullish structure is forming. Key levels suggest a potential breakout above $1 in the coming months.
Dogecoin's weekly chart shows a bullish pattern with rising support, suggesting strong upside towards key resistance.
The Fibonacci extension shows that if momentum continues and the current trend line remains intact, DOGE could rebound to $0.43 or even $1.08.
The weekly candlestick chart shows sustained buyer interest, with support found on each pullback—indicating accumulation and potential future breakouts.
As Dogecoin's structure stabilizes over the years, its price is showing signs of a significant turning point. With each price low trending higher, all eyes are on whether Dogecoin can break the key resistance level and surge towards the $1 mark by the end of the year.
Why has the bullish structure remained intact since 2023?
From 2021 to 2022, Dogecoin experienced extreme volatility and displayed a downward trend after peaking in 2021. By 2023, the market consolidated, forming a rising support trend line that connects multiple higher lows. This trend line has repeatedly absorbed selling pressure, reflecting increased accumulation by institutional and retail investors during several pullbacks.
How should traders manage risk around $0.43?
Use rising support and previous swing lows to define risk. A conservative approach is to wait for a weekly close above $0.43 with volume confirmation before entering, setting stop-loss below the rising trend line or the most recent higher low. Position size should reflect volatility and macro risk events.
Can Dogecoin really reach $1 this year?
Reaching $1 is possible, but it depends on sustained momentum, confirmed weekly closes above $0.43, and support from the market environment. The Fibonacci extension to $1.08453 provides a technical roadmap, but timing depends on macro liquidity and demand.
What technical signals can confirm a true breakout?
A true breakout indicates a weekly close above the key resistance level ($0.43), expanded weekly volume, higher price action, and a successful retest of the breakout level without breaking the rising support trend line.
How should long-term investors view the current structure?
Long-term investors may interpret rising support and repeated higher lows as early signs of structural recovery, but they should consider volatility and set clear entry and stop-loss points in line with the trend line.
Key points
Rising support: Higher weekly lows indicate accumulation and a sustained bullish market structure.
Fibonacci targets: Immediate resistance at $0.43038; if momentum continues, the extended target is around $1.08453.
Breakout trigger: A weekly close above $0.43 with increased volume is the main confirmation for continued upward movement.

