Dogecoin's price is $0.2380, up 10.09% in the last 24 hours, with strong gains. Technical, on-chain, and derivatives data suggest a potential breakout.
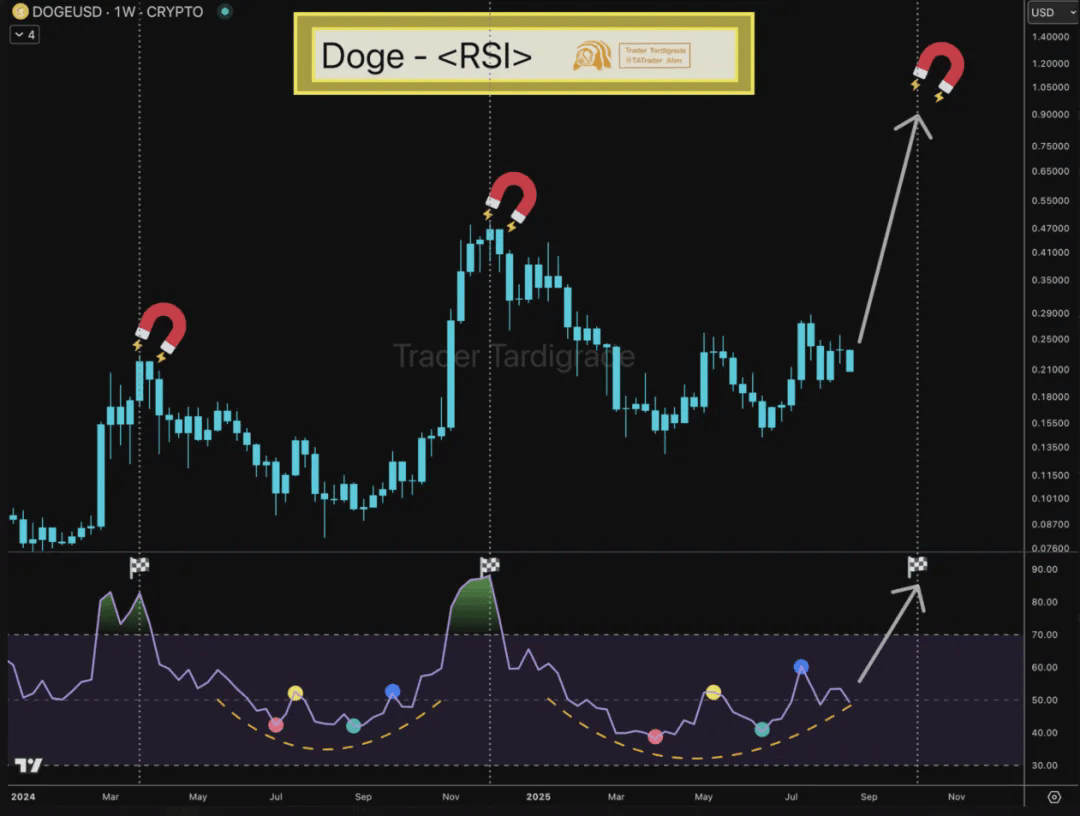
RSI Signal: Dogecoin is nearing a critical breakout point.
The Relative Strength Index (RSI) is forming a rounded bottom, climbing from the middle level. Historically, when the RSI enters the 80-90 range, Dogecoin's price often sees significant increases, and it is currently approaching this critical area. Predictions suggest that the next expansion phase price could rise to $0.75-$1.00, consistent with the historical pattern of RSI momentum driving price increases.
The monthly chart further shows that significant rebound often occurs after long-term consolidation, accompanied by increased trading activity.
The futures craze highlights directionality, while options speculation weakens.
Futures market data shows that the trading volume increased by 67.45% on the previous trading day, reaching $8.82 billion, with open interest rising by 10.10% to $3.55 billion, reflecting new capital inflow. In contrast, the options market exhibited a trading volume decline of 72.80% to $230.03 million, with open interest decreasing by 96.84% to $142.62 thousand, indicating weakened speculative interest. The rise in futures trading volume contrasts with the decline in options trading volume, showing enhanced directionality in the futures market, while speculative activity in the options market is limited.
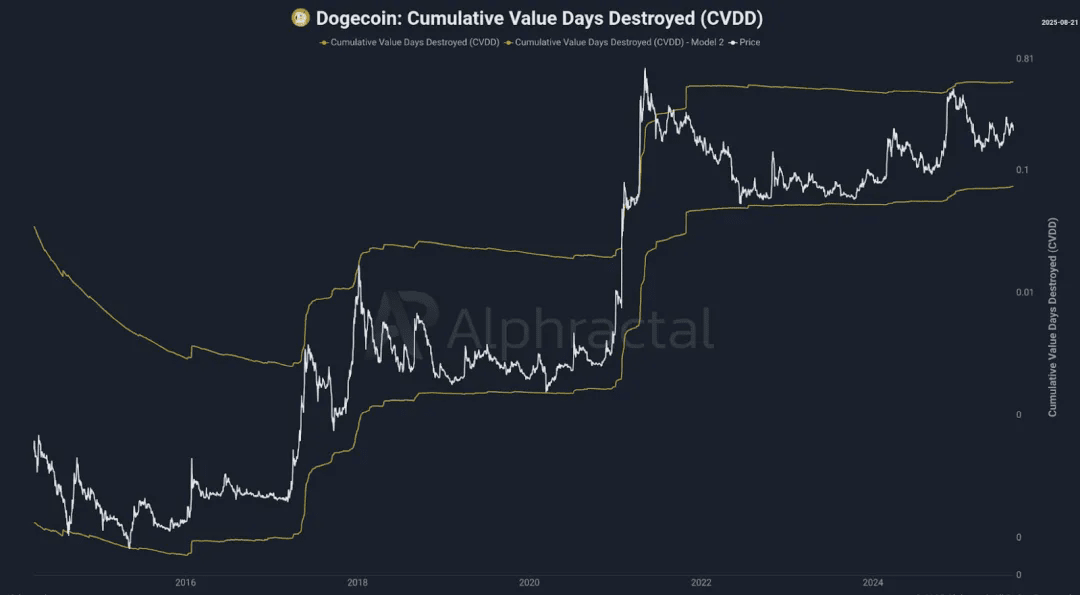
On-chain data is robust, showing an accumulation trend.
Dogecoin's hash rate continues to grow steadily, indicating miners' ongoing investment in the network, even during price fluctuations. The cumulative value destruction days (CVDD) model shows that the current price is within the historical cycle boundary range, with the lower boundary providing downward support, and the upper boundary corresponding to an overheating period, indicating that the current price is in the mid-cycle.
The Alpha price model shows that Dogecoin's price is below the model line. Historically, bullish periods often break through this line, suggesting potential upside. The network pressure index indicates that recent trading activity is relatively healthy, with stable active address numbers and low market sentiment, aligning with the accumulation trend.
