Falling Wedge pattern –
Pattern explanation:
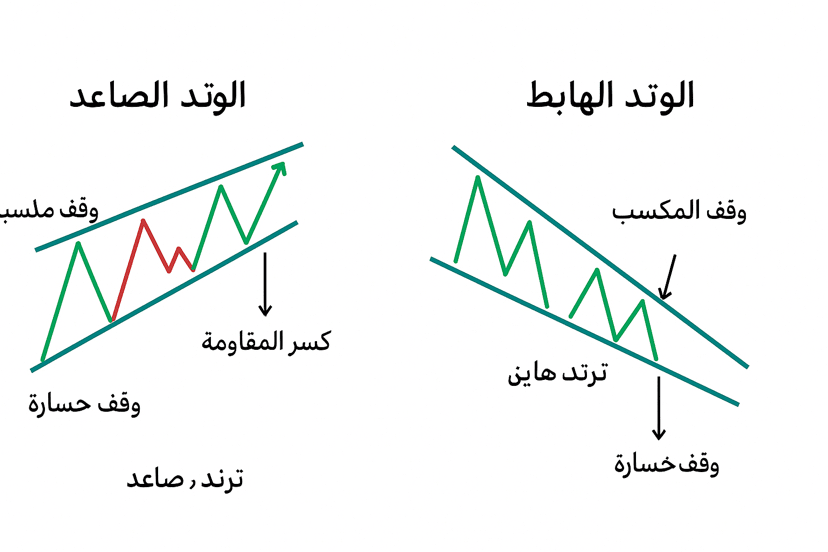
• The Falling Wedge is a price pattern that forms when the price moves within two converging lines (descending support and resistance).
• The upper line (resistance) tends to go down.
• The lower line (support) also tends to go down, but its slope is weaker.
• This makes the shape of the pattern look like a “narrow triangle” but directed downwards.
Its properties:
1. Previous trend: Usually appears after a descending trend.
2. Internal Behavior: The price oscillates up and down within the boundaries of the wedge (as in the drawn green and red stocks).
3. Reversal Signal: When breaking the upper resistance line (breaking upwards) → considered a strong bullish signal.
4. Price Target: Often measured by the widest part of the wedge and added to the breakout point.
5. Stop Loss: Below the last low within the pattern (as shown “Stop Loss”).
Notes on the chart:
• Written: “Break of Resistance” = Entry Point for Buying.
• “Take Profit” = target.
• “Stop Loss” = below the pattern.
• The large arrow at the bottom “Downward Trend” indicates that the pattern came after a decline.
🔑 Summary:
The Falling Wedge is often a bullish reversal pattern, meaning an increase is expected after it despite its descending shape.
Ascending Wedge:
Definition:
The ascending wedge is a price pattern that forms when the price moves within two converging ascending lines:
• The upper line = Resistance.
• The lower line = Support.
Since the two lines are ascending but coming closer to each other, the price is confined between them until a breakout occurs.
⸻
Properties of the ascending wedge:
1. Previous trend: Often forms after an ascending trend.
2. Behavior within the pattern: The price moves in ascending peaks and troughs, but weak and converging.
3. Decisive Point: Usually, the breakout occurs downwards (breaking support), giving a bearish signal.
4. Price Target: Measured by the distance between the widest part of the wedge and subtracted from the breakout point.
5. Stop Loss: Above the last peak within the pattern (or above the resistance line).
⸻
Significance:
• In an upward trend: Considered a bearish reversal pattern (warning of the end of the rise and the beginning of the decline).
• In a downward trend: It may appear as a continuation of the decline after an upward correction.
⸻
🔑 Summary:
The ascending wedge = a negative pattern in most cases, indicating a likelihood of price decline after breaking the lower support line.
Quick comparison between the ascending and descending wedge:
📌 Ascending Wedge
Shape: Ascending and converging support and resistance lines.
Previous trend: Often ascending.
Expected breakout: Downwards (breaking support).
Signal: A bearish reversal pattern.
Meaning: Weakness in the ascent and a potential start of a decline.
📌 Falling Wedge
Shape: Descending and converging support and resistance lines.
Previous trend: Often descending.
Expected breakout: Upwards (breaking resistance).
Signal: A bullish reversal pattern.
Meaning: Weakness in the descent and a potential start of an ascent.
🔑 Summary:
The ascending wedge = negative (bearish).
The Falling Wedge = positive (bullish).
Here’s a clear educational example—the image above shows both the ascending and descending wedge patterns in a chart (for either gold or Bitcoin), with breakout points indicated:
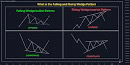
The upper part represents the Ascending Wedge: Two ascending lines converge, often forming after an upward wave, and gives signals for a downward breakout.
The lower part represents the Falling Wedge: Two descending lines converge, often appearing after a downward wave, and gives signals for an upward breakout.
Real examples:
1.Bitcoin: Real Falling Wedge pattern
According to a recent report, Bitcoin moved within a descending wedge for four months, then successfully broke above the wedge resistance and closed above the 200-day moving average, giving a strong bullish signal.
The price target was divided by measuring the width of the wedge and adding it to the breakout point, indicating a potential reach to higher levels like $107,000.
2.Gold: Appearance of a bearish Rising Wedge pattern
In the gold chart, an ascending wedge appeared during an upward trend and acted as a warning of the end of the rise. After the pattern completed, the price quickly declined, demonstrating the effectiveness of this pattern in predicting reversals.
Summary of comparison in a practical verbal context:
Descending Wedge pattern:
Appeared in Bitcoin.
The price formed within two intersecting descending ranges.
The breakout occurred upwards, signaling the start of an increase.
Strong upward signal and a clear strategy for the target (measuring the width of the pattern).
Real example: Breaking the 200-day moving average and aiming for a target value of $107,000.
Ascending Wedge pattern:
Appeared in gold.
The price broke the pattern upwards, but the breakout came downwards.
Strong reversal signal and a warning of the end of the upward trend.
Real example: A pattern appeared at a peak and translated into a rapid price decline.
Summary:
The Falling Wedge pattern in Bitcoin is a great practical example of a bullish reversal, with a calculated price target and a strong base.
The Ascending Wedge pattern in gold indeed proves to be a bearish reversal pattern; everyone bought it thinking it was a continuation, but it quickly collapsed.

