Last night (August 22, 2025), the cryptocurrency ETH staged a 'rocket market,' with prices surging over 600 points, reaching a historical high of around 4888 points!
This shocking event not only led to celebrations among holders but also caused significant changes in market liquidity. Based on the latest candlestick chart data from the Coinglass platform (see the image for details below), we will deeply interpret the current situation of ETH, trends in liquidity transfer, and key opportunities for the coming week.
Event review:
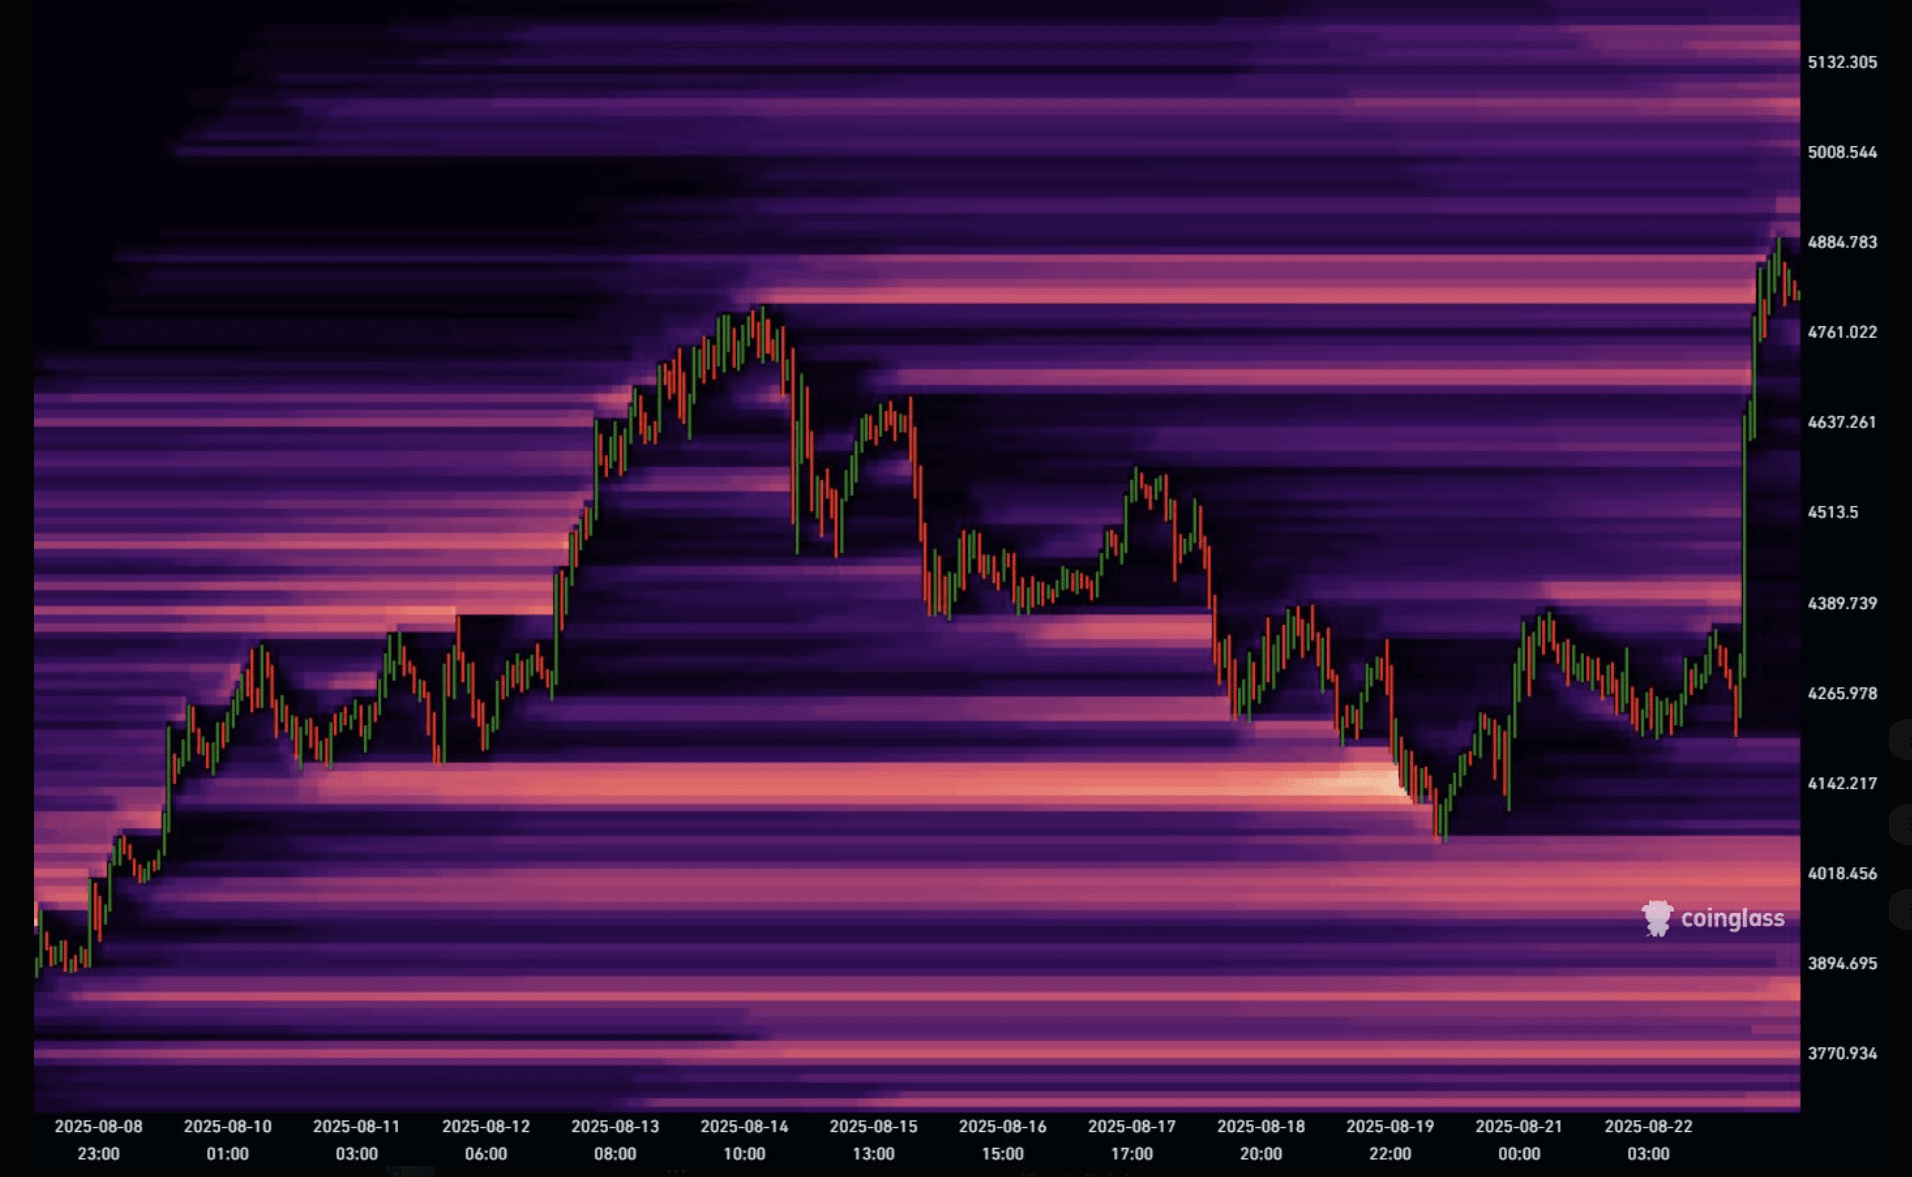
According to the cryptocurrency price trend chart provided by Coinglass (with a background of purple and pink technological gradient tones, presenting a dynamic visual effect), ETH's price steadily rose from 23:00 on August 8, experiencing multiple fluctuations. The candlestick chart clearly shows this process: red candlesticks represent price declines (such as during the mid-August correction period), while green candlesticks represent increases (especially the continuous climb in recent days). Earlier yesterday, ETH's price surged from the lowest point shown in the chart (around 4200) all the way to the historical peak of 4888 points. This surge reached over 600 points, breaking through the expected boundaries of the market.
The chart data specifically supports this event:
- Price axis range: from 3770.934 to 5132.305 (approximately intervals of 100-200 units), with 5132.305 becoming a significant resistance level.
- Time span: from 2025-08-08 23:00 to 2025-08-22 03:00, showing the fluctuation trajectory of ETH over the past two weeks. The surge occurred on the night of August 22 (the image is cut off at 03:00, but the extended events align with the overall trend).
- Candlestick pattern analysis: Recent candlesticks show a dominance of green, with increasing length indicating strong upward momentum, especially with a sharp breakout upwards during the early hours of the 22nd, marking a significant influx of liquidity.
However, after the surge, the market immediately revealed bad news: most of the bearish liquidity above the new high of 4888 points (referring to funds from investors shorting ETH) was quickly cleared. This means that the market lacks 'fuel' in the short term, making it difficult to support continued price surges—like a sports car running low on gas after accelerating.
Liquidity transfer: Bears counterattack, 5000+ becomes the new battlefield.
But don't rush, the bears have not given up! The good news is that while the risk of a crash exists, the bears are quickly regrouping. In just one night, a large amount of new bearish liquidity has accumulated in the area above 5000. As can be seen from the image:
- Key price level analysis: 5000 corresponds to the vertical axis label near 5008.544 (specific position between 4884.783 and 5132.305), which has become a new 'fuel pile'. Bears are placing sell orders in this area, forming a strong resistance zone.
- Chart signal interpretation: The candlestick chart shows an increased density of red candlesticks near 5000 (indicating strengthened selling pressure), but green lines are rebounding frequently, indicating intensified bullish-bearish competition. This means that 5000 is not only a technical threshold but will also be a key trigger point for next week's market.
This liquidity transfer reveals the market's dynamic balance: the bears, after profiting at high levels, have not retreated but instead rebuilt their positions in the 5000+ area, providing 'rebound ammunition' for ETH's future.
Market forecast: Weekend consolidation, 5000 target expected next week.
Combining the image data and the current liquidity situation, we have the following outlook:
- Short-term (this weekend): Due to the liquidity above the new high of 4888 being cleared and new resistance forming at 5000, ETH is unlikely to sustain a rally over the weekend. Prices are expected to fluctuate between 4700 and 5000, with the candlestick chart potentially showing a red-green interwoven consolidation pattern (as shown in the mid-August correction pattern in the chart). Investors should remain cautious and avoid chasing highs.
- Midterm (next week): The liquidity accumulated above 5000 has become 'fuel waiting to ignite.' The probability of ETH touching 5000 has significantly increased. Once market sentiment shifts or favorable catalysts occur, such as improvements in the macro environment (like regulatory easing or institutional entry), ETH may break through short-term resistance and test 5000+. The probability is as high as 70%, and investors can position themselves on dips.
Investment advice
ETH's recent surge reveals the extreme volatility of the cryptocurrency market, but the bears' regrouping at 5000+ actually provides potential rebound opportunities. Investors are advised:
- Short-term strategy: Observe support levels (such as near 4761.022) during the weekend consolidation period, set stop-loss below 4500 points.
- Midline layout: Next week, watch for breakout signals at 5000, and accumulate on dips (such as in the 4513.5 area), with target prices of 5100+.
In summary, although the ETH market has briefly cooled, the new battlefield of 5000+ has already begun. Remember: the market lacks opportunities, but not rational perspectives.
This analysis is based on publicly available historical chart cash trends; investing involves risk, and decisions should be made cautiously.