Charge charge charge, take a look at this coin!
1. Why does traditional on-chain data look like a high school exam paper?
When you open Etherscan or Solscan and see a bunch of addresses, timestamps, transaction amounts... it’s incredibly painful. The vast majority of people get a headache just looking at that stuff—on-chain transparency is real, but understanding it isn't that clear. This is where Bubblemaps comes in: it allows you to 'interpret on-chain relationships with your eyes', analyzing token distribution and wallet relationships without needing to 'manually compare spreadsheets'.
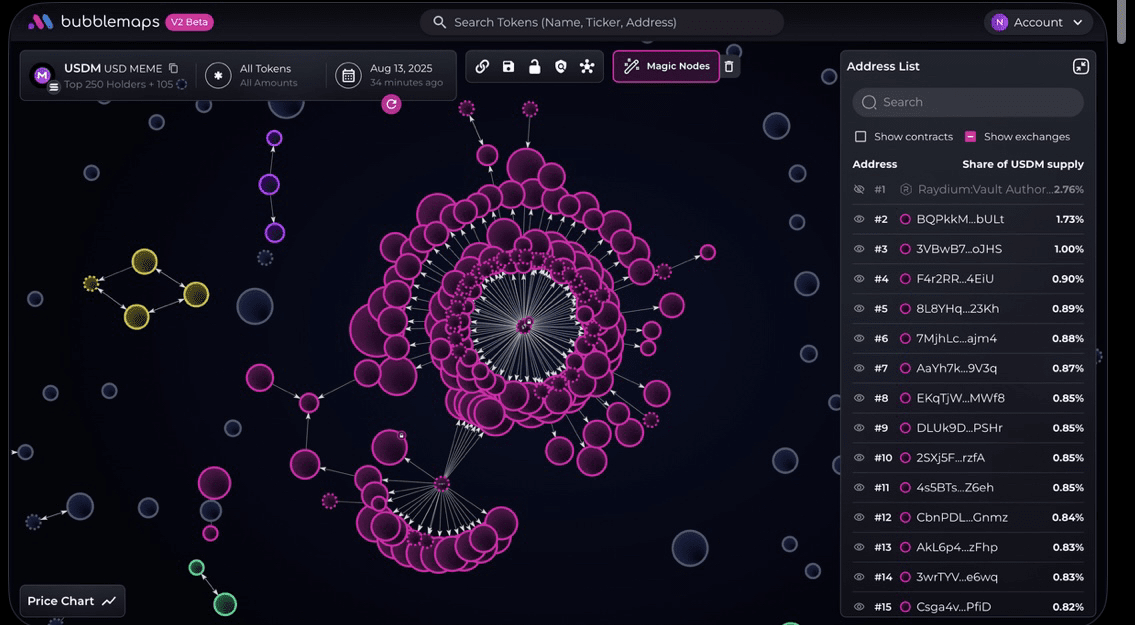
2. The core logic of Bubblemaps: One 'bubble' corresponds to one wallet, the size indicates holdings, and the lines represent transaction relationships.
This platform visualizes wallets as colorful bubbles: the larger the bubble, the more tokens the wallet holds; the lines between bubbles represent past token transfers. This graphical method lets you easily see which wallets are large holders, which wallets are transferring to each other, and even gain insights into whether 'insiders' are coordinating.
3. Practical Functions: Magic Nodes, Time Travel, and the ability of 'Historical Travel'
Bubblemaps is not just a static chart; it also has many practical functions:
Magic Nodes: Helps you reveal hidden wallet groups and visibly show related wallets behind them.
Time Travel: Allows you to look back at the holding distribution at a certain point in time, to understand whether that wave of market activity was driven up or down by certain wallets.
These tools provide intuitive help in analyzing whether new coins are 'manipulated', or if early large holders are secretly concentrating their tokens.
4. Supporting multiple chains and integrated with mainstream platforms, usable everywhere.
Bubblemaps has already supported a number of mainstream EVM chains, as well as hot chains like Solana, Base, Sonic, etc.; it has also been integrated into platforms like Etherscan, DEXScreener, CoinGecko, Pump.fun, etc., allowing you to see its visual map with just a click, making it a 'mobile on-chain reconnaissance navigation'.
5. 'Intel Desk' is here—both you and I can vote to investigate suspicious projects.
The latest highlight is: Bubblemaps has launched Intel Desk, allowing the community to uncover shady projects together. Users can propose 'investigating this scam coin model', the community votes on topics using BMT, and the Bubblemaps team actually verifies the findings. This process is not only transparent but also gives the community a greater sense of participation.
6. How to play with BMT tokens? Not only can they be used, but also participate in governance and advanced analysis.
Bubblemaps' native token BMT, with a total supply of 1 billion, is the 'key' to unlocking advanced features and participating in voting investigations. Such as unlocking AI clustering, P&L (Profit and Loss) calculations, cross-chain maps, advanced time travel, and more.
Summary of this article
Bubblemaps transforms the 'dense data' on-chain that ordinary users can’t understand into 'picture stories', allowing you to easily identify whales, trading teams, and insiders, and also participate in community investigations on exchanges and suspicious projects. With it, DYOR (Do Your Own Research) is no longer about writing long spreadsheets but about looking at bubbles, intuitive and exciting.
@Bubblemaps.io #Bubblemaps $BMT