Chainlink ($LINK ) continues its upward push and is now approaching the next key resistance at $31. While the broader structure remains bullish, the short-term chart still looks somewhat fragile, especially around the $23 support zone.
🔑 Key Takeaways
Trend: Still upward, with higher prices favored in the larger Elliott Wave structure.
Immediate Resistance: $31 is the next major level to watch.
Fibonacci Target: $47 remains an ideal projection for this ongoing C-wave.
Support Zone: $22.30 – $23.75 is critical for maintaining the bullish outlook.
Short-Term Fragility: Pullbacks are possible, but they don’t necessarily change the bigger bullish picture.
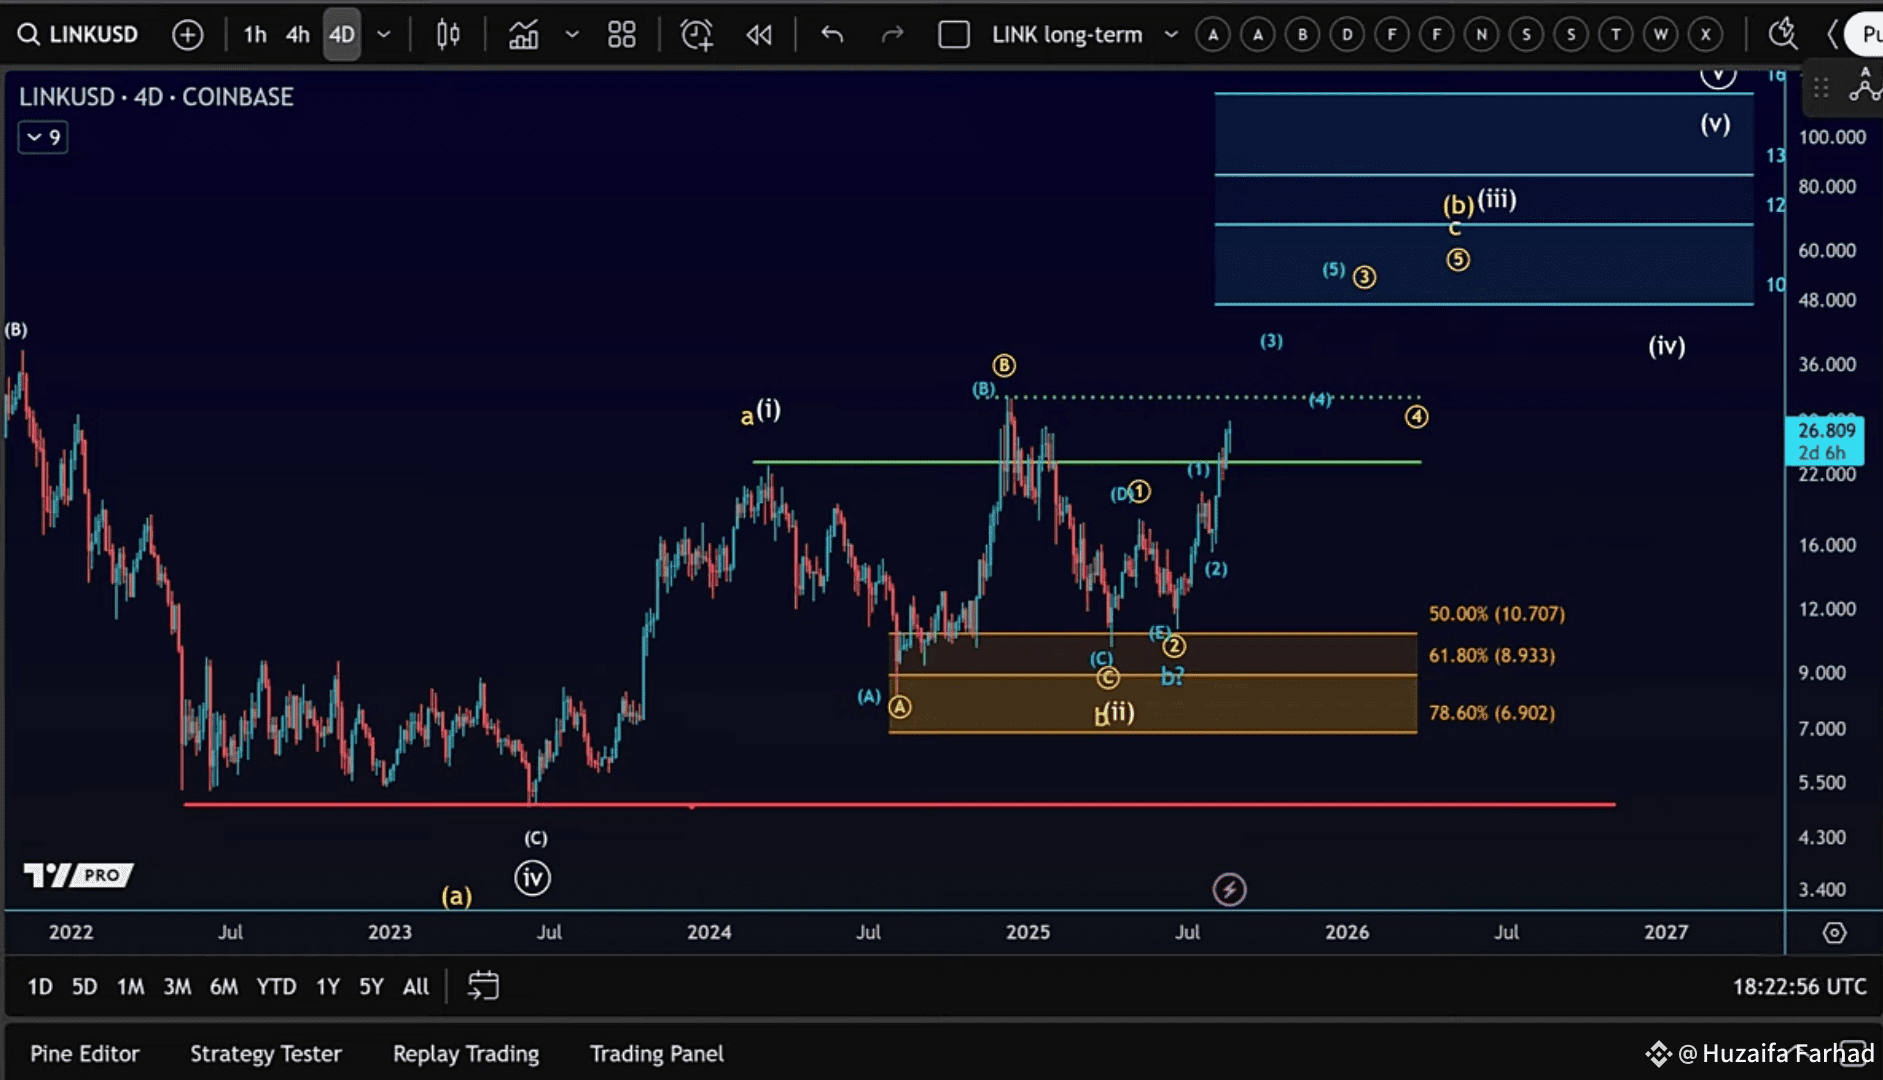
📈 Elliott Wave Perspective
Over the past year, LINK formed a five-wave move up from its 2023 low—a classical Elliott Wave pattern. The corrective phase that followed brought the price into strong support, and from there, the next leg higher began.
👉 Many traders make the mistake of over-focusing on short-term charts (15min, 30min). While these can break support/resistance levels, it doesn’t always signal a trend reversal. The larger context remains bullish as long as LINK holds above the $22 support region.
🎯 Price Levels to Watch
Short-Term Resistance (Fibonacci zone): $27.67 – $30.20
Major Resistance: $31 (next key hurdle)
Extended Target: $47 (Fibonacci extension based on Wave A = Wave C)
Critical Support: $22.30 – $23.75
