

The Pi Network has lost nearly 60% in the last year and about 5% in the last week. Normally, its price continues to drop day after day, often reaching new lows. Today was different.
The PI token remained stable, close to $0.36. For Pi Coin, which usually declines, simply remaining stable is unusual. A short-term bullish crossover prevented a further drop, but deeper trends may be more relevant.
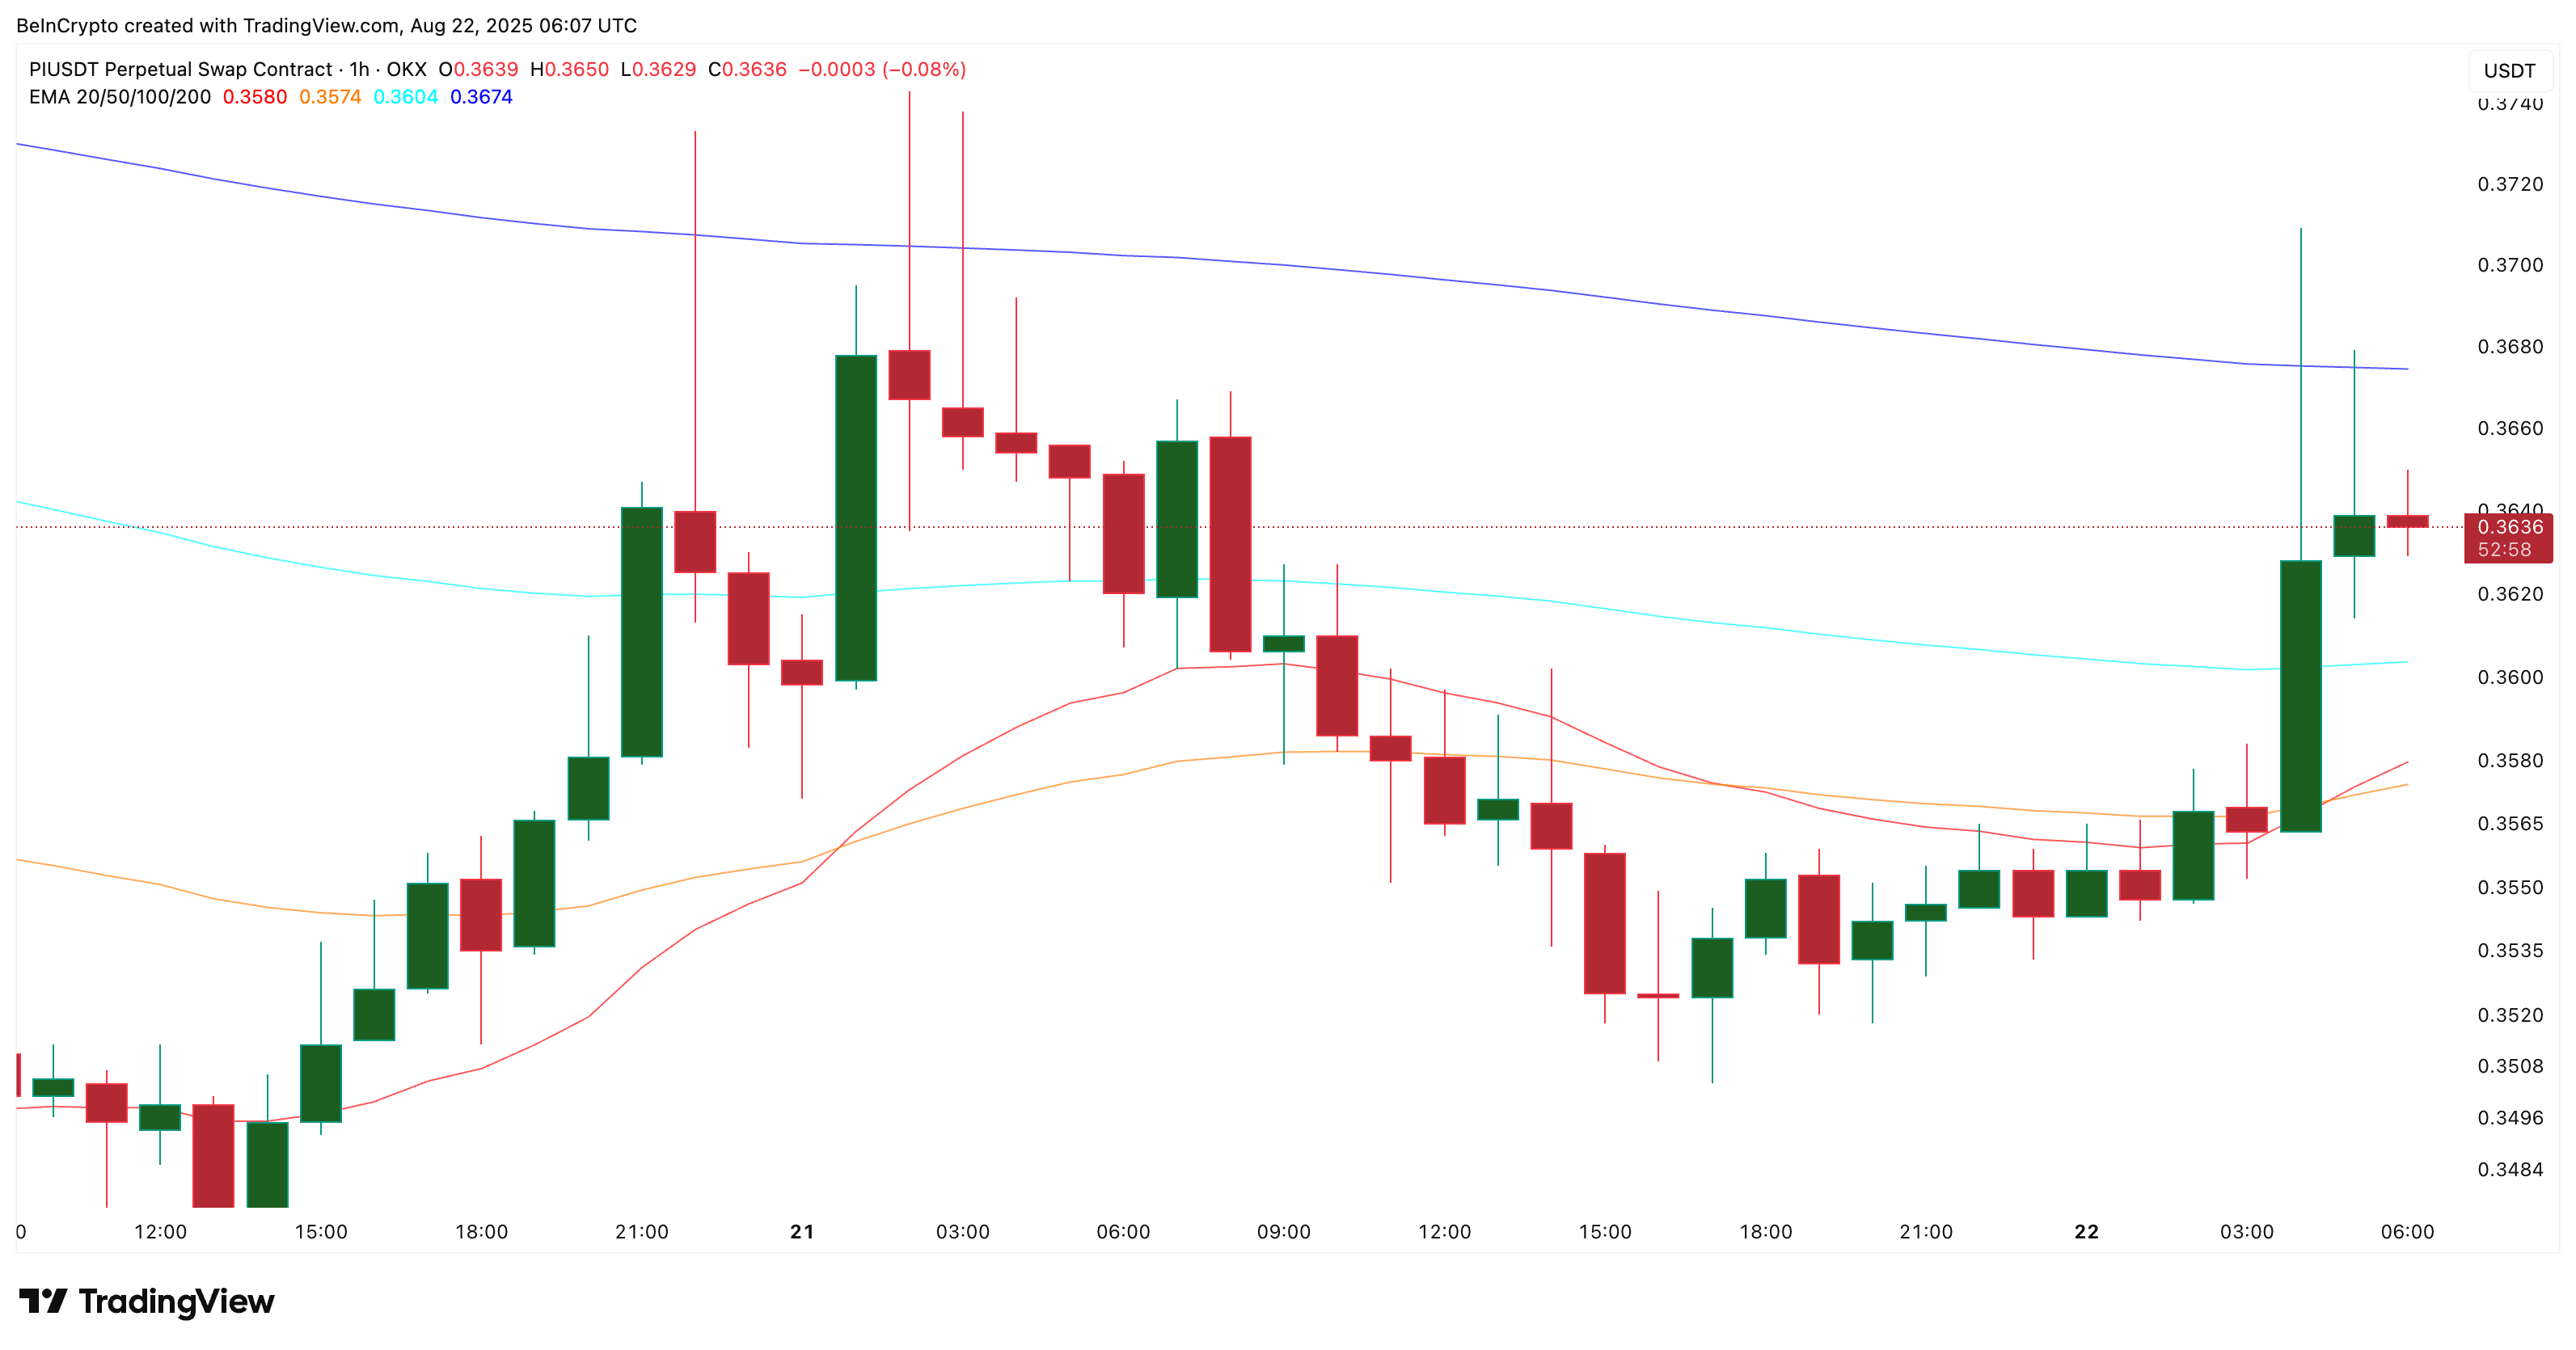
1-hour crossover offers short-term relief
On the 1-hour chart, PI showed a bullish crossover when the 20-period exponential moving average (EMA) crossed above the 50-period EMA. This raised the price to about $0.37, helping to maintain the position in the last session.
 Pi Coin price chart (hourly time frame): TradingView
An exponential moving average (EMA) tracks price by giving more weight to recent movements. A bullish crossover occurs when a shorter EMA rises above a longer EMA, often seen as an early sign of buyer strength.
This is not unprecedented. On August 20, a similar crossover lifted PI from $0.35 to $0.37. The increase was short-lived. Prices fell shortly after. The pattern shows that short-term crossovers can generate spikes but did not change the larger trend for Pi Coin.
Therefore, today's movement, while useful, may not be sufficient by itself. For a clearer view, we need to analyze more deeply.
Longer-term chart shows bullish divergence
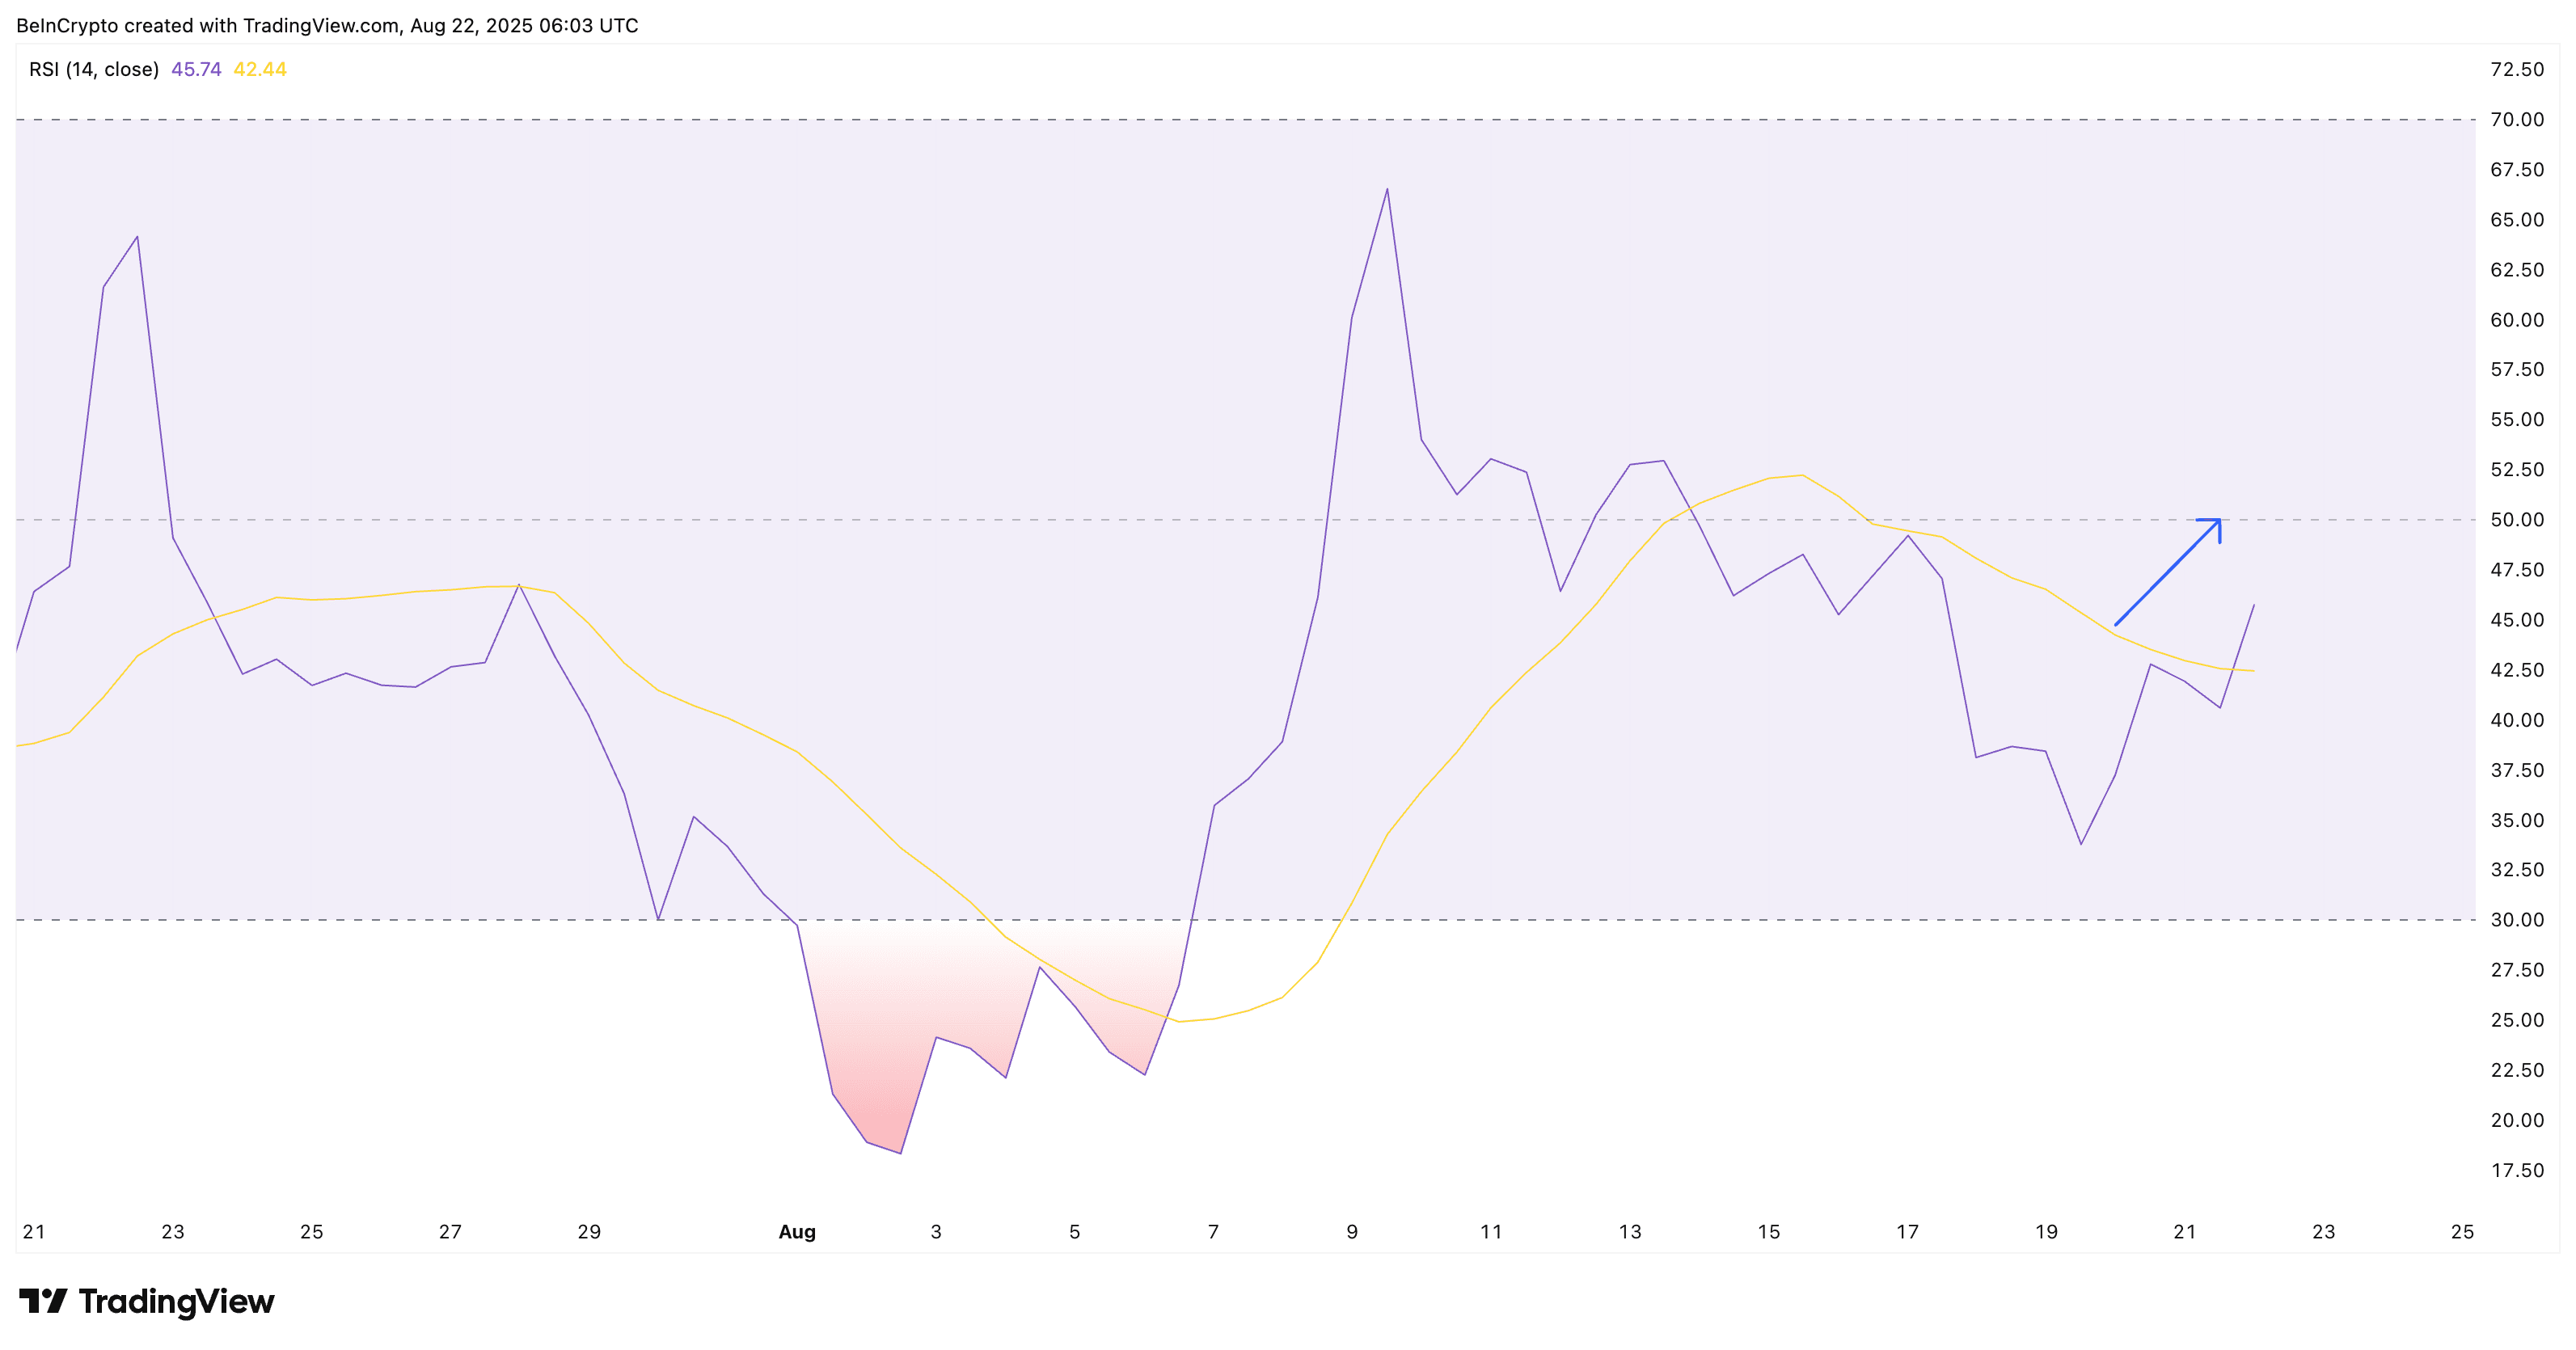
The 12-hour Pi Coin price chart reveals a deeper trend. On August 20, PI reached $0.3739, and on August 22, it hit $0.3712. These are lower peaks in price.
 Pi Coin buyers may finally be resisting selling pressure: TradingView
During the same period, the RSI made higher peaks. This is called bullish divergence, meaning that sellers pushed prices down, but buyers gained strength discreetly.
For Pi Coin, this is unusual. The token spent much of the year reaching new lows. The divergence over a slightly longer time frame shows that buyers may finally be resisting the pressure. And this trend means that the previously mentioned 1-hour crossover may carry more weight now.
The Relative Strength Index (RSI) measures momentum on a scale of 0 to 100. A bullish divergence occurs when the price makes lower peaks, but the RSI makes higher peaks, suggesting that buyers are gaining ground discreetly.
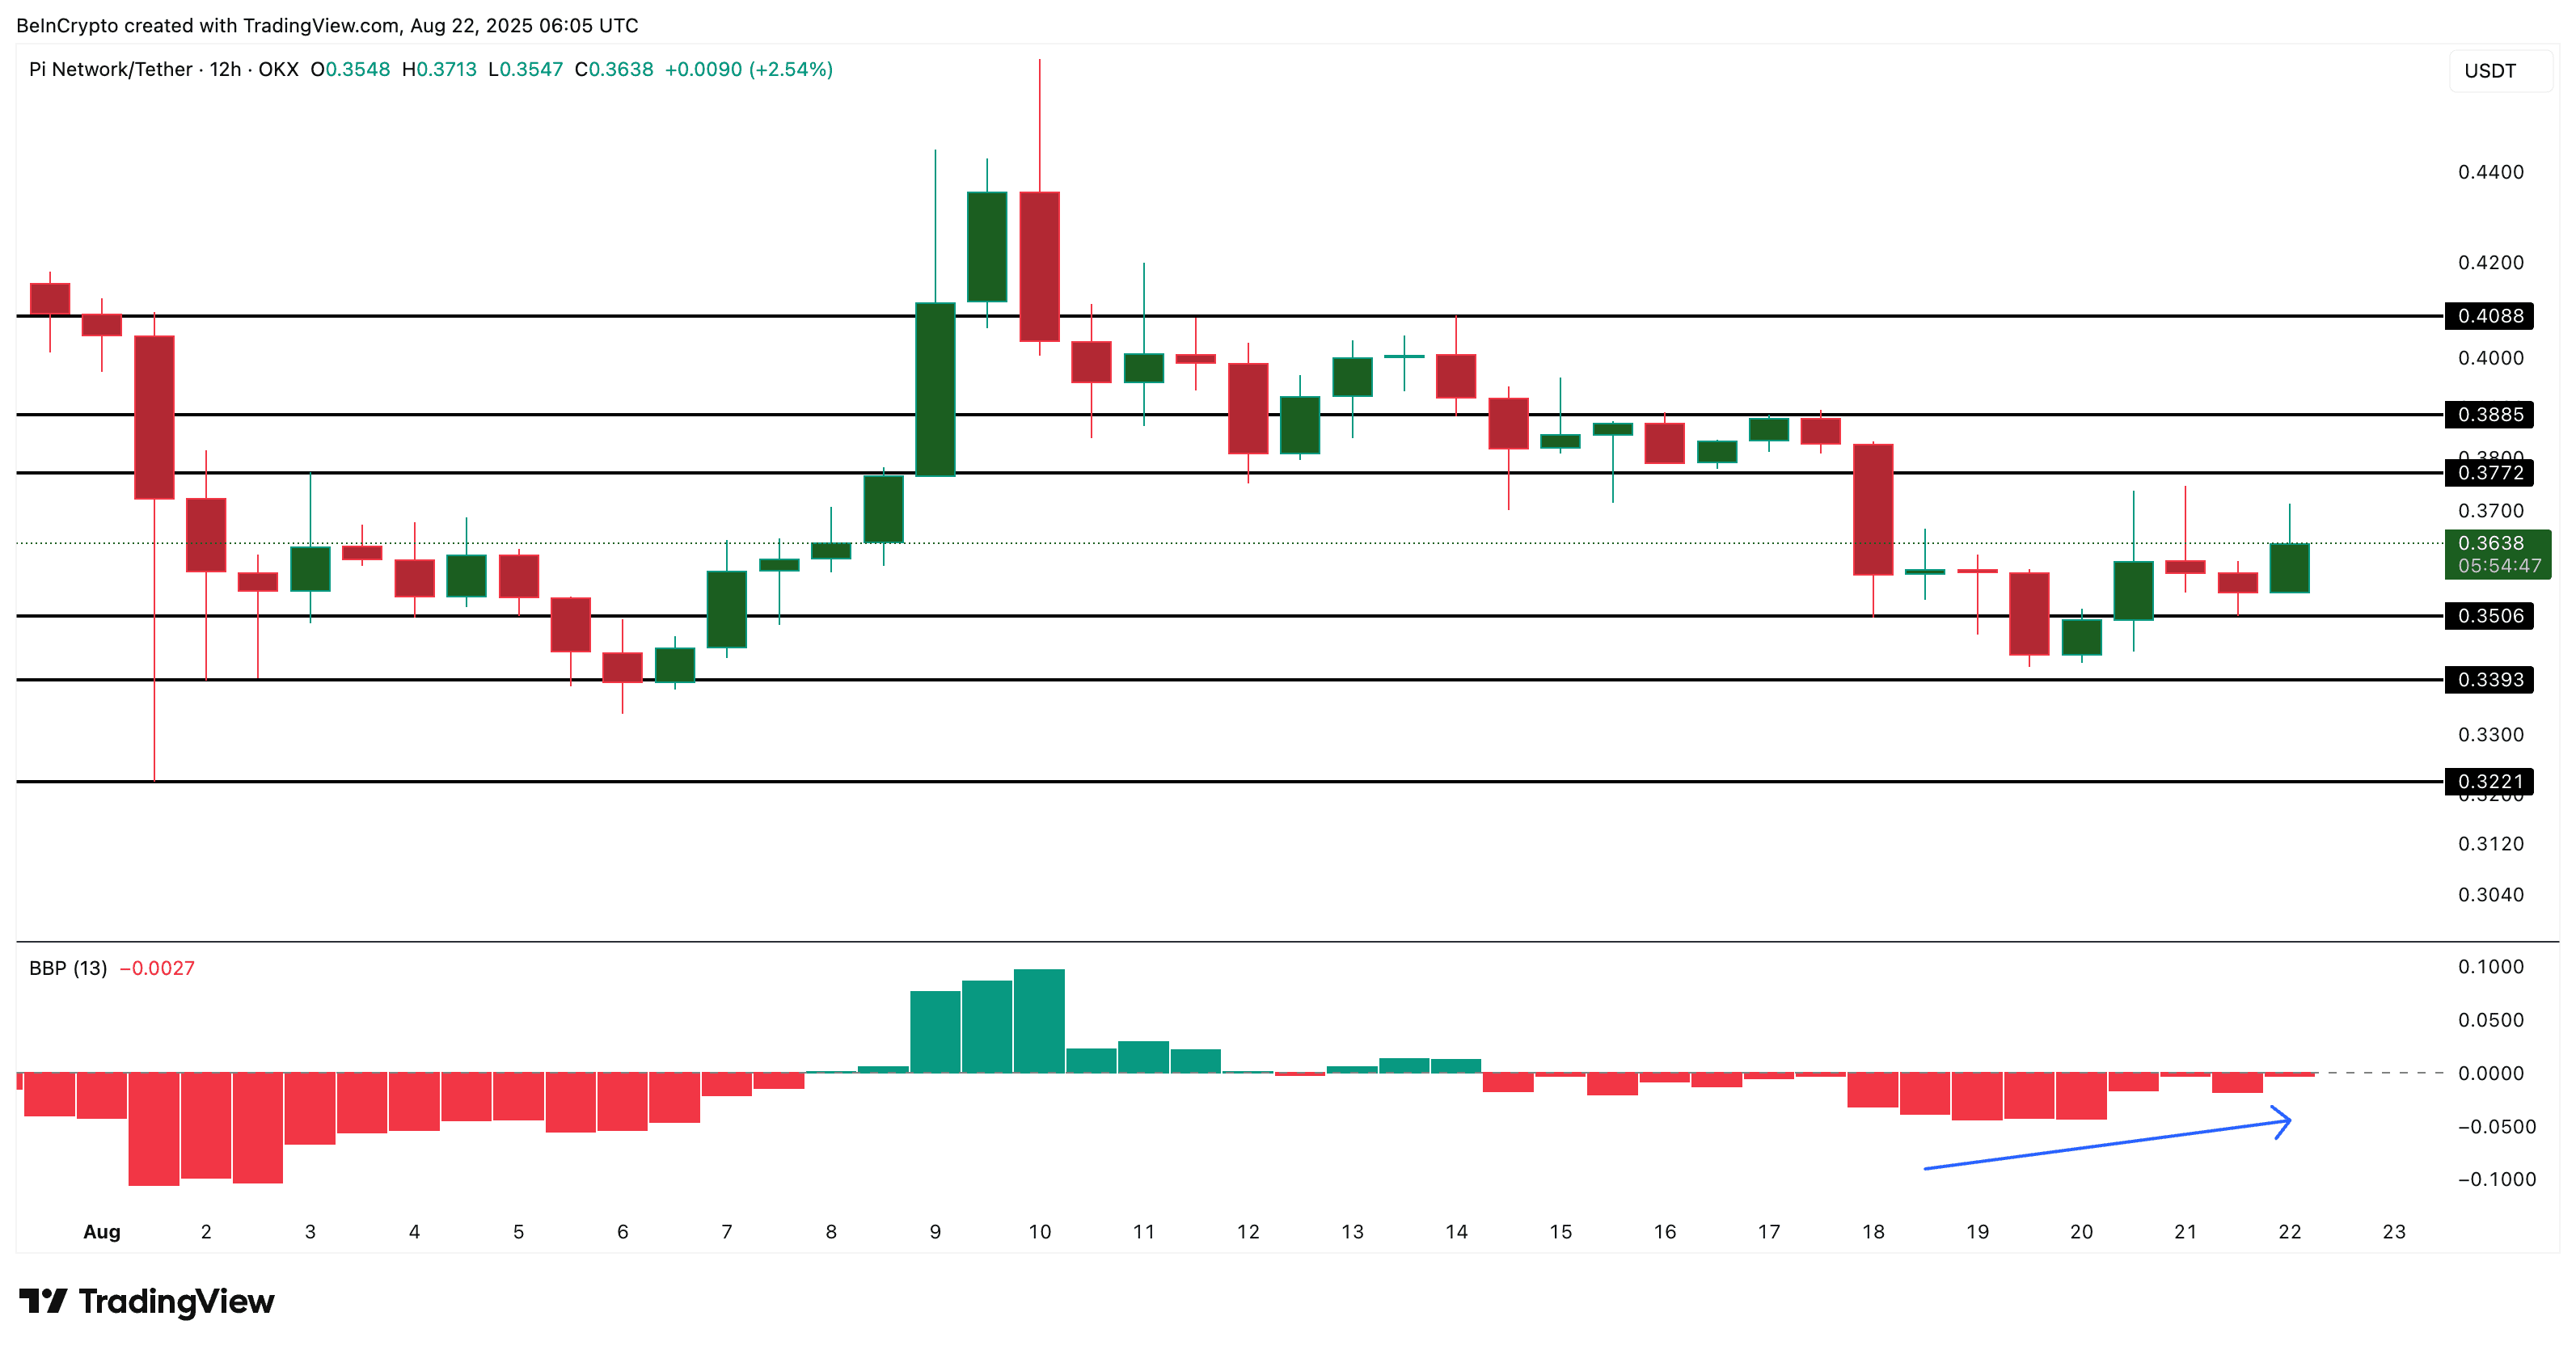
Key price levels of Pi Coin to watch
For the bullish scenario to hold, PI must overcome $0.37 and then $0.38 on the 12-hour chart. The strongest confirmation is at $0.40. A breakout above this level would show real strength, beyond short-term crossovers.
 Pi Coin price analysis: TradingView
The bullish and bearish pattern adds to the optimistic view. The bearish momentum weakened after August 20. Sellers tried to extend losses, but pressure eased on August 21 and 22. At the same time, sentiment improved with the launch of the PI/USDC pair on OKX, which gave buyers a reason to act.
If the price drops again below $0.33, the setup weakens. Invalidating below this level would likely lead to new lows, something that Pi Coin has already shown before.
The article Bullish Crossover Supports Pi Network, But Trends Weigh was first seen on BeInCrypto Brazil.
