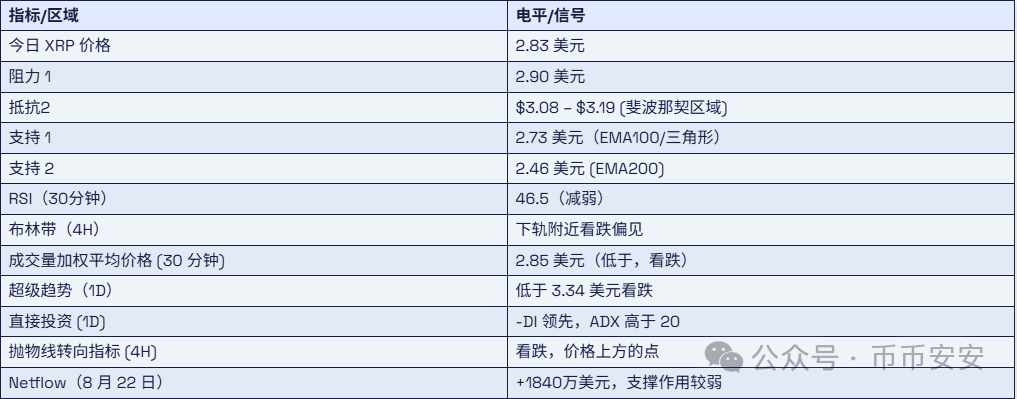
XRP's price today hovers around $2.83, having retreated from a high of around $3.60 in early August. The pair has been consolidating within a downward structure and has repeatedly retraced from lower highs, indicating that its upward momentum is waning. On the daily chart, XRP remains above the 200-day moving average (EMA) ($2.46), but selling pressure is increasing as sellers test the $2.73 support level.
XRP Price Prediction
XRP Price
Since rebounding to around $3.60 in July, XRP has been trading within a tightening symmetrical triangle. Currently, the price is approaching the lower boundary of this formation, which coincides with the 100-day moving average ($2.73). A breakdown below this level may lead to a larger retracement towards the $2.46 area where the 200-day moving average is located.
The daily chart of XRP highlights a series of equal highs (EQH) that appeared near $3.60, followed by a downward reversal (CHoCH). This turning point marks the end of impulsive bullish control. Subsequently, multiple BOS events occurred, confirming that smart money has been shifting positions to retail demand zones.
Recently, BOS has been oscillating in the $2.90 to $2.95 range, pushing the price back to the lower boundary of the current triangle structure. Below, the strong low from July is around $2.20, suggesting that if $2.73 fails to hold, a liquidity pool could form. On the upside, buyers must break through the $3.08 to $3.19 area, where blocks previously turned from BOS to supply are still accumulating.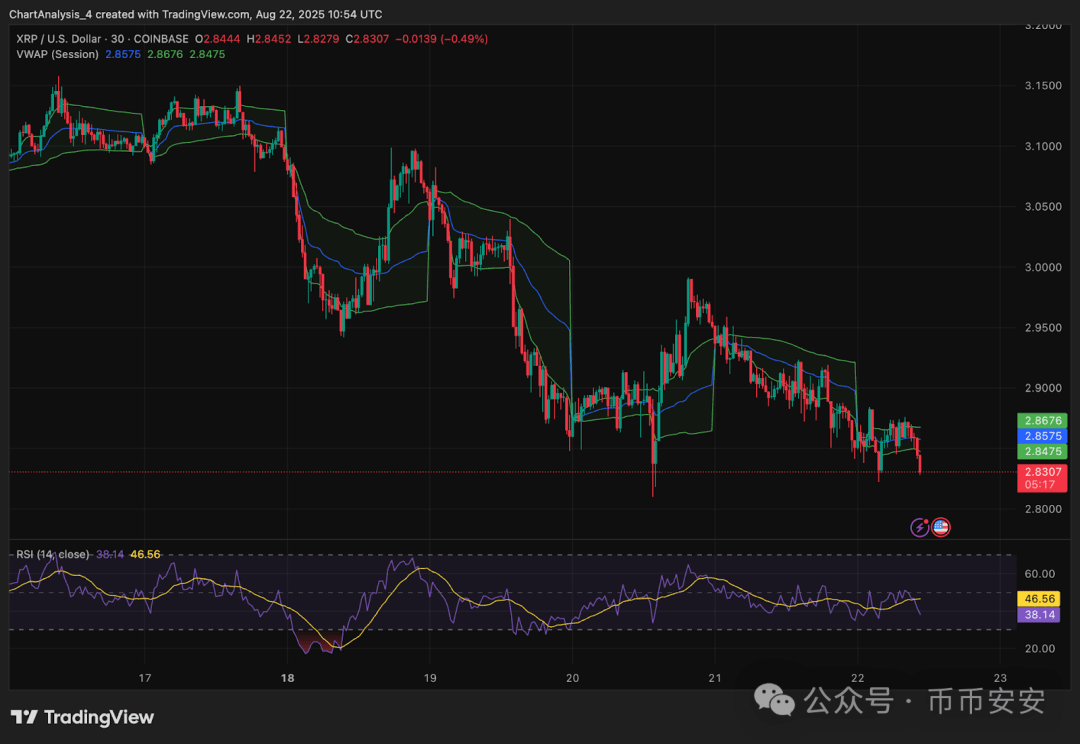
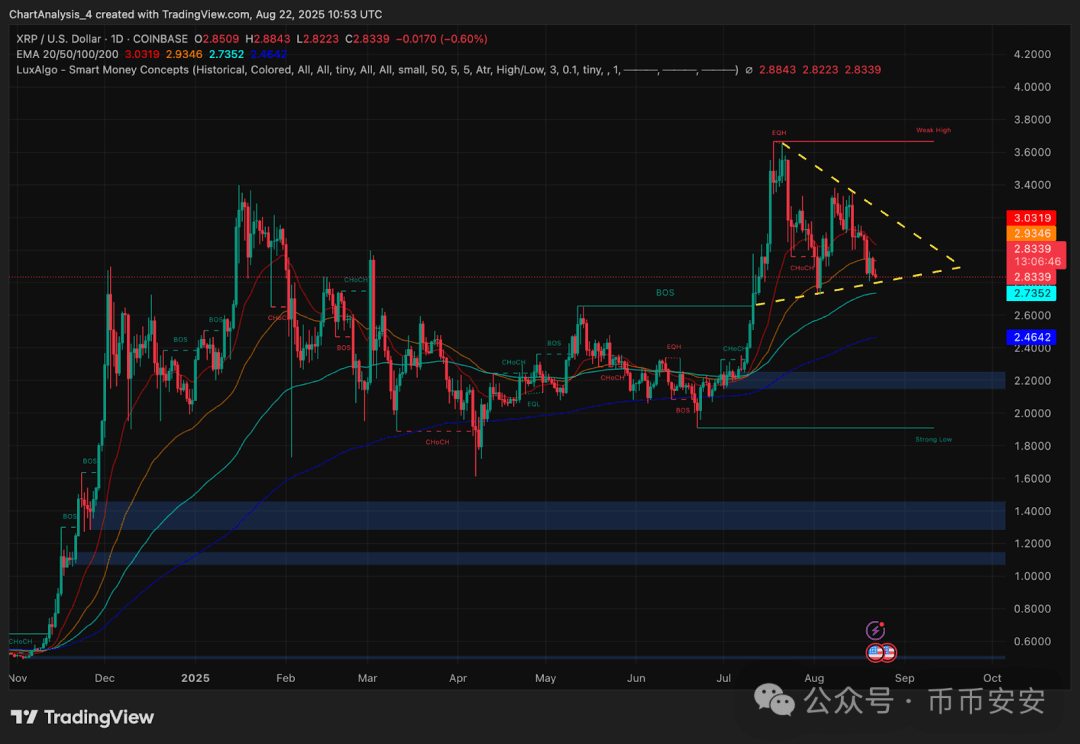
Momentum indicators also reflect this weakening trend. The 4-hour Bollinger Bands are contracting, with the candlestick chart tilting near the lower band around $2.79, indicating bearish imbalance. On the 30-minute chart, XRP is trading below its volume-weighted average price (VWAP) benchmark of $2.85, suggesting significant selling pressure in the intraday market. The RSI has dropped to 46, confirming that demand is weakening after repeatedly breaking the $3.00 level.
Why did XRP's price drop today?
The root cause of XRP's price decline today lies in the failed recovery and new supply pressure. The Fibonacci retracement levels on the 4-hour chart highlight persistent resistance between $3.08 (0.382 Fibonacci) and $3.19 (0.5 Fibonacci).
The price action struggles to break through these areas, making the bulls appear vulnerable under multiple resistances. The parabolic SAR indicator on the 4-hour chart has been positioned above the price since mid-August, indicating persistent bearish control.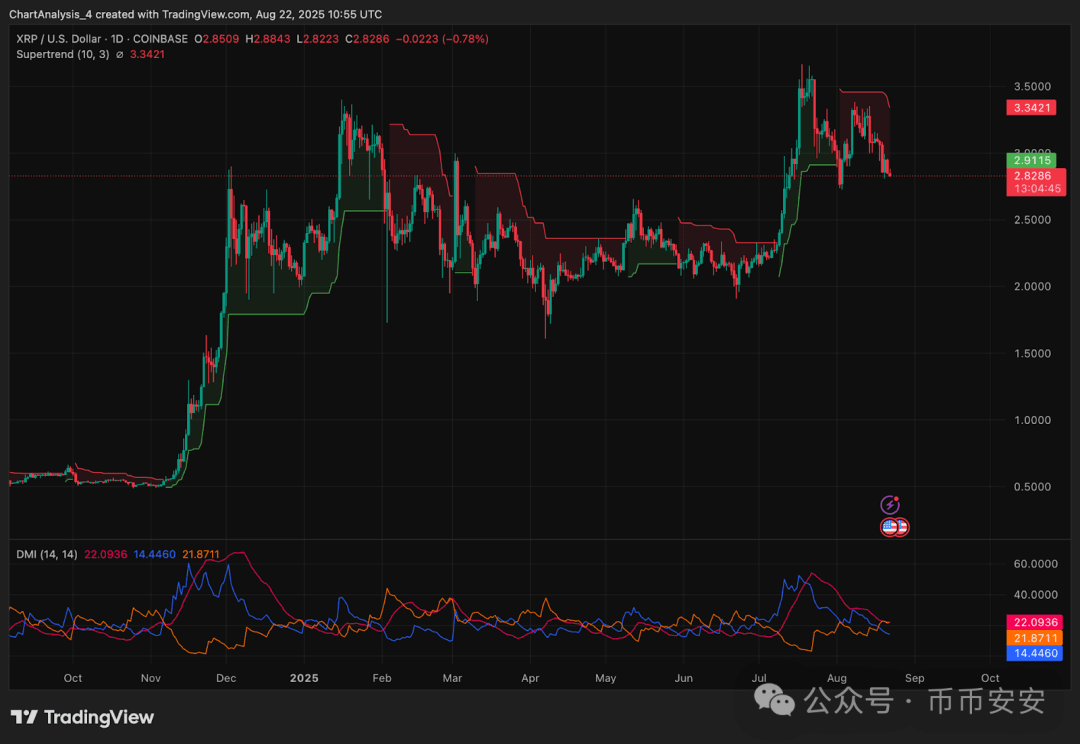
The super trend signal on the daily chart remains bearish, reversing above $3.34, as long as XRP's trading price stays below $3.00, maintaining a downward trend. DMI readings show that the negative directional movement (-DI) is leading, while ADX remains above 20, confirming a controlled bearish trend environment, which supports this view.
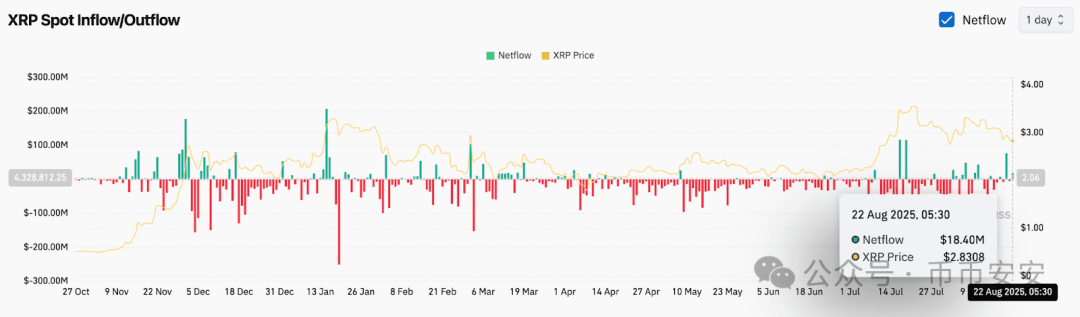
On-chain funding flow data further corroborates this weakening trend. Despite a net inflow of only $18.4 million for XRP on August 22, its trading price continues to decline, indicating that the inflow is insufficient to offset broader selling pressure.
XRP Price Short-Term Outlook
The current battleground is between $2.73 and $2.90. If XRP closes below $2.73 with volume confirmation, the next support levels are at $2.64 and $2.46. This could potentially invalidate the symmetrical triangle support and open the path to deeper liquidity areas around $2.20.
On the positive side, reclaiming $2.90 and $3.00 is crucial for the bulls. A decisive breakout of the Fibonacci sequence from $3.08 to $3.19 could potentially re-target $3.30 (0.618 Fibonacci), and even possibly dip to $3.46. Until then, the trend leans towards cautious bearishness.

