The 4-hour chart highlights a key short-term level that may provide clues for a Solana rebound.
Solana [SOL] is slowly rising on the price chart. Bulls have successfully reclaimed the $180 area as a support level. Combined with the bullish market structure on the daily chart, as of the time of writing, the outlook for SOL buyers is positive.
On August 21 (Thursday), Solana whales accumulated 60,000 SOL, worth $11.23 million. Futures data also highlights a short-term bullish outlook. In the long run, Solana's high throughput has attracted the attention of institutional investors.
For Bitcoin [BTC] to rise further, halting the pullback momentum would be beneficial. As of this writing, BTC is trading at $113,200, slightly above the support level of $112,400. The sale of $64.4 million worth of Bitcoin by Ark 21Shares has also raised market concerns.
Solana has broken through the $180 support level, but trading volume remains a question mark.
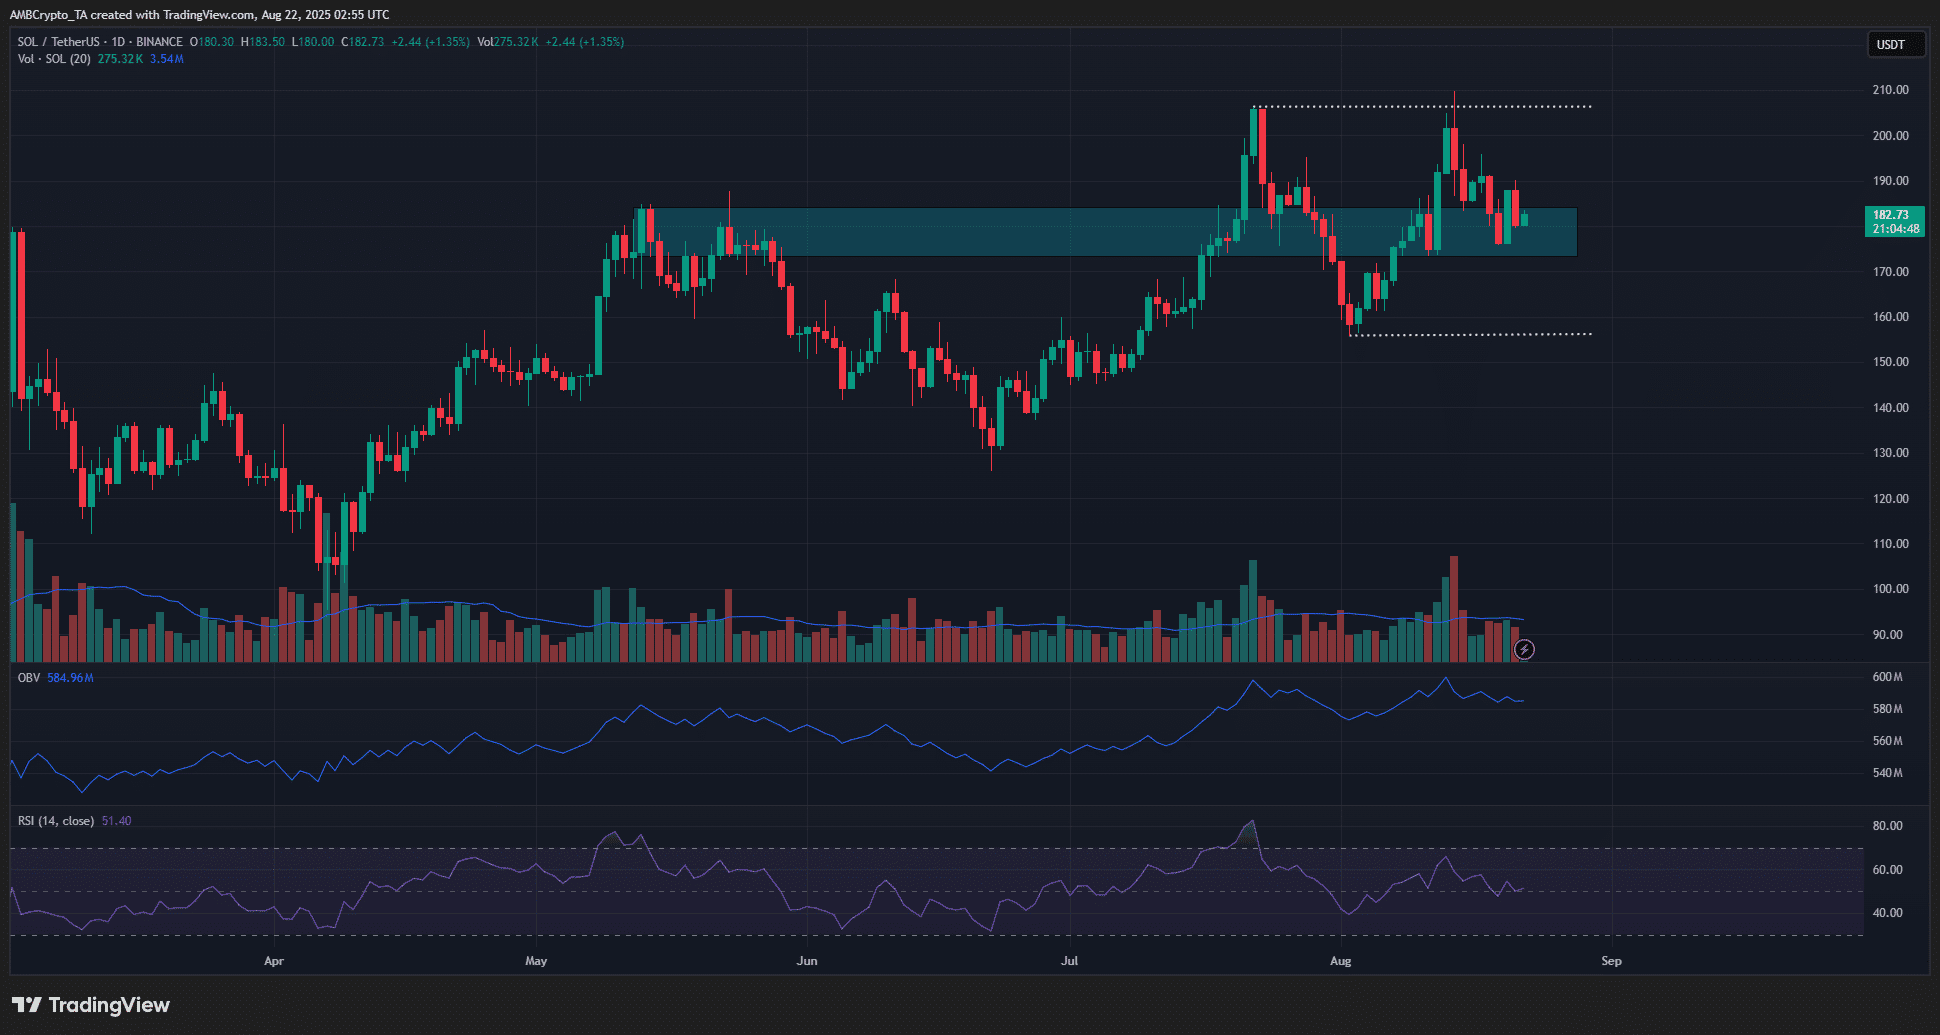
The pivot points on the daily chart are at $155.8 and $206.3. Breaking through either of these levels will determine the next trend direction. On the price chart, SOL is positioned between these two levels, having shifted from a resistance level in May to a support level.
The market structure is bullish, and the RSI tracks upward momentum. However, the OBV remains relatively flat. In the coming days, buying volume needs to continue to rise to give bulls hope for a rise to $206 or even higher.
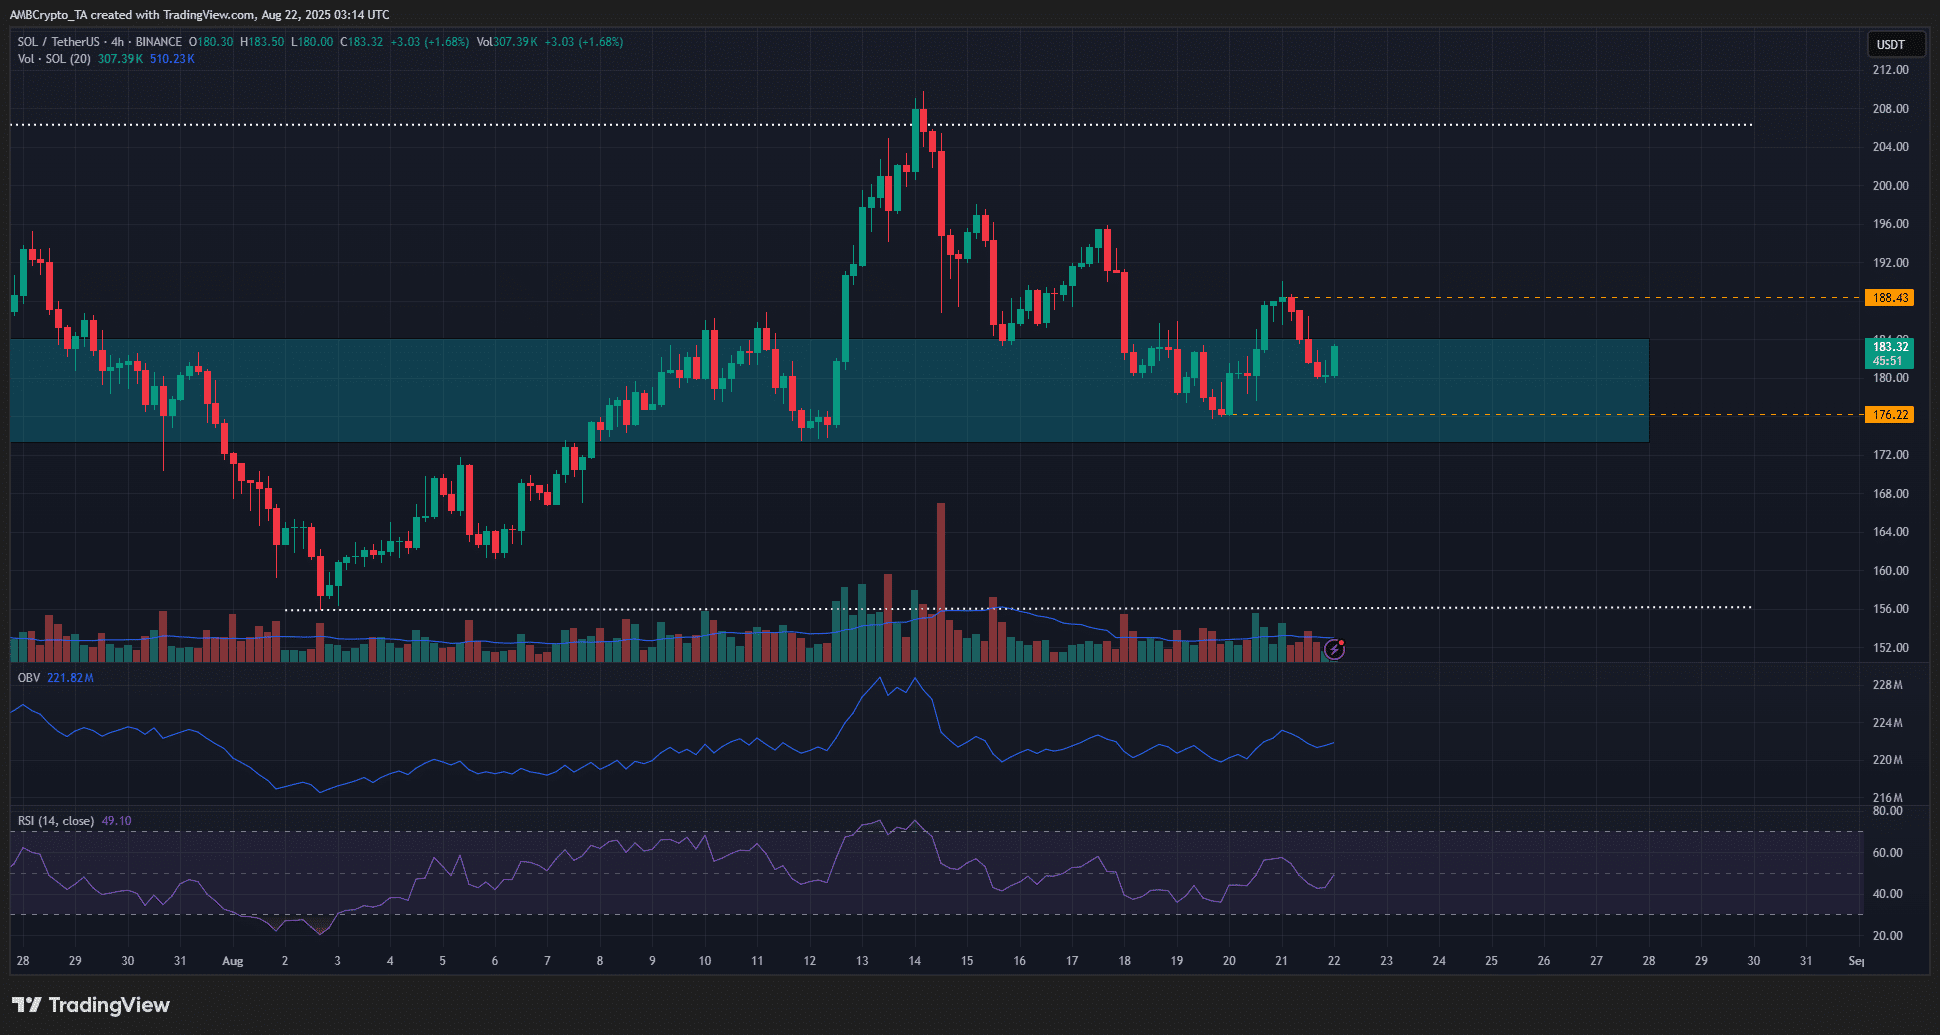
On the 4-hour chart, the OBV shows no upward trend, with relatively low volume during the pullback from $206 to $180. The RSI is also neutral.
However, as of the time of writing, the seemingly bearish price trend has begun to turn bullish. A breakout above the $188 level is needed to push the 4-hour chart structure bullish. This may indicate that the $180 level is under the control of buyers, who may be ready for further gains.


