$BNB The price of BNB has risen by nearly 14% over the past 30 days and recently reached a new all-time high of $881.
===========
Hodlers are buying on the rise:
The chart below shows the HODL waves of BNB — a metric that measures how long investors hold their tokens. It divides all BNB holders into age groups. The focus is on two groups: long-term holders (1–2 years) and mid-term buyers (3–6 months).
On July 21, the 1–2 year group owned 6.56% of the supply. By August 20, this figure had risen to 7.49%. The share of the 3–6 month group increased from 1.5% to 7.3%. This is a significant growth, especially considering that the price of BNB has been rising during this time.
Accumulation is observed not during the decline, but during the BNB price rally — this means that holders are not waiting for a correction. They are buying amid the rise.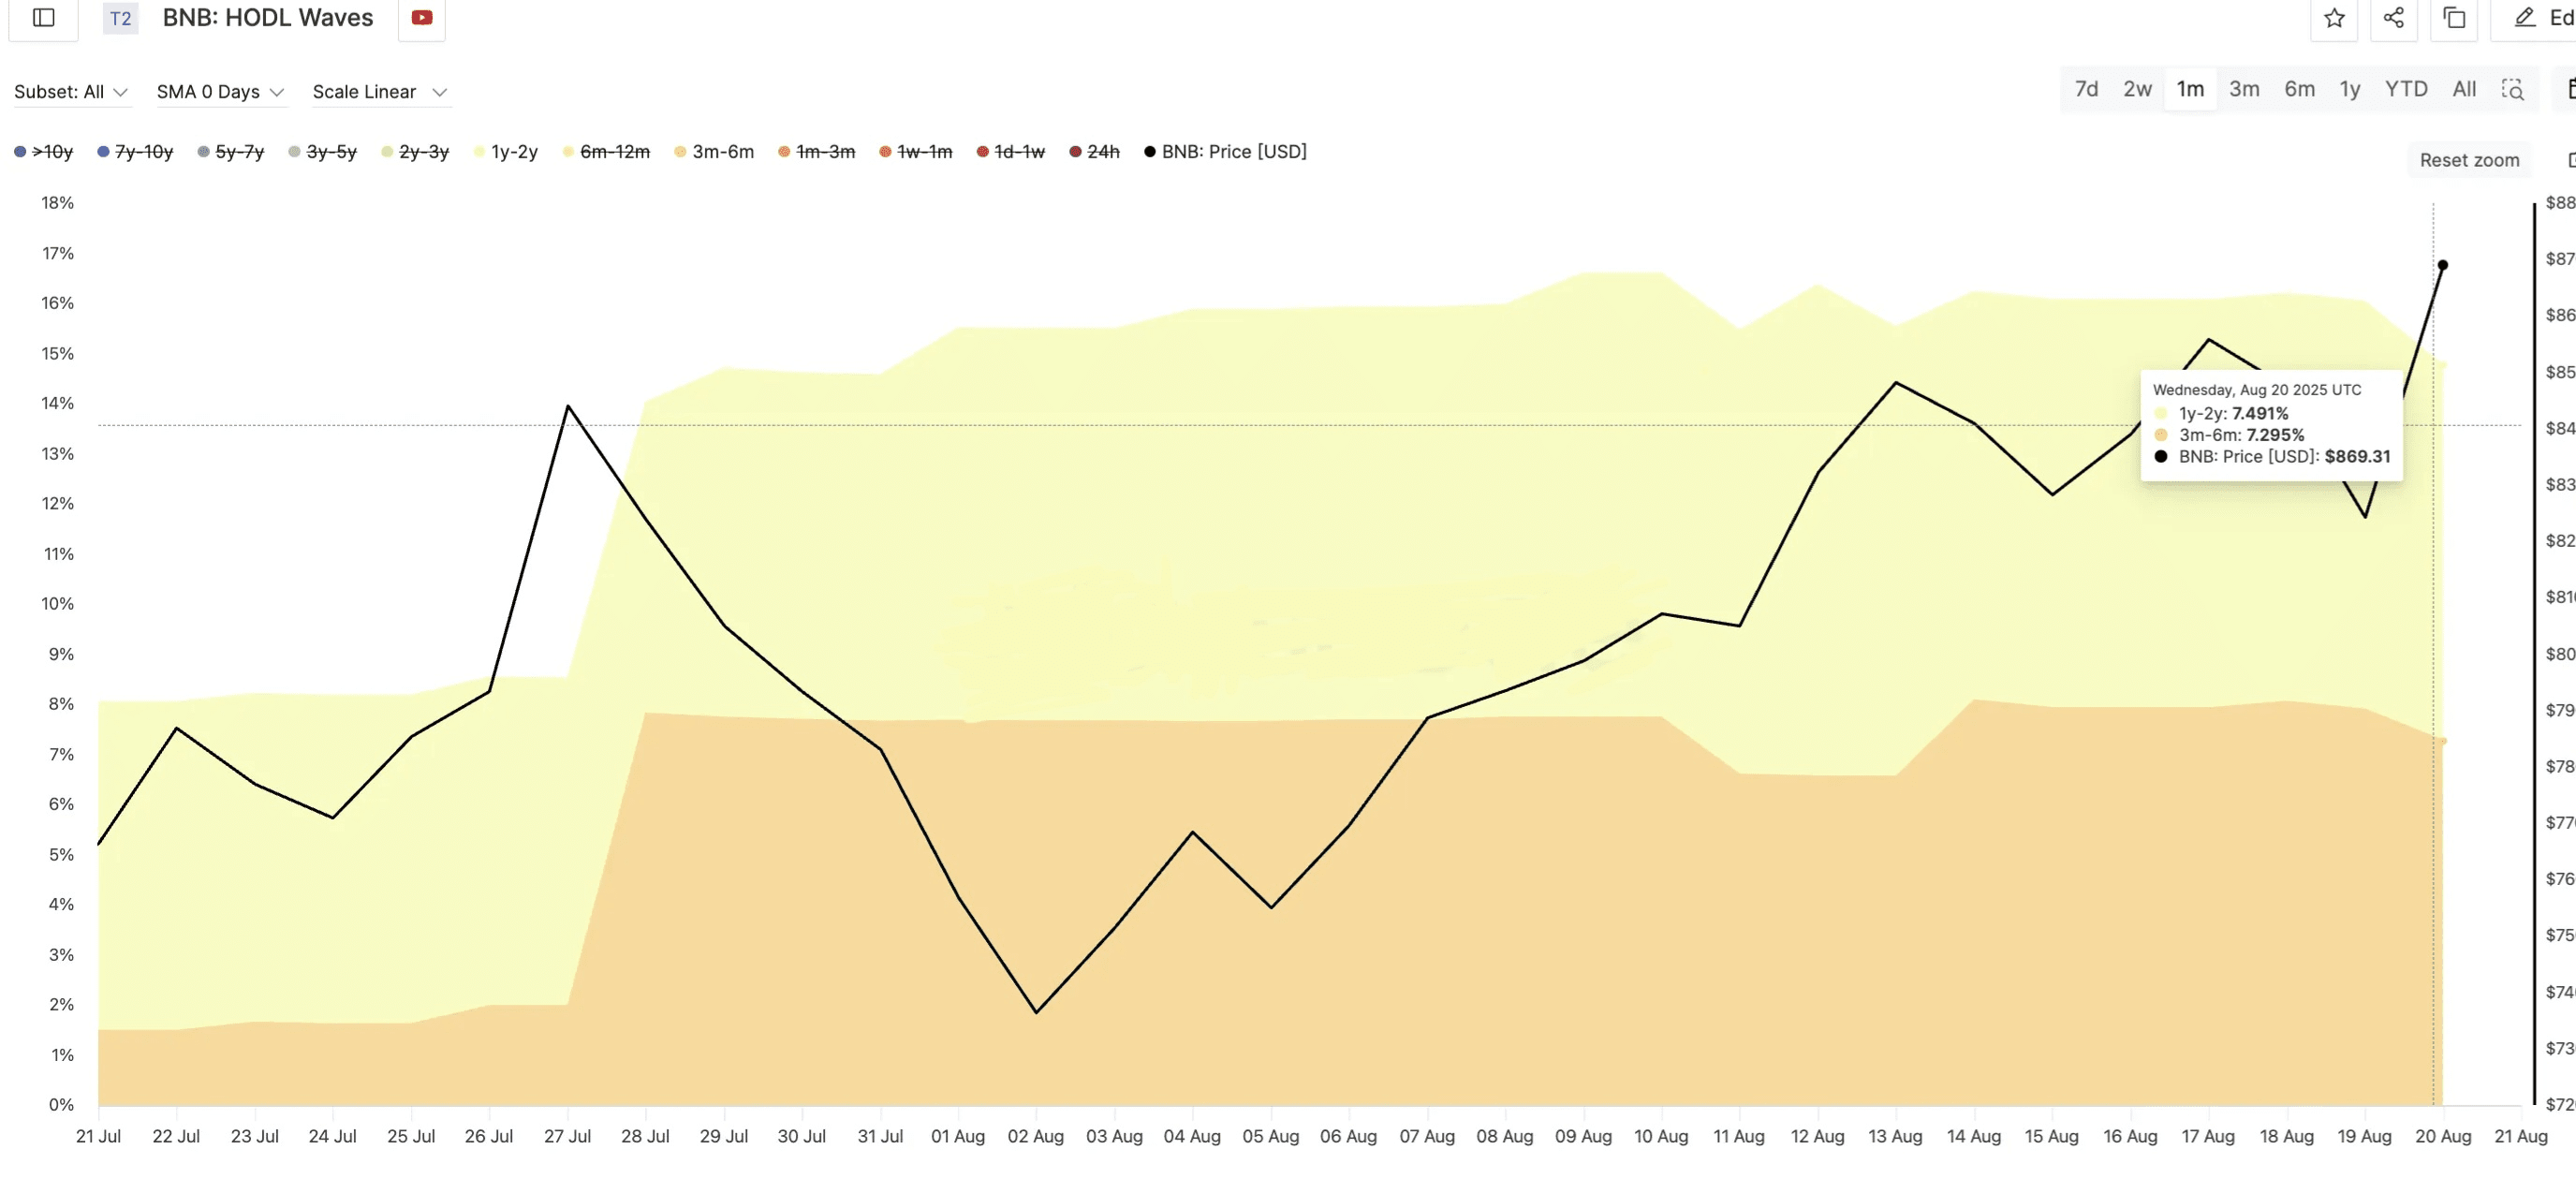
From August 19 to 20, the price of BNB rose from $824 to $869. At the same time, balances on exchanges decreased from 31.91 million to 31.38 million BNB — a decline of 530,000 tokens in one day.
This indicates that traders are not selling coins, but rather withdrawing them. Such accumulation rates clearly show that BNB holders are expecting price increases.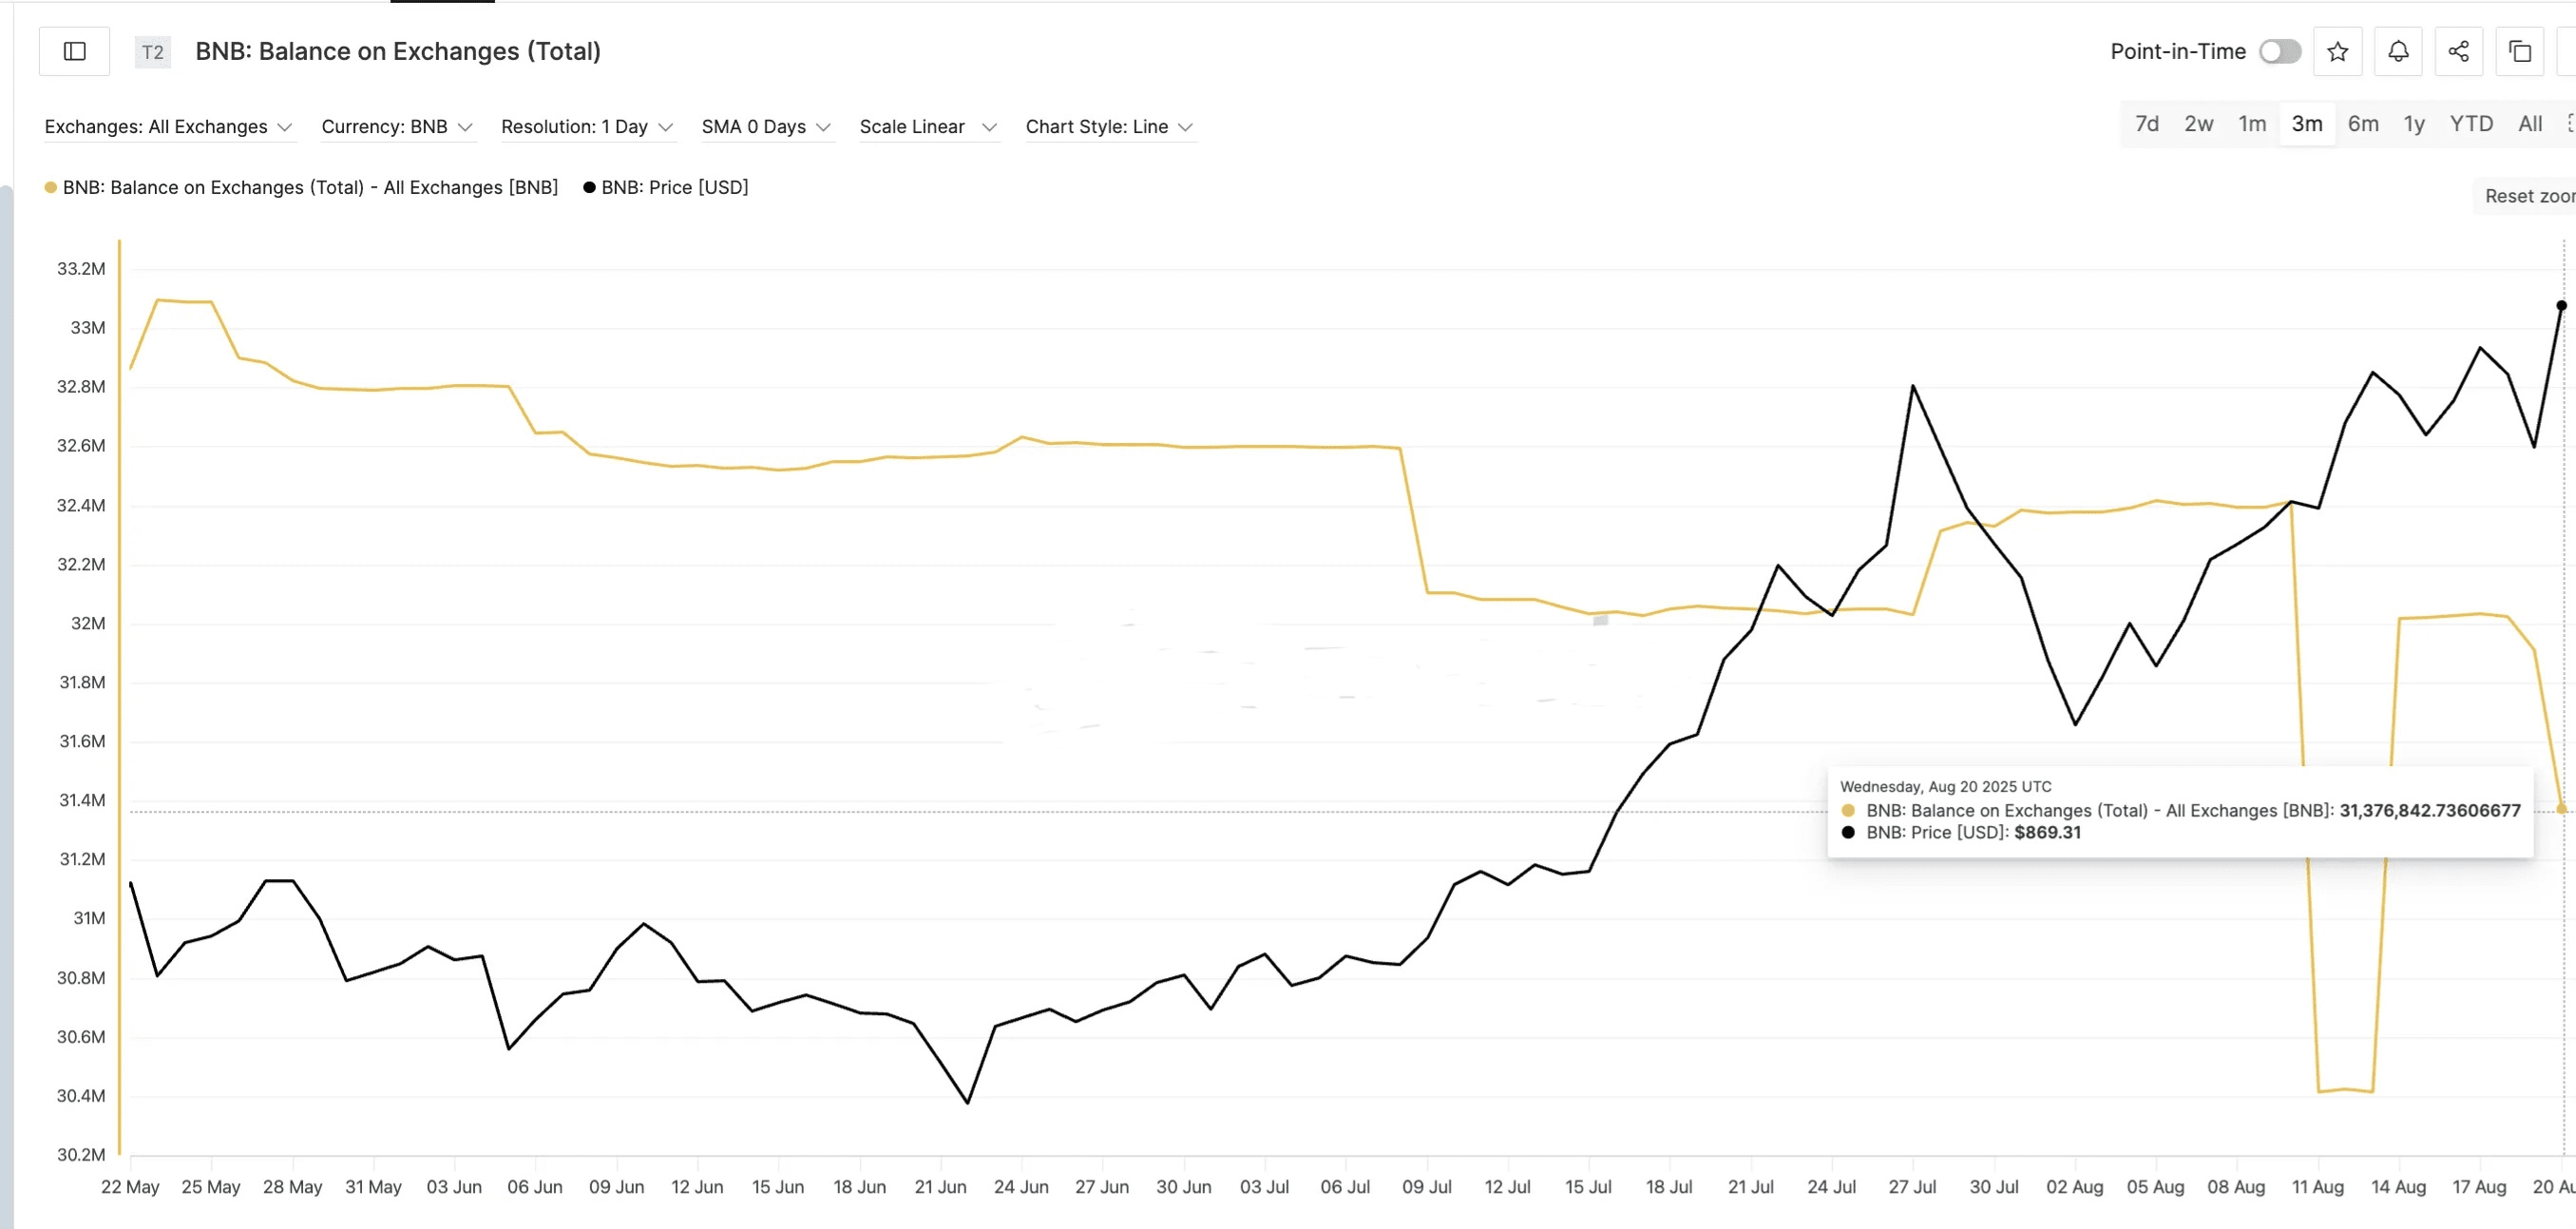
===========
BNB Forecast: Where the next obstacle is expected
The rise in the price of BNB is not accidental. It follows a clear upward trend, with pullbacks corresponding to Fibonacci correction levels. The chart shows Fibonacci expansion based on recent momentum: $730 (start) to $864.95 (peak), with a pullback to $812.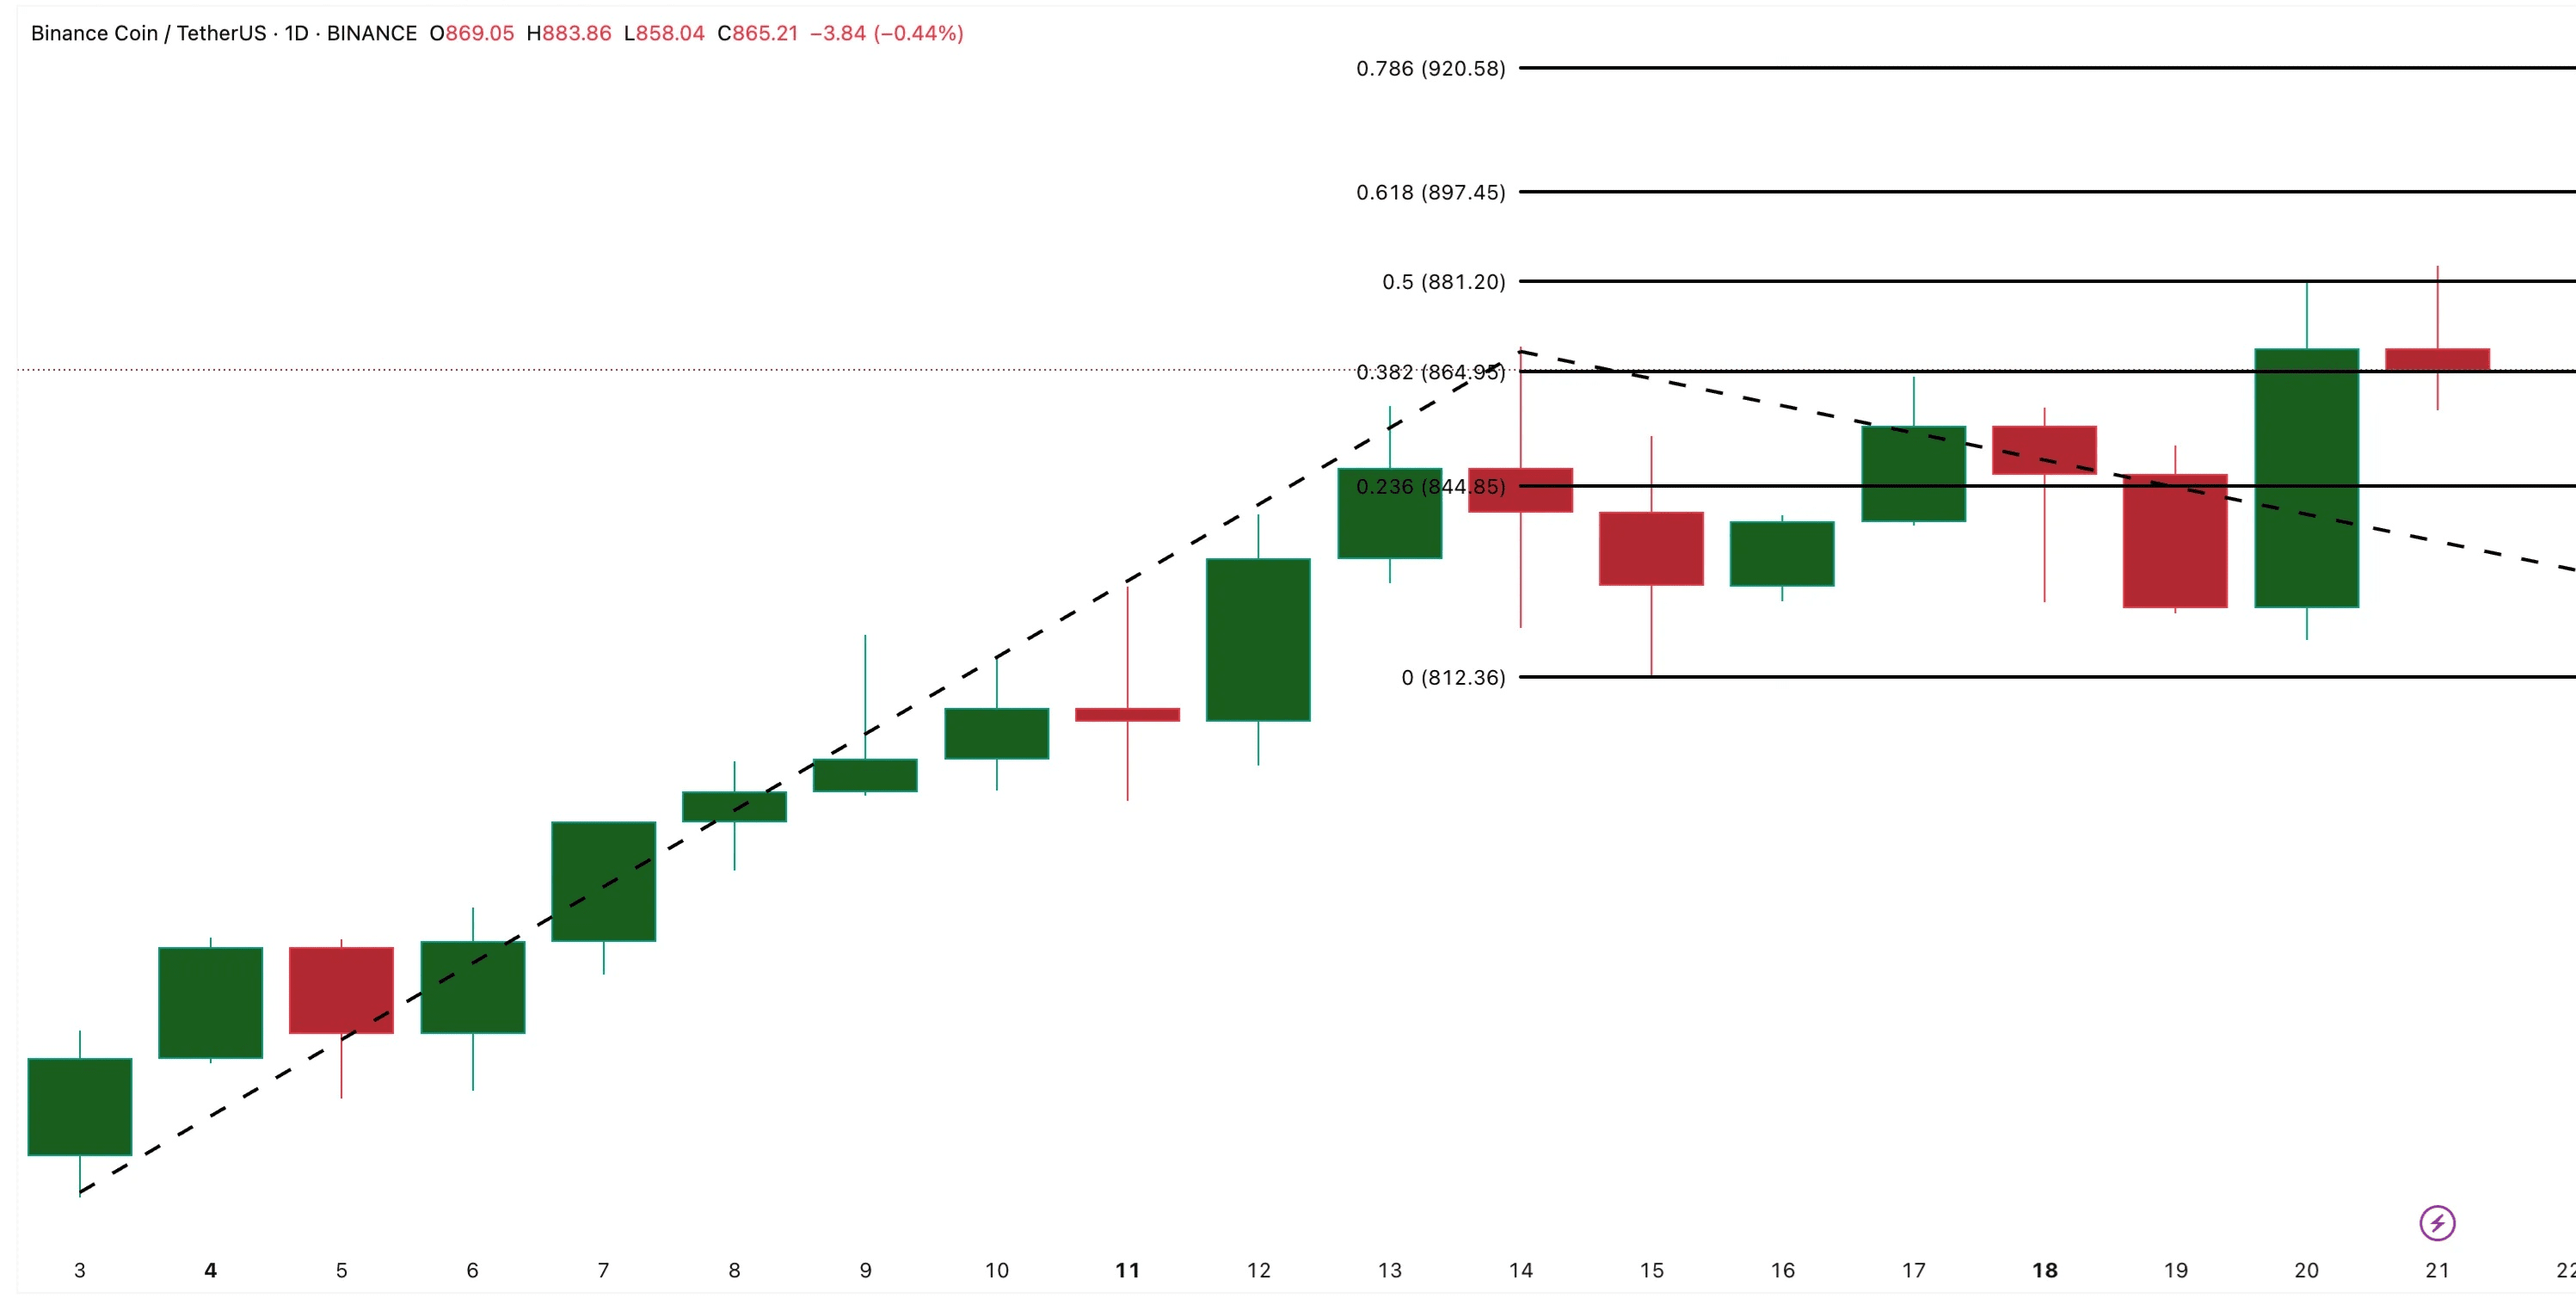
The 0.5 level — $881 — has become a clear resistance and was tested almost perfectly, marking the historical maximum for BNB. If it can be overcome, the next Fibonacci levels at $897 and $920 will become new all-time highs.
However, there is a risk: if the price of BNB falls below $812, the trend structure will weaken. This level has served as a key correction zone, and losing it will change market sentiment. Until that happens, the mood remains bullish.
