$BTC Bitcoin remains under pressure as of August 21, 2025, with prices trading at $112,526 amid a prolonged downward structure.
With a market capitalization of $2.25 trillion and a 24-hour trading volume of $37.27 billion, Bitcoin has ranged from $112,460 to $114,723 during the day.
=============
The daily chart shows that Bitcoin entered a bearish phase after forming a double top around $124,517, marking a strong resistance level.
The current zone around $112,500 is significantly lower, with trading volume steadily declining from the last peak.
The pattern of lower highs and lows confirms the emergence of a downtrend, reinforced by increasing selling volume.
Key support is located between $112,000 and $111,500, while resistance is found between $117,000 and $118,000.
Traders considering long-term purchases may pay attention to a price bounce from the $112,000 level with increasing volume and confirmation from bullish candles.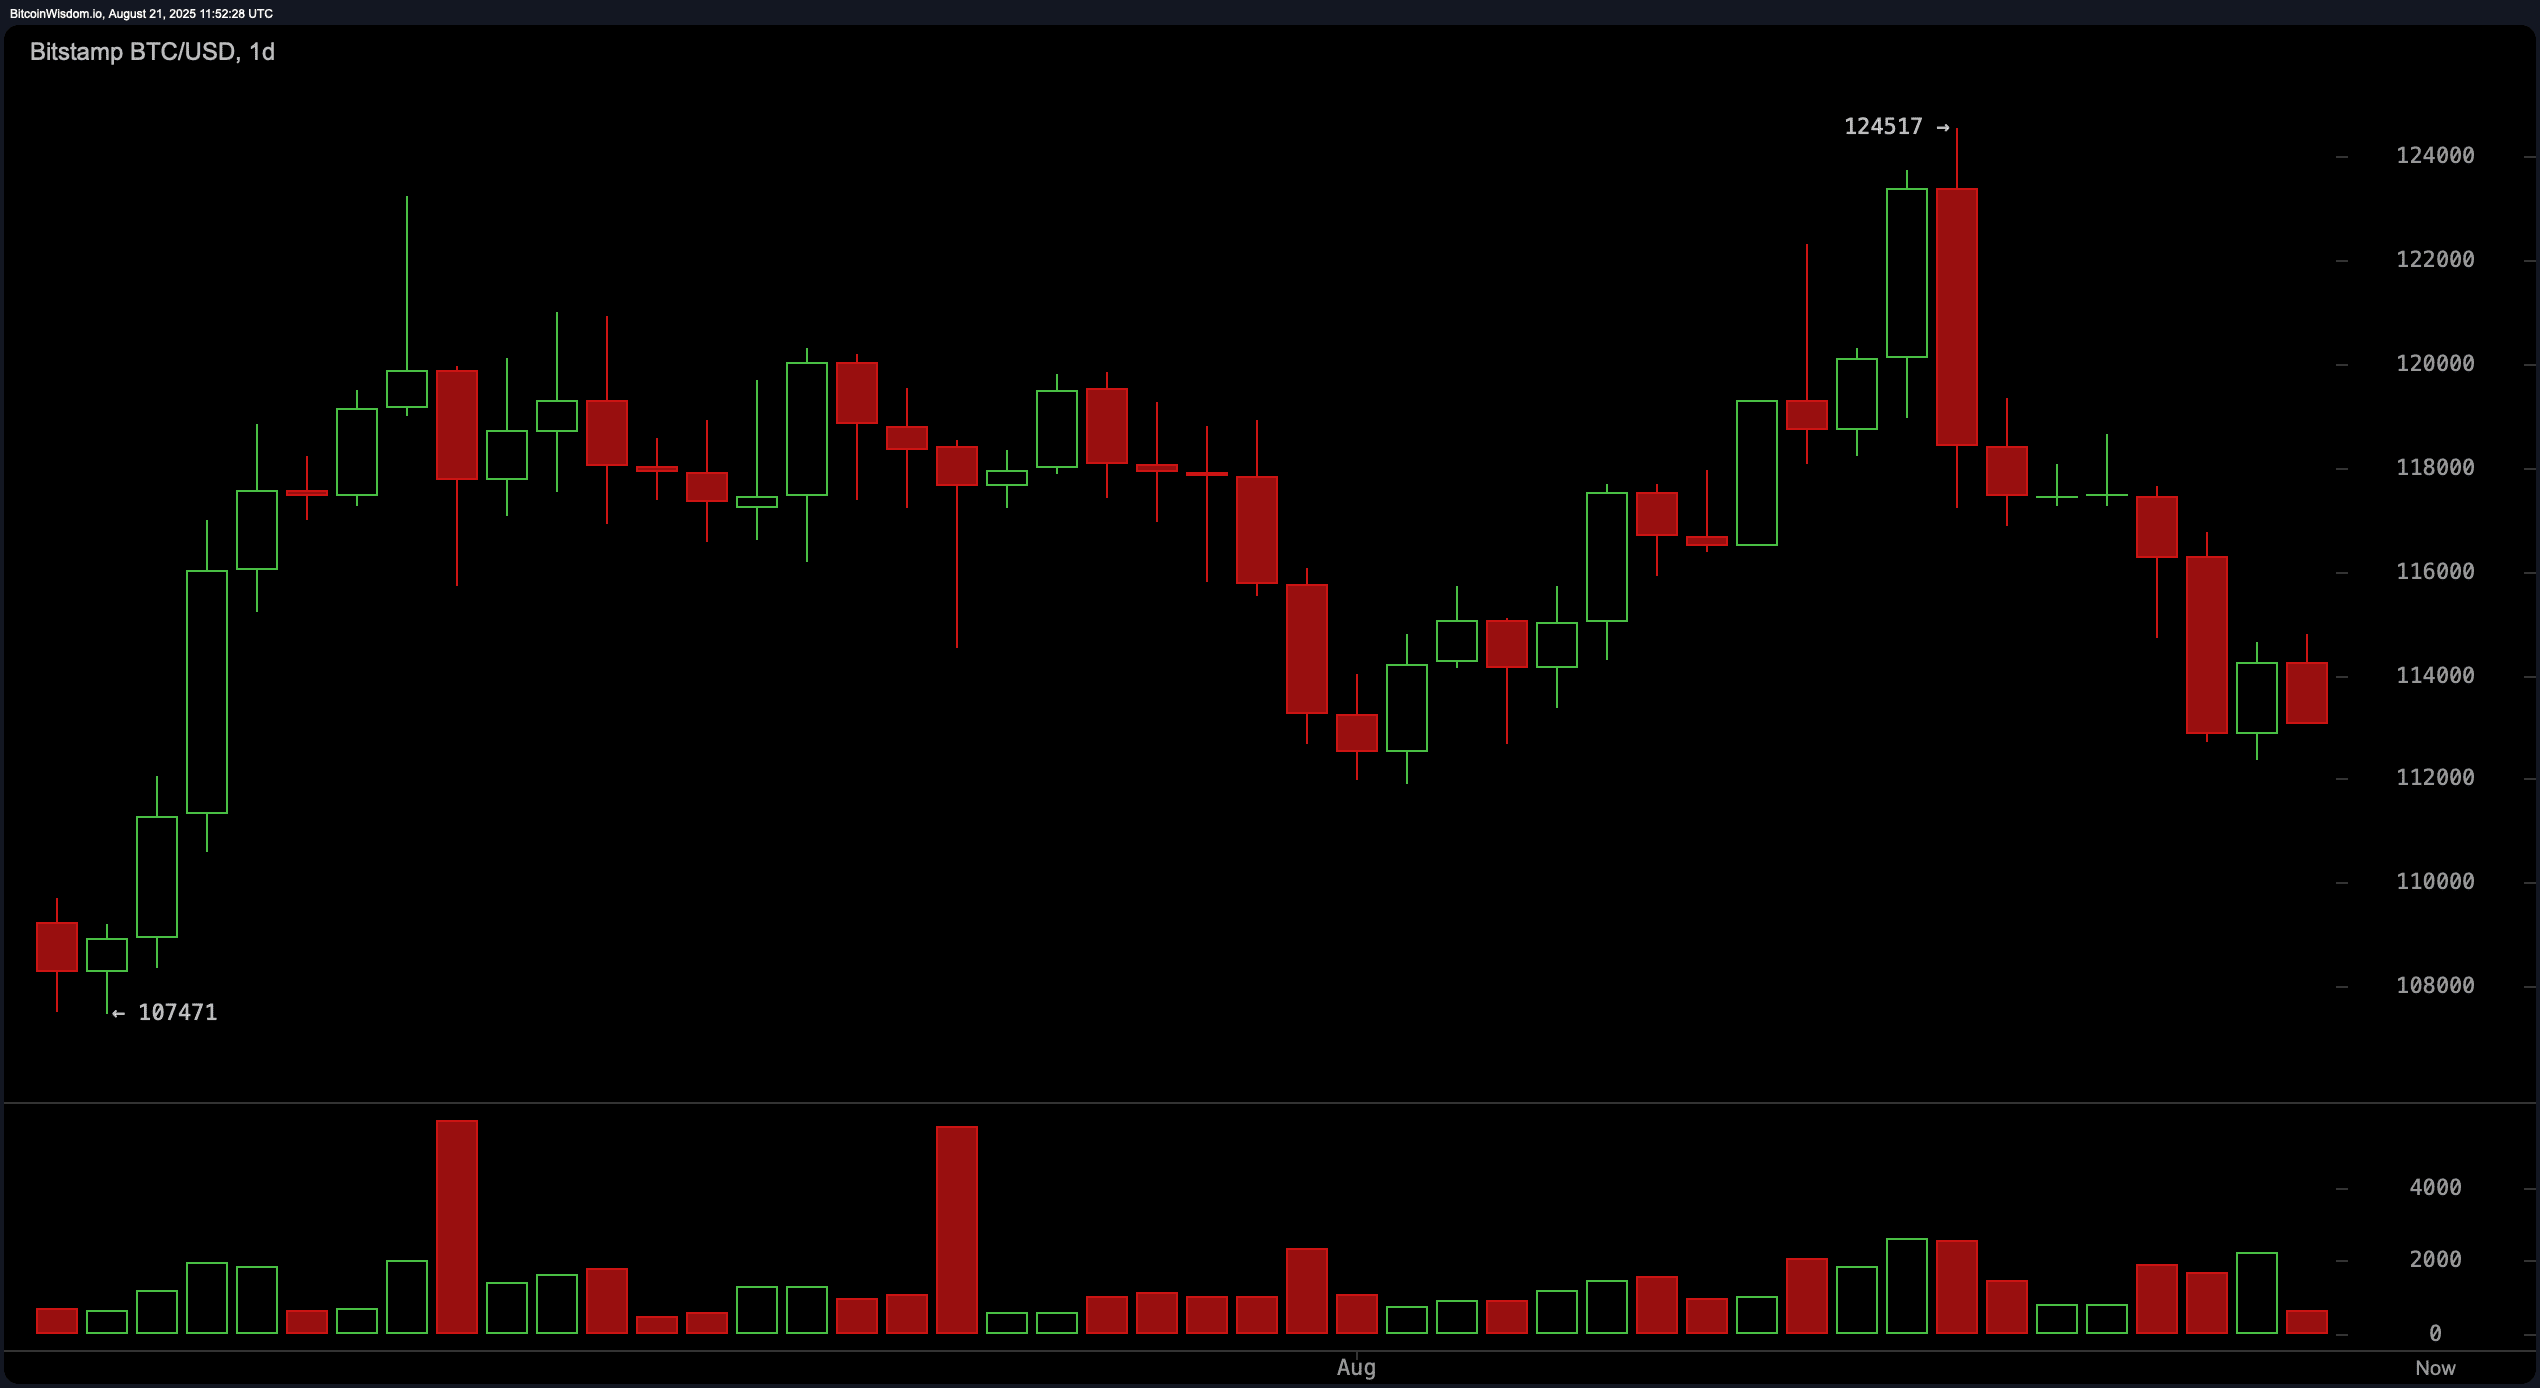
=======
On the 4-hour timeframe, Bitcoin experienced a strong sell-off after reaching the $124,517 mark, followed by a mini-consolidation between $113,000 and $115,000.
Despite attempts to rise, weak bullish candles with low momentum indicate a potential dead cat bounce in the background.
The local minimum at $112,353 remains a critical level, especially if tested on higher volume.
A short position may be preferable if the price rejects the $115,000 zone or on a confirmed break below $112,000.
A long position remains plausible if the price stabilizes above $113,500 and forms a higher low.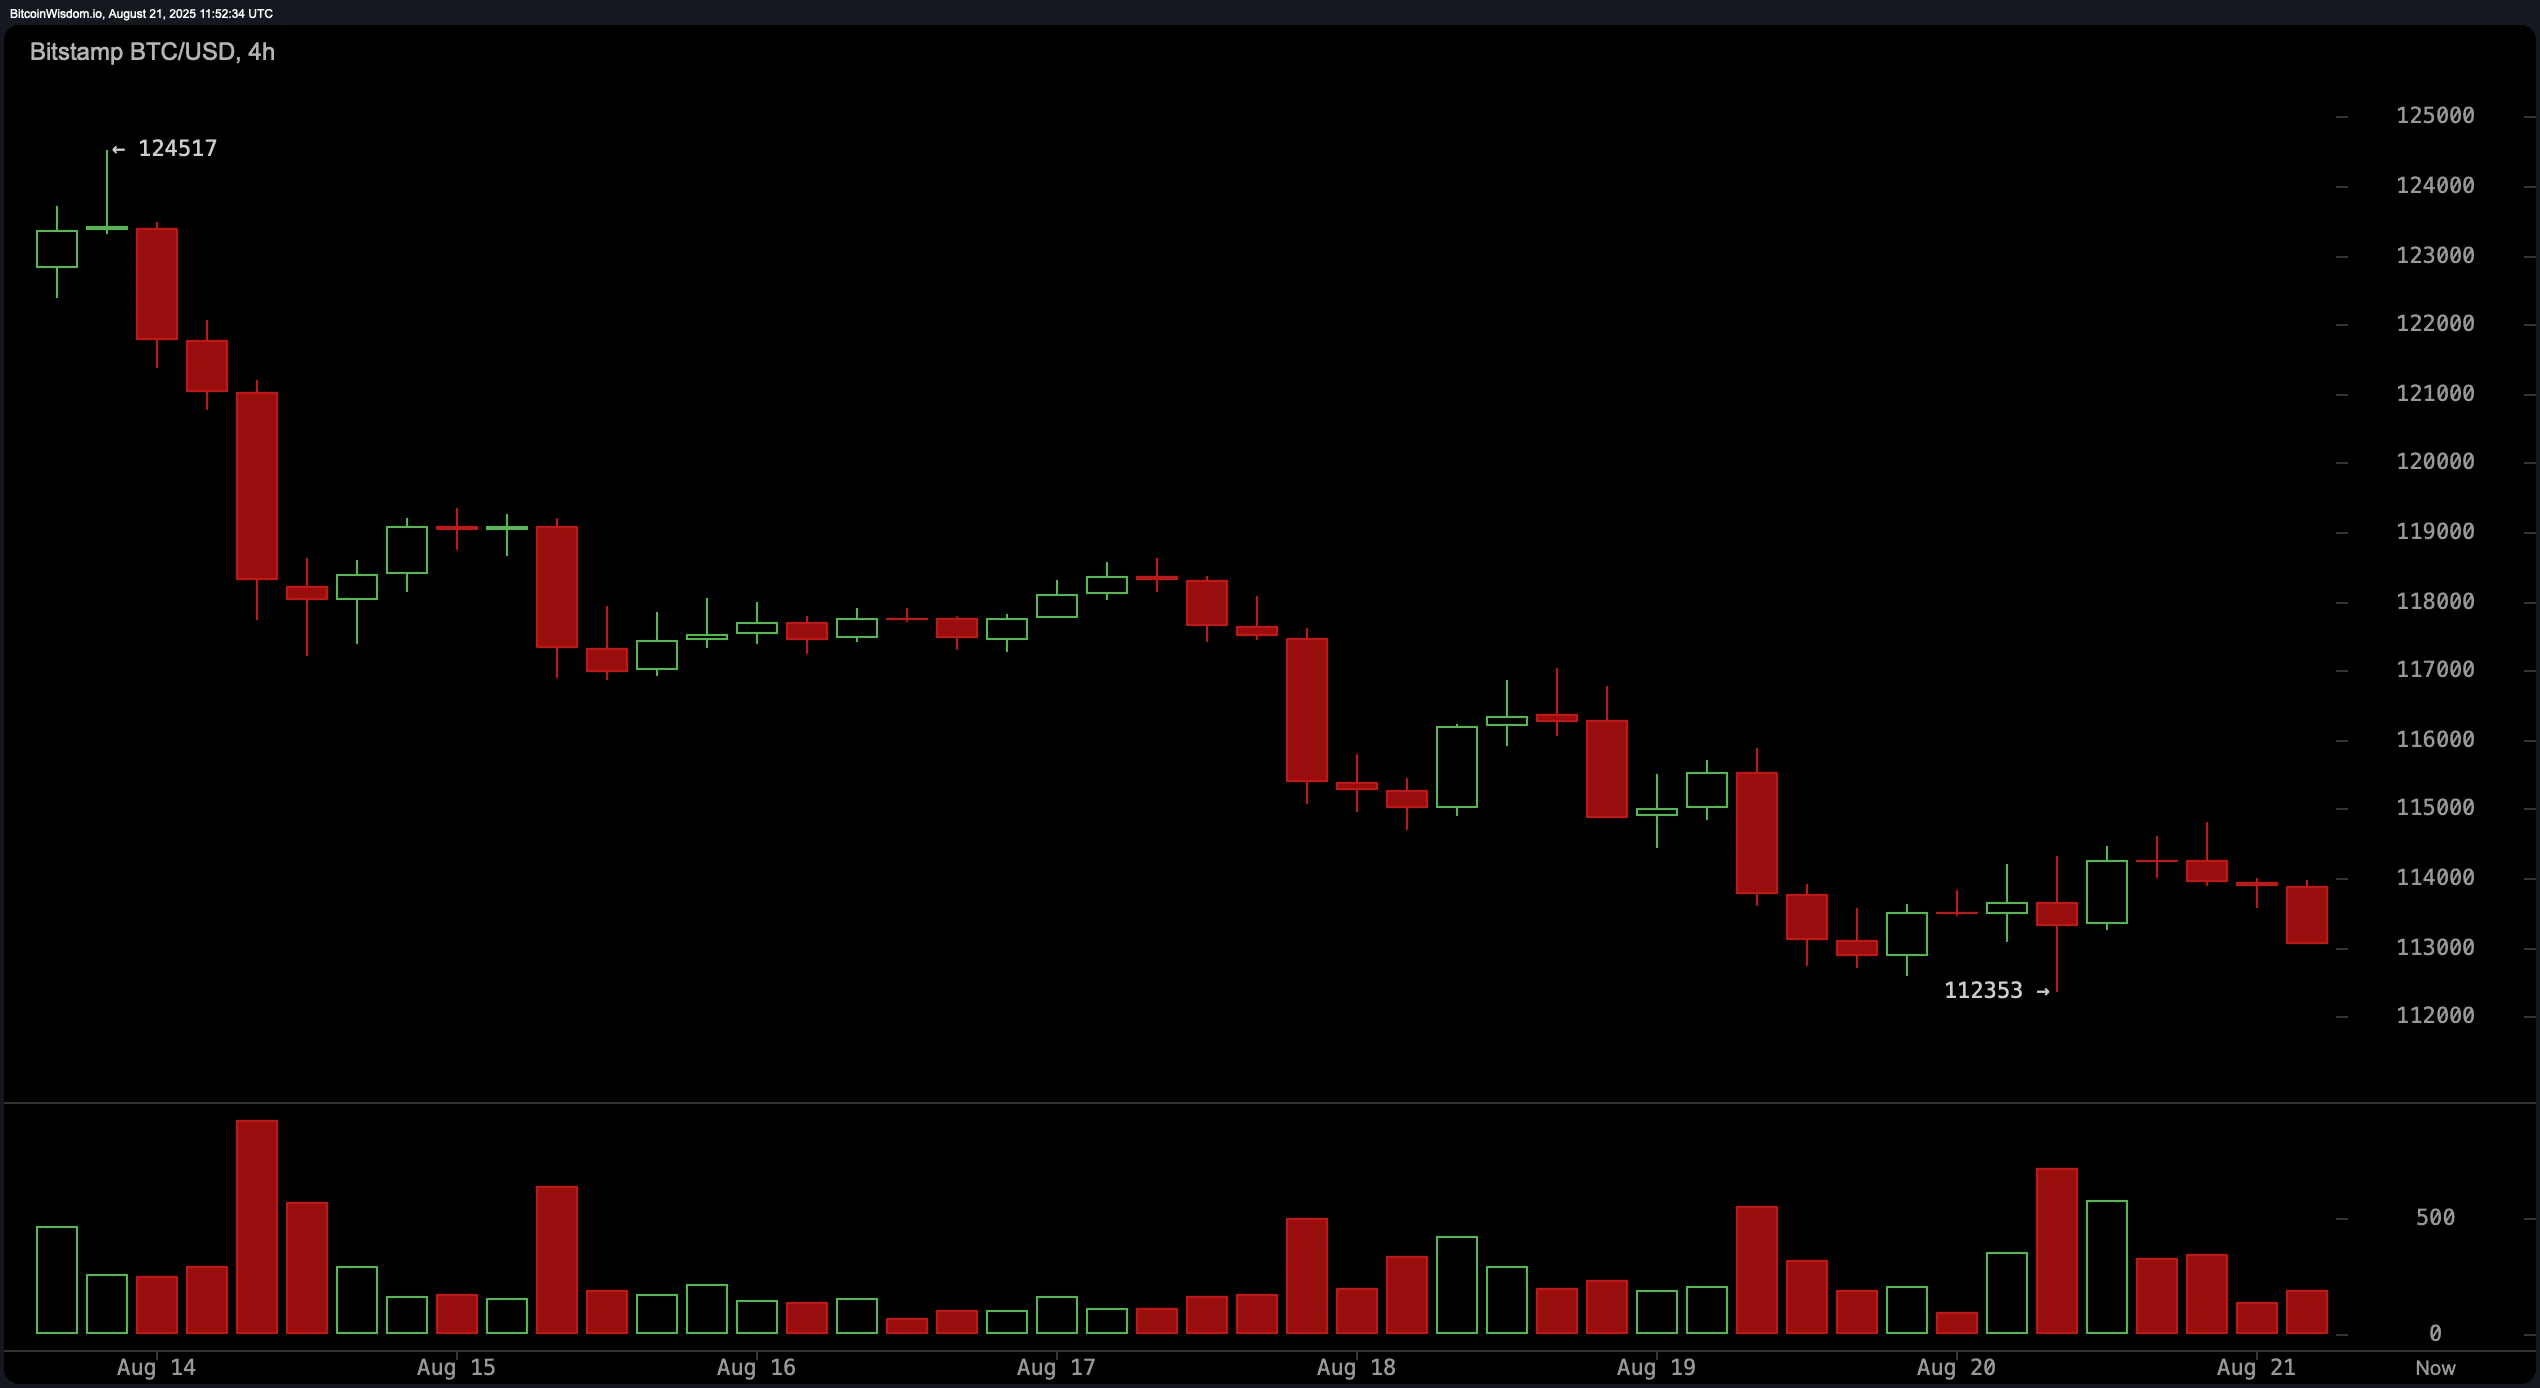
==========
On the hourly chart, Bitcoin shows a weak upward bounce from $112,353, with lower highs indicating persistent selling pressure.
The short-term structure supports a bearish sentiment unless Bitcoin clearly recovers the $114,500 level.
Support between $112,800 and $113,000 suggests potential for quick bounces, while resistance around $114,000–$114,500 may offer short-selling opportunities.
Scalpers may benefit from entries with tight stop-losses near resistance and exits in a profit range of 0.5% to 1.5%.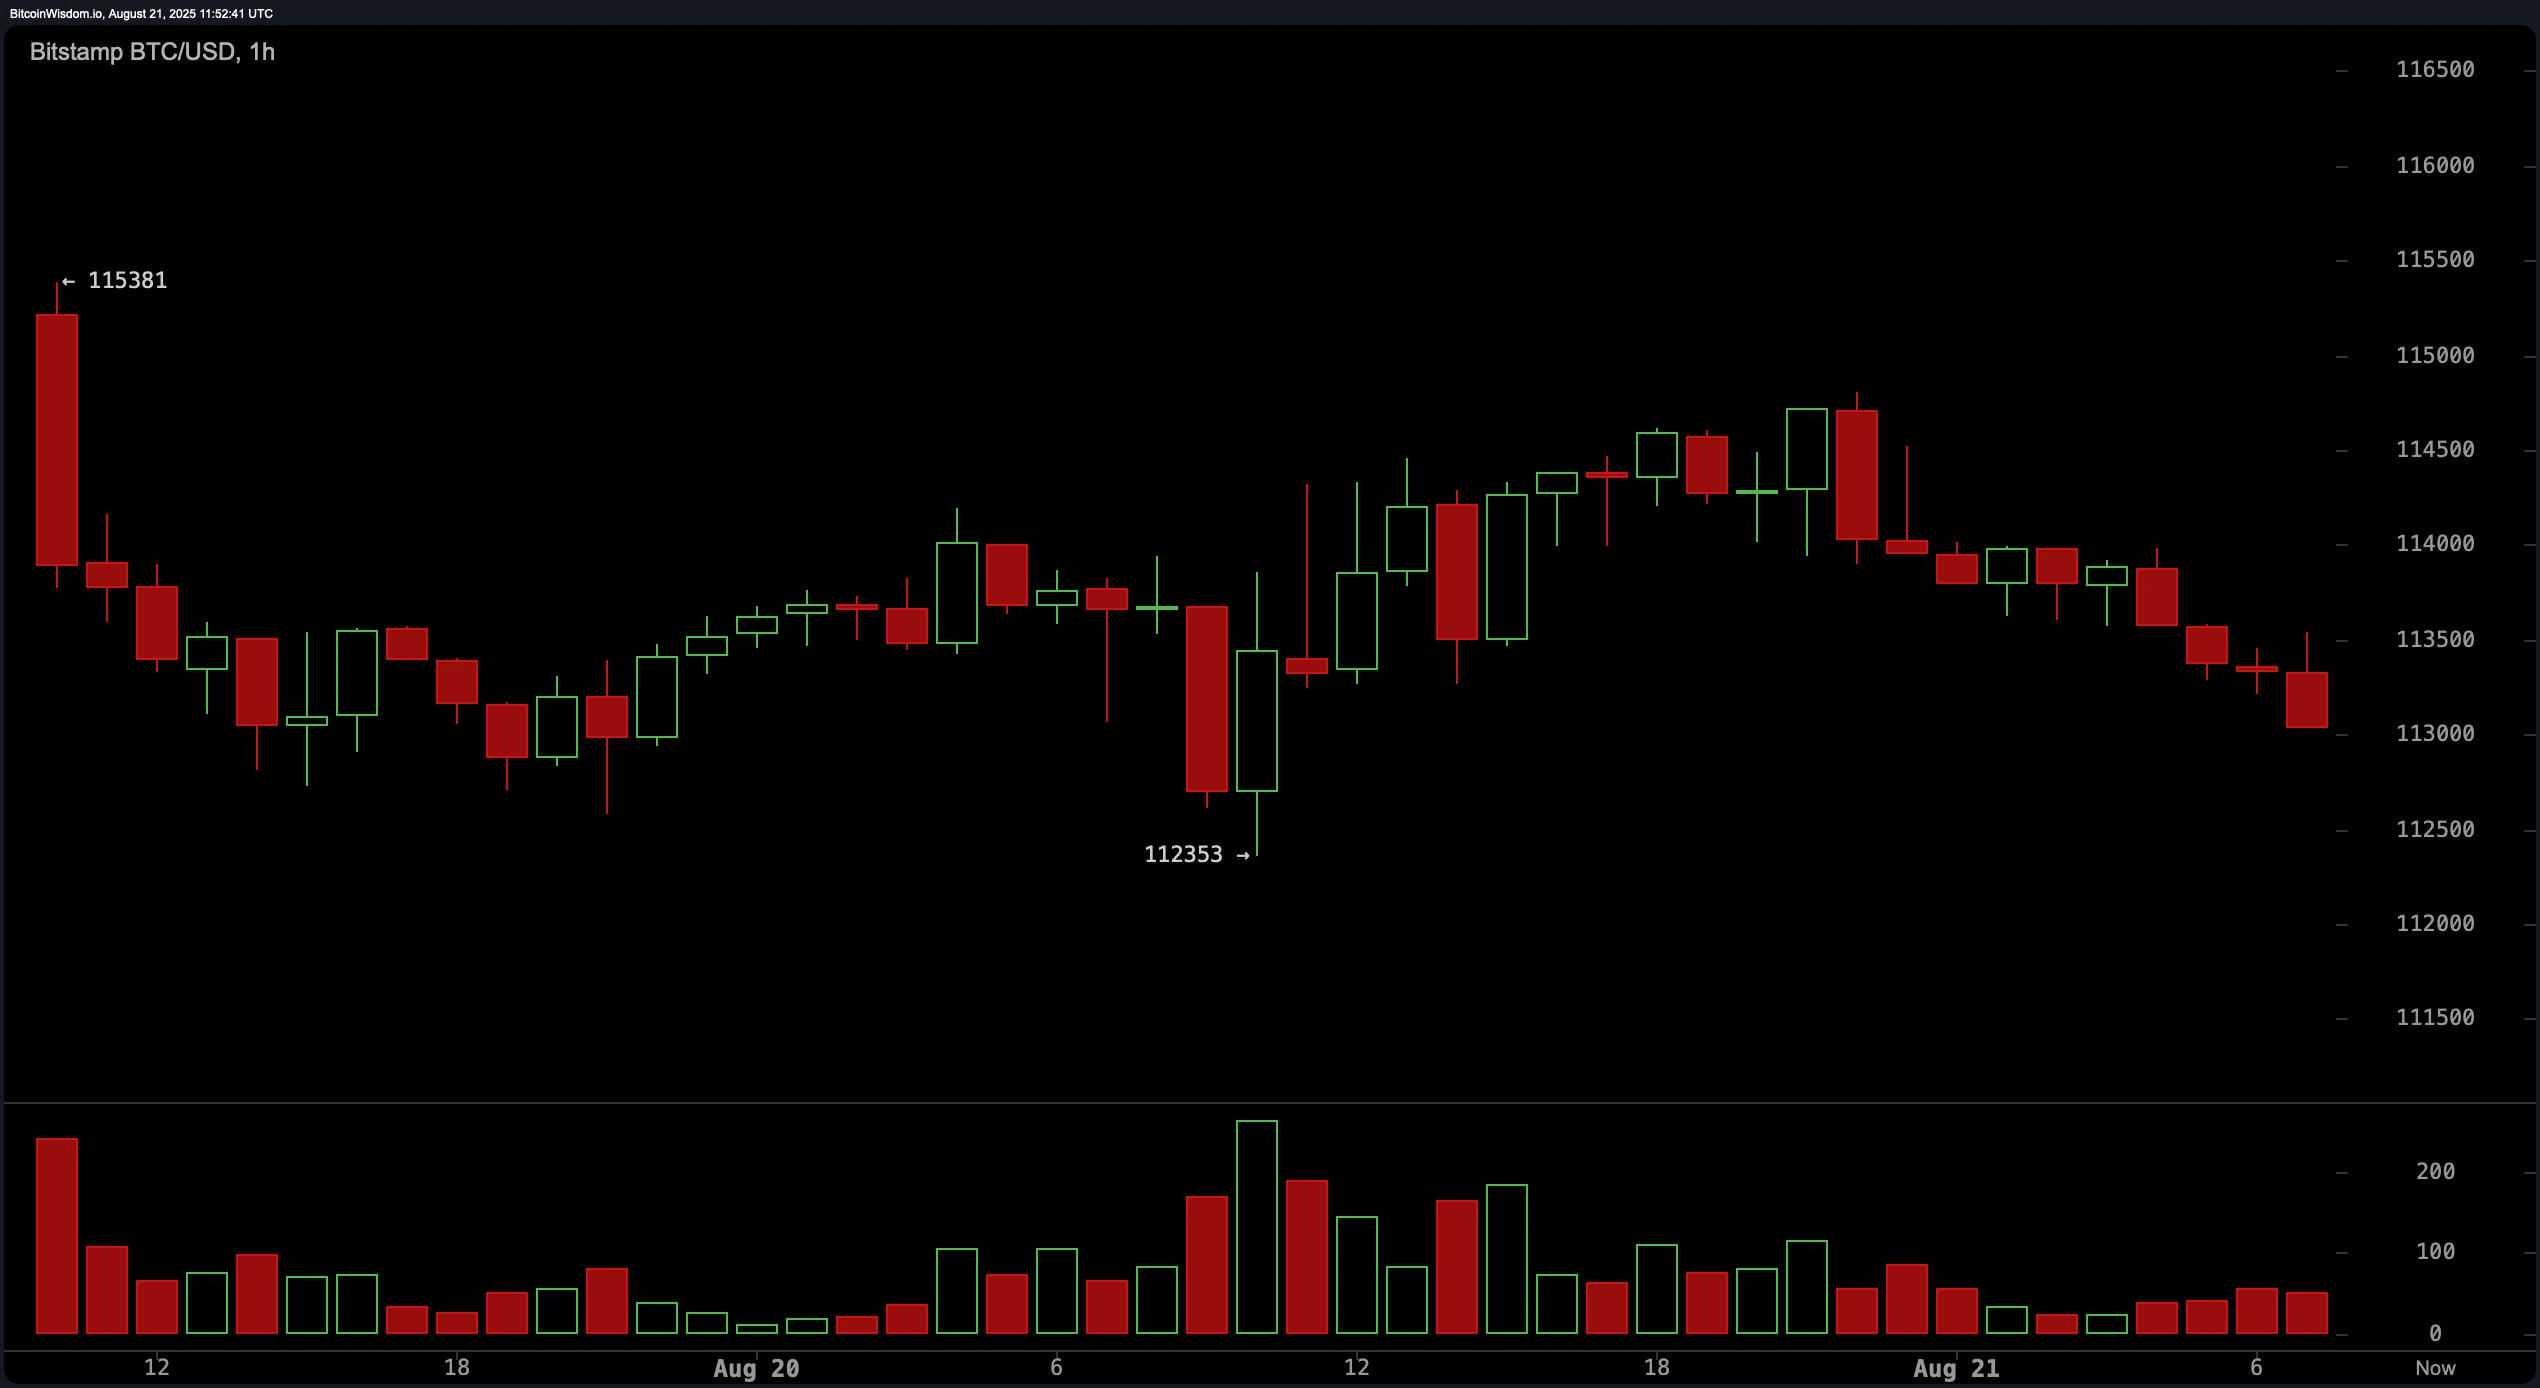
==========
Verdict for bulls:
If Bitcoin successfully holds above the $112,000 support level and confirms a higher low with increased volume and a bullish candle pattern, a short-term recovery towards the $117,000–$120,000 resistance zone may occur.
Although the broader trend remains under pressure, a bullish reversal may form if key resistance levels are reclaimed with strength, especially above $114,500.
====≈===≈
Verdict for bears:
Given the bearish signals dominating the daily and intraday charts, and Bitcoin trading below critical short-term and medium-term moving averages, the path of least resistance remains downward.
Failure to hold support at the $112,000 level may trigger further selling pressure, jeopardizing the $111,500 zone and below, especially if supported by increased volume and bearish momentum indicators.
