
Data shows that on August 21, the long account ratio of top Binance traders for XRP fell from 78.12% to 74.15%, while the short ratio increased from 21.88% to 25.85%. This pushed the long/short ratio down from 3.57 to 2.87 in less than 24 hours.
In terms of open positions, long positions account for 65.98%, while short positions account for 34.02%, bringing this ratio down to 1.94, the lowest in several weeks. This adjustment indicates significant caution in the market as participants await Powell's speech at the Jackson Hole symposium.
On-chain Data Shows a Diverging Market
Data on-chain shows that wallets holding 10–100 million XRP sold approximately 460 million tokens in the past week, contributing to a nearly 6% price drop. Meanwhile, smaller wallets with 1–10 million tokens accumulated 130 million XRP during the same period. This divergence highlights the contrasting sentiment between different investor groups.
The holdings of institutions have also weakened, with the largest wallets cutting their exposure by nearly 80%. Open interest in futures has decreased from $10.9 billion to $7.5 billion, while the long/short ratio has dropped below 1. Prices have broken below both the 20-day and 50-day moving averages, forming a descending triangle pattern that could push the token down to $2.40 if confirmed.
XRP Forms Descending Wedge Pattern Before Breakout
Despite the bearish sentiment from traders, the XRP price chart on the four-hour timeframe shows a clear "descending wedge" pattern. This is a bullish technical formation where the price moves between two converging downward slopes, often signaling a potential breakout to the upside.
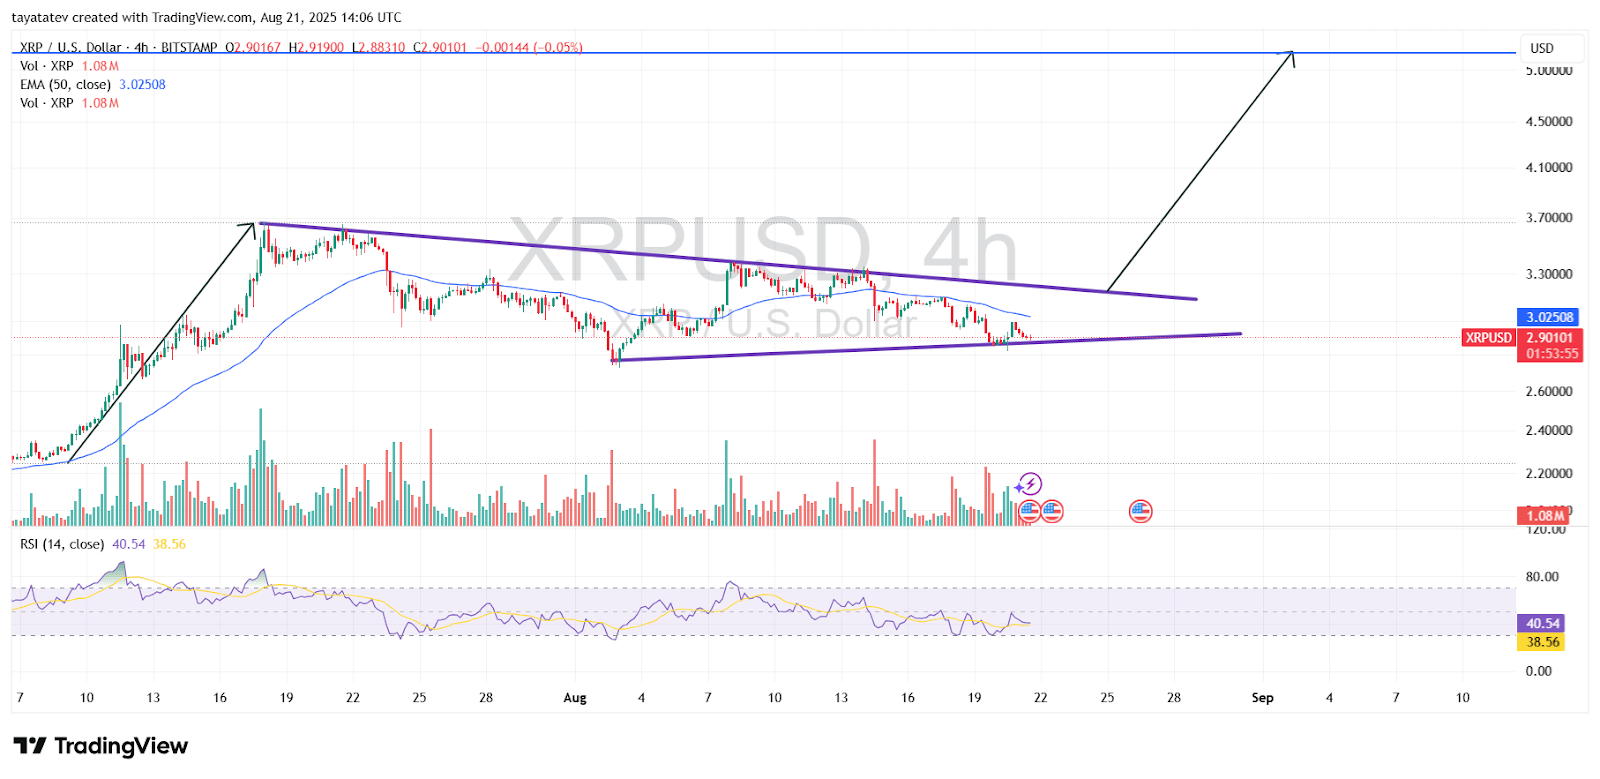
At the time of the chart, XRP is trading near $2.90, testing the lower boundary of the wedge pattern. If this pattern is confirmed, the potential upside could reach nearly 78% from the current price, targeting close to $5.20. This forecast aligns with the upper resistance area marked on the chart.
The 50-period exponential moving average (EMA) is currently around $3.02, slightly above the spot price. Trading below this level reflects short-term weakness but also sets the stage for a bullish reversal if XRP breaks above this with strong momentum.
The RSI is currently at 40.54, with a moving average of 38.56, placing XRP near an oversold state. This indicates that the downward momentum is weakening and creates an opportunity for a price recovery if buying pressure returns.
Meanwhile, trading volume data shows moderate activity, with recent declines indicating consolidation. A spike in trading volume will be necessary to confirm any breakout from the wedge pattern. Without more active participation, prices may continue to fluctuate within the range of the pattern before making a decisive move.
Overall, the chart structure, wedge pattern, EMA position, and RSI conditions combine to highlight a setup where XRP could generate a significant price surge if the wedge pattern confirms volume support.
The Broader Market Prepares for Fed Guidance
Risk sentiment across the cryptocurrency market remains fragile. Over $270 million in leveraged positions have been liquidated this week, primarily in Bitcoin and Ethereum. Bitcoin is hovering around $113,000, while Solana and Dogecoin have also seen price declines.
The market is currently awaiting Powell's speech, which will clarify the Fed's stance on monetary policy. A hawkish tone could exacerbate the sell-off, while any dovish signals could alleviate pressure on risk assets, including XRP.


