Success is never accidental. Every successful person has gone through numerous trials and walked step by step. Undoubtedly, some people are born geniuses, but such individuals are extremely rare; not you, nor me. Most people gradually approach perfection after repeatedly experiencing failures. It is precisely these experiences of failure that yield insights and lessons that shortcuts cannot provide.
A common saying is that there are no good opportunities. In fact, opportunities are reserved for the prepared. When opportunities arise, only then can one prepare to seize them firmly. Waiting idly like a sitting duck will result in either missing the opportunity or being unable to grasp it when it truly appears.
In the cryptocurrency circle, many friends may not know how to read K-line trading strategies, and those who do understand are few. As the saying goes, 'A single trick can conquer the world.' Mastering a technique that you can understand isn’t difficult; the challenge lies in not wanting to learn. Trading cryptocurrencies is for yourself, not for others. If you are willing to put in more effort to learn and thoroughly understand it, trading cryptocurrencies won’t be as difficult as you imagine.
In addition to solid techniques, I also strictly adhere to the following 8 ironclad rules:
1. A sharp drop is the touchstone for quality coins. If the market crashes and your coin only drops slightly, it is evident that the market maker is protecting the price, refusing to let it fall. Therefore, such coins can be confidently held, and there will be rewards.
2. Once a main upward wave is formed and there is no significant increase in volume, decisively intervene. If the volume increases and the price rises, hold your position. If the volume decreases and the downward trend has not broken, hold your position. If the volume increases and the price breaks the trend, quickly reduce your position.
3. After buying short-term, if there is no fluctuation for three days, sell if you can. If the price drops after buying, unconditionally stop-loss at a 5% loss.
4. If a coin has dropped 50% from a high and continues to fall for 8 days, it has entered an oversold channel, and a rebound is imminent; you can follow up.
5. When trading cryptocurrencies, focus on leading coins. Only trade leading coins, not miscellaneous ones. Leading coins rise the most during uptrends and are the most resilient during downtrends. Do not hesitate to jump in; trading cryptocurrencies is often counterintuitive. Don’t buy just because it has dropped a lot, and don’t refuse to buy just because it has risen a lot. The less you dare to buy, the more it rises; the more you dare to buy, the more it falls. The strong remain strong, and in short-term trading of leading coins, it is crucial to buy at high prices and sell at even higher prices!
6. Embrace the trend and go with it. The price at which you buy is not necessarily the lower, but rather the more appropriate. You will not gain an advantage just because the buying price is cheap, as a downtrend does not signal a bottom. Abandon junk coins; the trend is king.
7. Do not let the adrenaline of profits cloud your judgment. Remember, the hardest thing in the world is to sustain profits. You must carefully review whether it’s luck or skill. A stable trading system that suits you is the key to sustained profits.
8. Do not trade for the sake of trading. What does that mean? It means that when you are not sure enough that this trade will be profitable, do not force yourself to open a position. Being in cash is an art. Those who can buy are apprentices, those who can sell are masters, and those who can stay in cash are the grandmasters. The primary consideration in trading is not profitability, but capital preservation. Trading is not about frequency, but about success rate!
So how to do well in cryptocurrency trading? Once a person enters the financial market, it is challenging to turn back. If you are currently at a loss but still confused, and you plan to treat cryptocurrency trading as a second profession, you must understand 'MACD indicator techniques.' Understanding and grasping it can save you from many detours, based on personal experience and feelings. It is recommended to bookmark and ponder it repeatedly!
The MACD indicator is one of the most classic technical indicators. By correctly using this indicator in conjunction with K-lines (daily K-lines, weekly K-lines), stock trends, volume, market trends, and news, you can generally achieve good buying and selling results. Below, I will share the most comprehensive use of the MACD indicator, and those who can truly understand it are experts!
1. Explanation of the MACD Indicator
1. Concept Definition
MACD (Moving Average Convergence Divergence) describes the relationship between two moving averages, which include a fast line and a slow line. Its main function is to determine and speculate on the transformation or continuation of price trends.
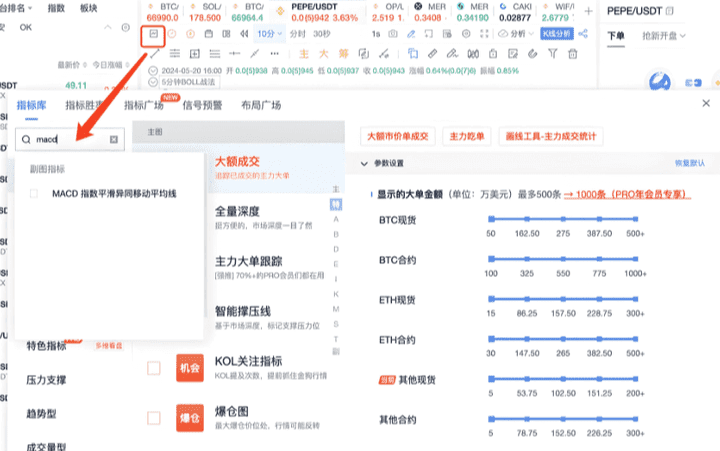
2. How to activate the MACD indicator
Open the indicator library, search for the MACD indicator, and check it. The MACD indicator will then be displayed below. Taking BTC/USDT trading on Binance as an example, when the price is 66997.99, switch to the BTC 1-hour chart and set the MACD call 1 to spot. In the original parameter settings, the short period (N1) is 12, the long period (N2) is 26, and the DEA period (M) is 9. You can use the original settings without making excessive changes.
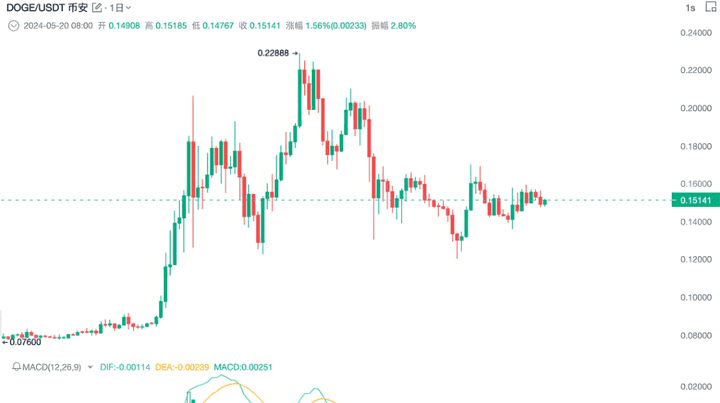
3. Green Line and Orange Line
1. Green Line (DIF, Fast Line): This is the difference between the short period (12 periods) EMA and the long period (26 periods) EMA. It is sensitive to market changes and reflects market changes over a shorter time span.
2. Orange Line (DEA, Slow Line): This is the 9-period EMA of DIF. Relatively speaking, it is smoother and reflects market changes over a longer time span, lagging behind the fast line.
3. MACD Energy Bar: It shows the difference between DIF and DEA. Through the green line, orange line, and energy bar, one can judge the market's trend and momentum changes.
2. MACD Golden Cross and Death Cross Trading Strategy
When the price is in a downtrend, and the fast line crosses up through the slow line, forming a golden cross, it means the trend may change from falling to rising, which is a trading opportunity for going long.
When the price is in an uptrend, and the fast line crosses down through the slow line, forming a death cross, it indicates that the trend may change from rising to falling, making it a reasonable short entry point.
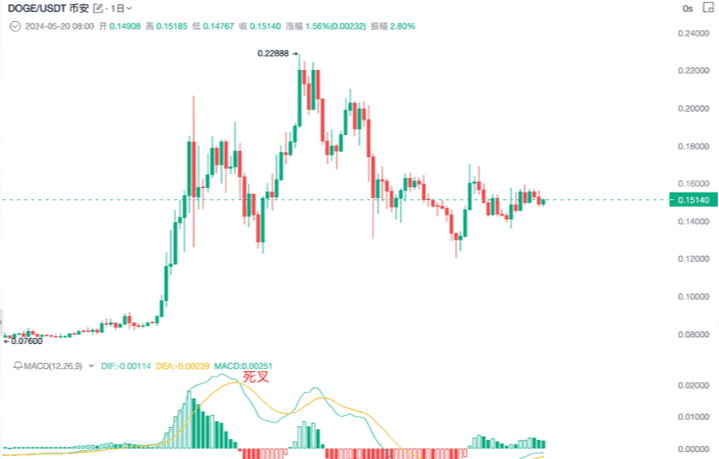
This is the traditional use of MACD.
3. MACD Divergence Trading Strategy
1. MACD Top Divergence
When the price's high point is higher than the previous high, this is a peak-peak-high.
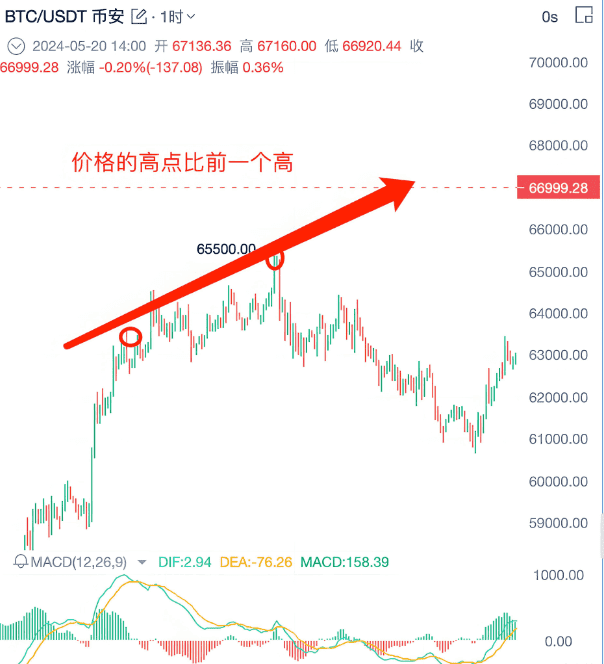
When the price's high point is higher than the previous high, it forms a peak-peak-high. Under normal circumstances, the MACD should also form a peak-peak-high to match the price's trend momentum.
If the MACD forms a peak-top-low at this time, it indicates that the price trend momentum is showing signs of weakening.
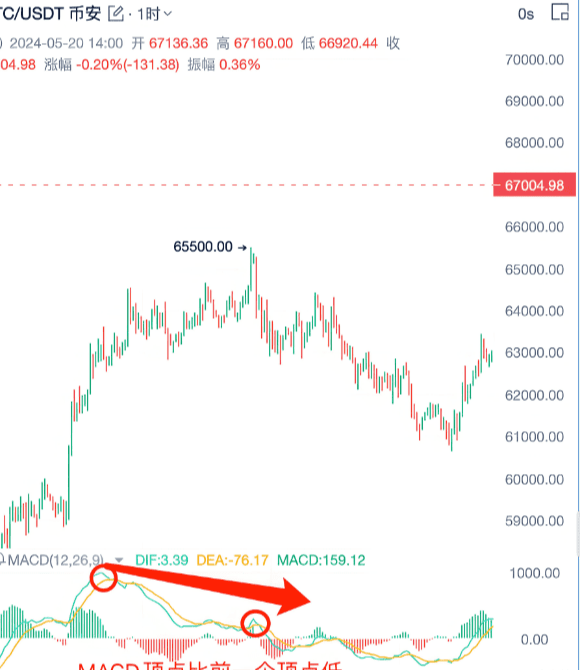
When the price forms a peak-peak-high but the MACD forms a peak-peak-low, this is a top divergence, and the price trend is likely to change downward.
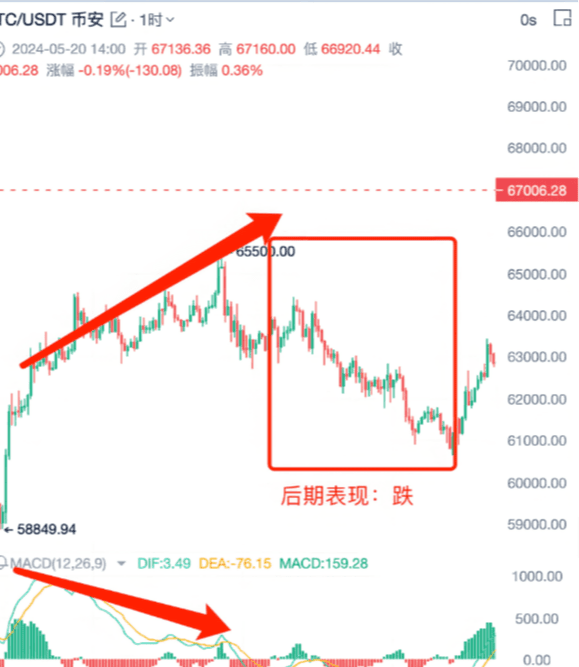
To confirm the trend, you need to find key price levels and MACD trend reversal divergence.
2. MACD Bottom Divergence
When the price's low point is lower than the previous low, this is a bottom-bottom-low.
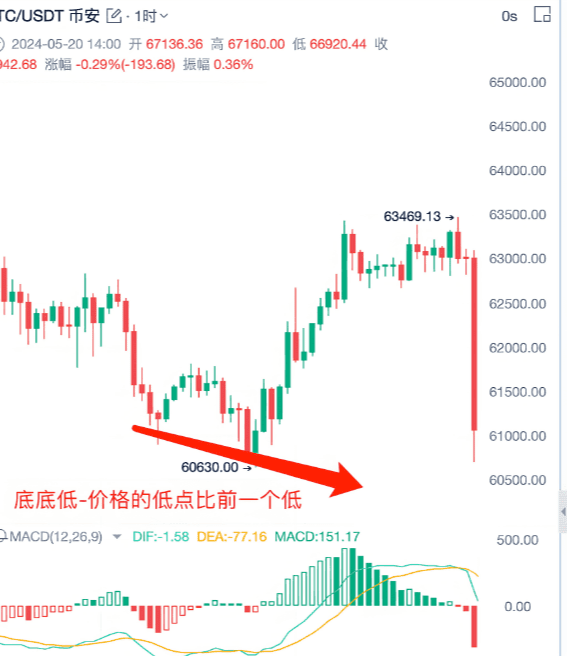
If the MACD forms a bottom-bottom-high, it means that buying momentum is beginning to intervene, and the downward momentum of the price is gradually weakening.
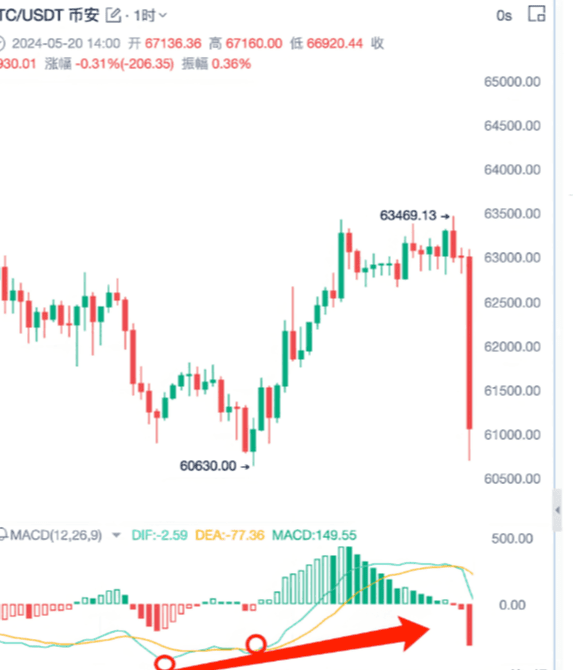
There is a high probability that the trend will change from a downtrend to an uptrend. When the price forms a bottom-bottom-low, but the MACD forms a bottom-bottom-high, this is a bottom divergence. When the bottom divergence forms, it means the trend is likely to change to an uptrend, which is a reasonable opportunity to buy long.
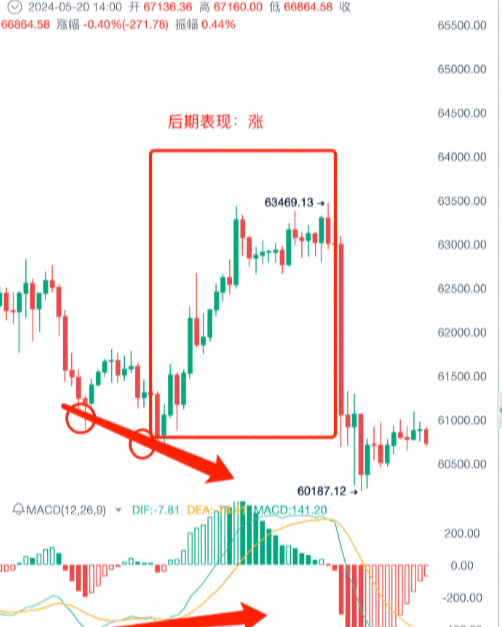
3. MACD Trend Reversal Trading Strategy
Key price levels and MACD trend reversal divergence: Find a line connecting two peaks, and simultaneously find the corresponding two peaks at the bottom of the MACD. #Strategy to increase Bitcoin holdings.
Judging key support levels: When the price tests a certain support level multiple times and then experiences a significant increase, that support level is a key support level. When the price returns to the key support level, you can look for a trading signal to go long.
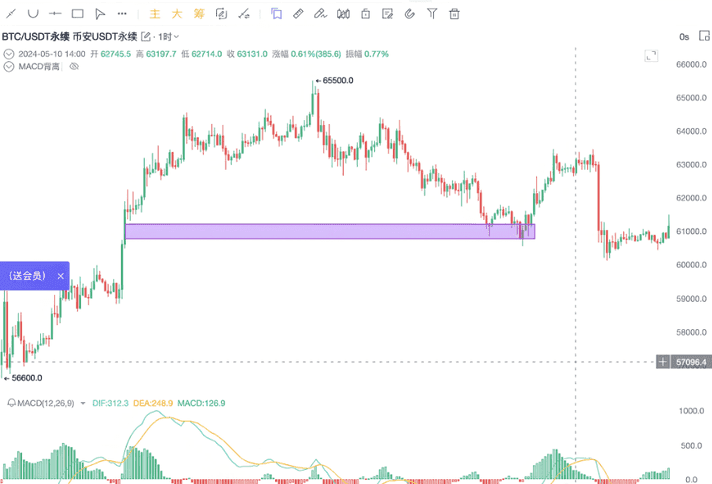
For example, when we find a mountain peak that has already gone through a round of fluctuations and returns to the support level.
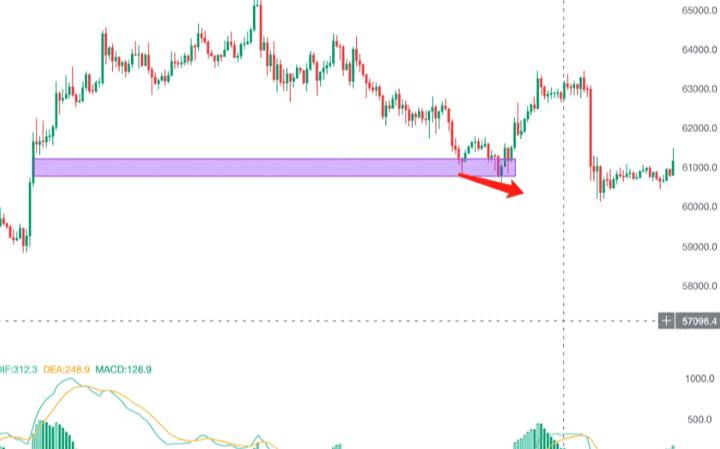
For example, when the price returns to the support level after a round of fluctuations, you cannot directly go long; you need an additional signal to confirm the validity of the bottom divergence. You can draw a downtrend line, and if it forms a descending wedge triangle (a bullish chart pattern), when the price breaks out of the descending wedge triangle, you can enter the market to go long.
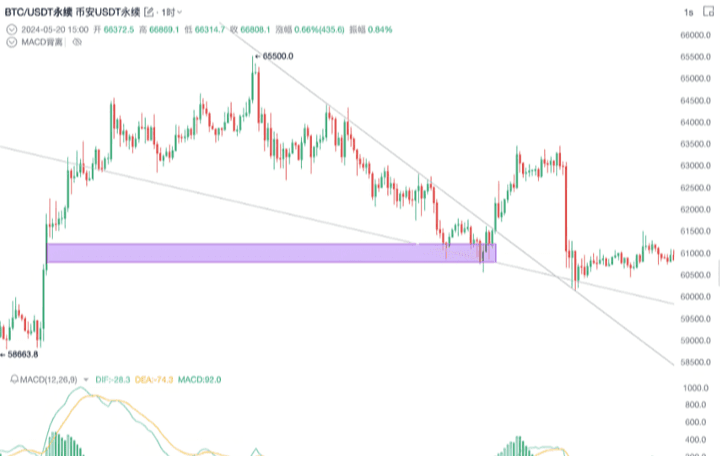
You can see this is a descending wedge triangle, which is a bullish chart pattern. When the price breaks out of this descending wedge triangle, we can enter the market to go long.
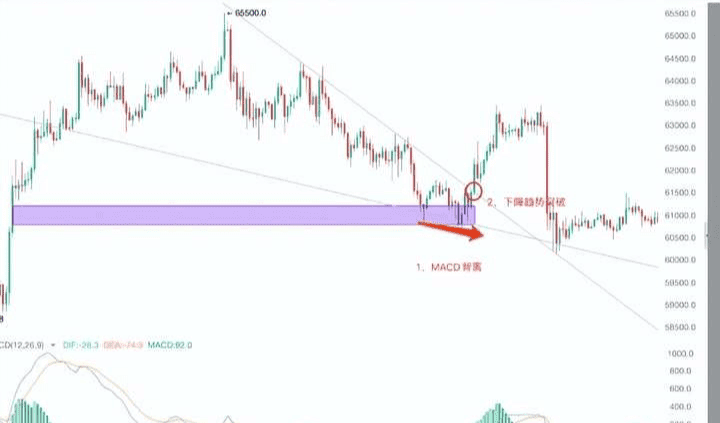
If these two points are met, and the downtrend line is broken, consider going long. Draw a line from the previous high in the downtrend. When the price breaks above the previous high, it represents a trend break, and the price is likely to change from a downtrend to an uptrend. You can enter the market after the price breaks above the previous high. In summary, trading must combine key price levels and MACD trend reversal divergence. In short: key price levels + MACD trend reversal divergence.
4. How to find support levels?
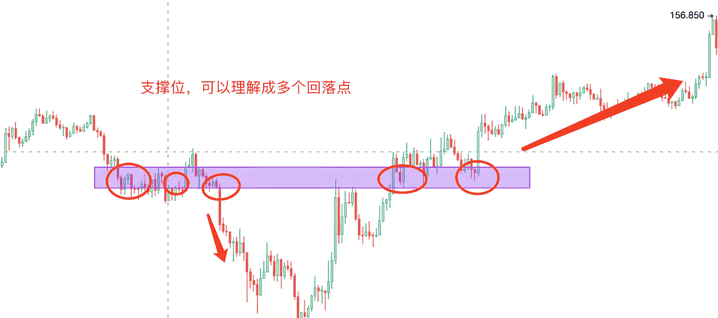
Support levels can be understood as multiple retracement points that form valleys or peaks. At the foot of the mountain, prices will retrace multiple times. Support levels can be a small price range or a specific point. At the same time, it is essential to combine MACD divergence and key price levels to determine whether the support level is broken.
The above are the most practical MACD trading strategies. These techniques can be used in different markets, different varieties, and different periods, suitable for most traders to learn and use.
I am Wenhua, a professional analyst and teacher, a mentor and friend on your investment journey! As an analyst, the most basic thing is to help everyone make money. I will help you solve confusion and provide strength in your trading. When you are lost and don’t know what to do, follow me, and Wenhua will guide you.
Keep following;$BTC $ETH
#加密市场回调 #美联储7月会议纪要 #加密概念美股普涨


