
XRP closed a daily candle below the psychological level of $3 on Tuesday, extending a two-week correction. While the short-term trend appears negative, the long-term outlook remains optimistic, thanks to a repeating market fractal pattern.
Market Fractal Concept
Market fractals refer to the repeating price structures observed across different time frames, where similar setups often yield similar outcomes. On XRP's daily chart, the current structure reflects a pattern recorded earlier this year. In January 2025, XRP's price rose to $3.40 before stabilizing down to $1.60 in April.
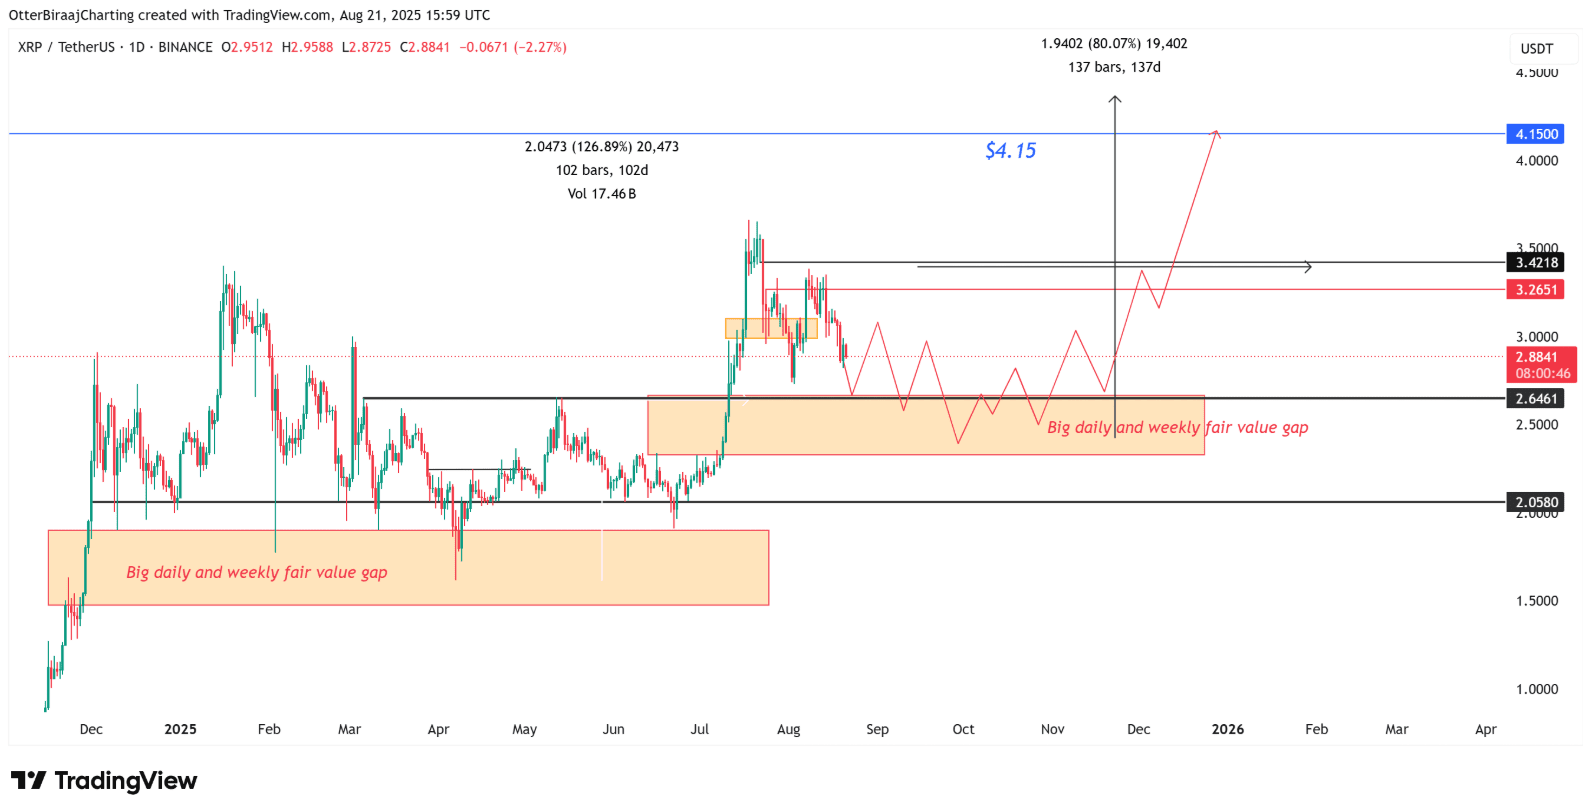
This local bottom emerged after the price touched liquidity in both daily and weekly fair value gaps (FVG). Imbalances in higher time frames are often more weighted as they highlight areas where large traders' buy orders and liquidity are concentrated.
Current Situation and Future Predictions
In July, XRP made a strong recovery, establishing a new local high at $3.66. Currently, the chart outlines a similar setup, with a new clear FVG lying between $2.32 and $2.66. If this imbalance is filled, the likelihood of a new expansion phase will increase, setting the stage for a potential breakout.
Based on a declining profit ratio, XRP could record an increase of 60% to 85% in Q4, with the potential to rise up to $4.35. The key turning point is at $3.85; surpassing this level, XRP will enter a price discovery phase.
Combined with favorable macroeconomic factors, such as the potential for U.S. interest rate cuts, XRP could maintain momentum beyond initial targets, extending the bullish run in the coming weeks. While short-term volatility remains likely, the overall structure indicates continued bullishness into Q4.
XRP Whale Flow: Signs of Exhaustion
Recent on-chain data shows that large XRP holders, also known as 'whale addresses,' are reducing their positions; however, selling pressure is approaching exhaustion.
A similar wave of selling pressure was recorded in Q2, coinciding with XRP's broader correction. Currently, the 90-day moving average of net whale flow shows a peak in distribution, which may turn positive as prices trend downwards.
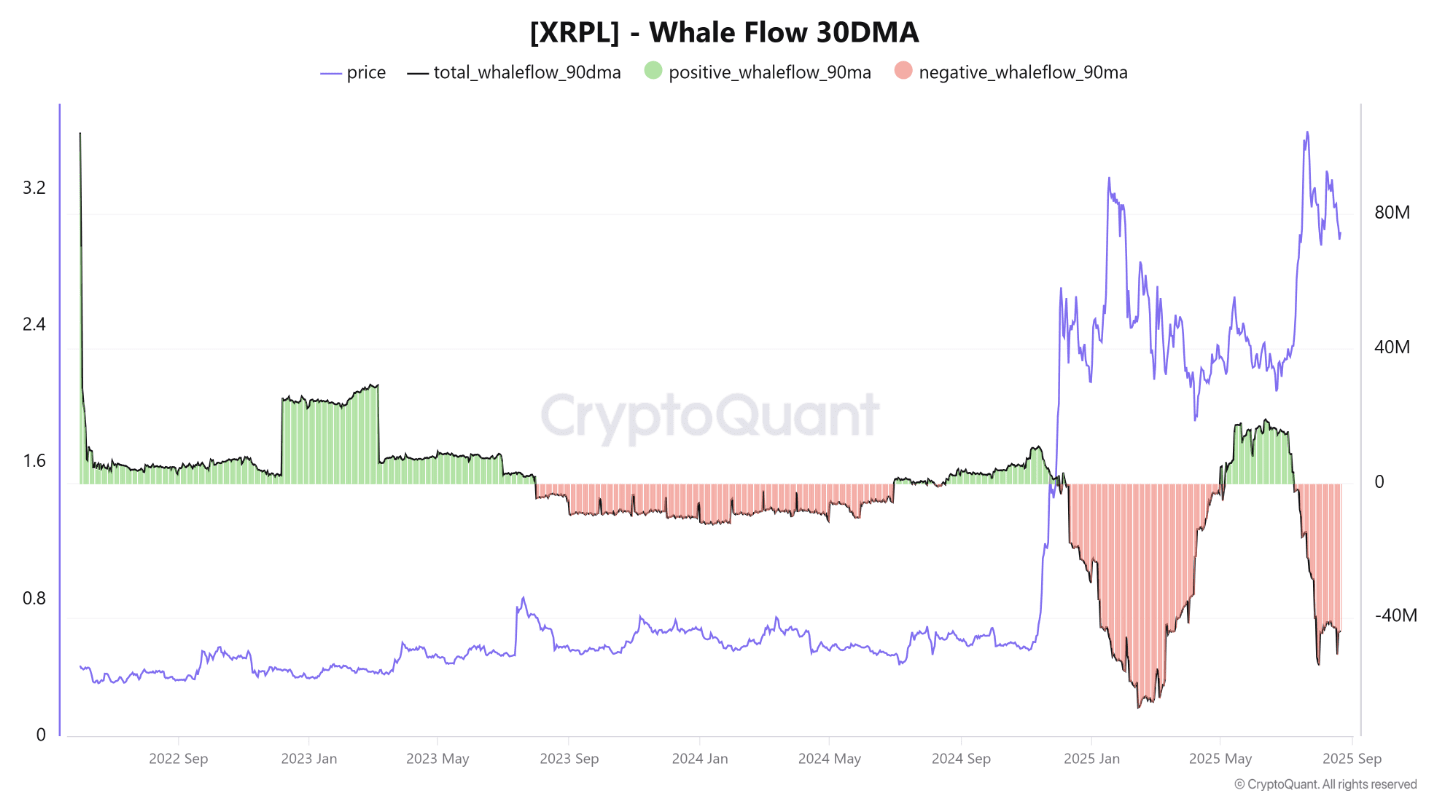
History has shown that whale activity plays a crucial role in shaping market direction. In the second half of 2024, significant accumulation occurred in the range of $2.00 to $2.50, where whales built large positions ahead of XRP's bullish run. A similar setup may be unfolding, with accumulation zones likely reappearing around $2.65–$2.33.
