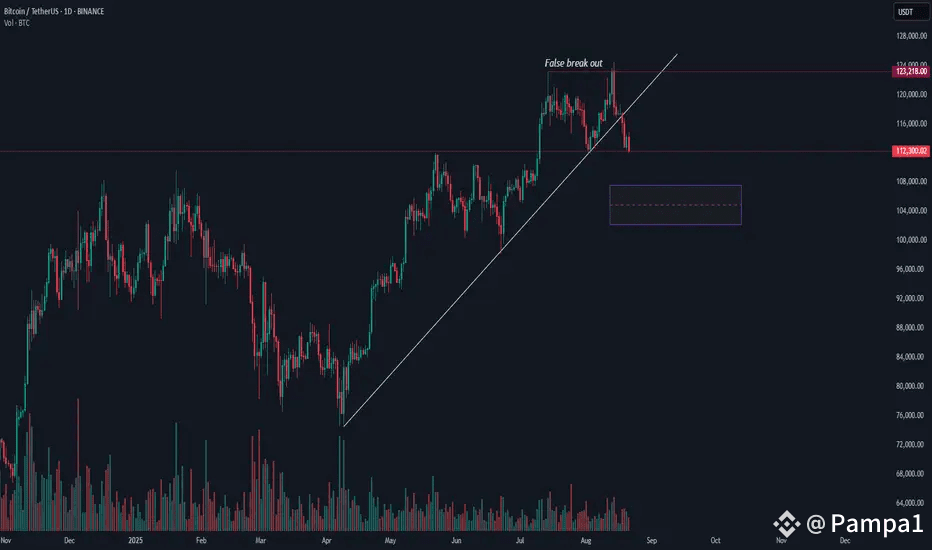
Bitcoin teased traders with a breakout above $123.2K—but quickly got shut down. That caught my attention.
A TradingView chart titled “BTC Analysis” shows a false breakout above 123,218 USDT, followed by a sharp rejection. That move also shattered an ascending trendline that’s been in place since April. Taken together, it’s a clear sign that momentum has shifted. The chart suggests Bitcoin may drift toward the 104K–108K demand zone unless it stages a strong rally above 123.2K soon .
It's not dramatic. But it's concrete. Traders who chased the breakout might watch their screens closely now. If that demand zone proves solid, we’ll likely see some buying interest. If not, the slide could extend further.
Keep an eye on the 123K level. Holding above it changes the story. Falling away might confirm a deeper pullback.
What’s your plan if Bitcoin heads lower—wait, buy, or bail?