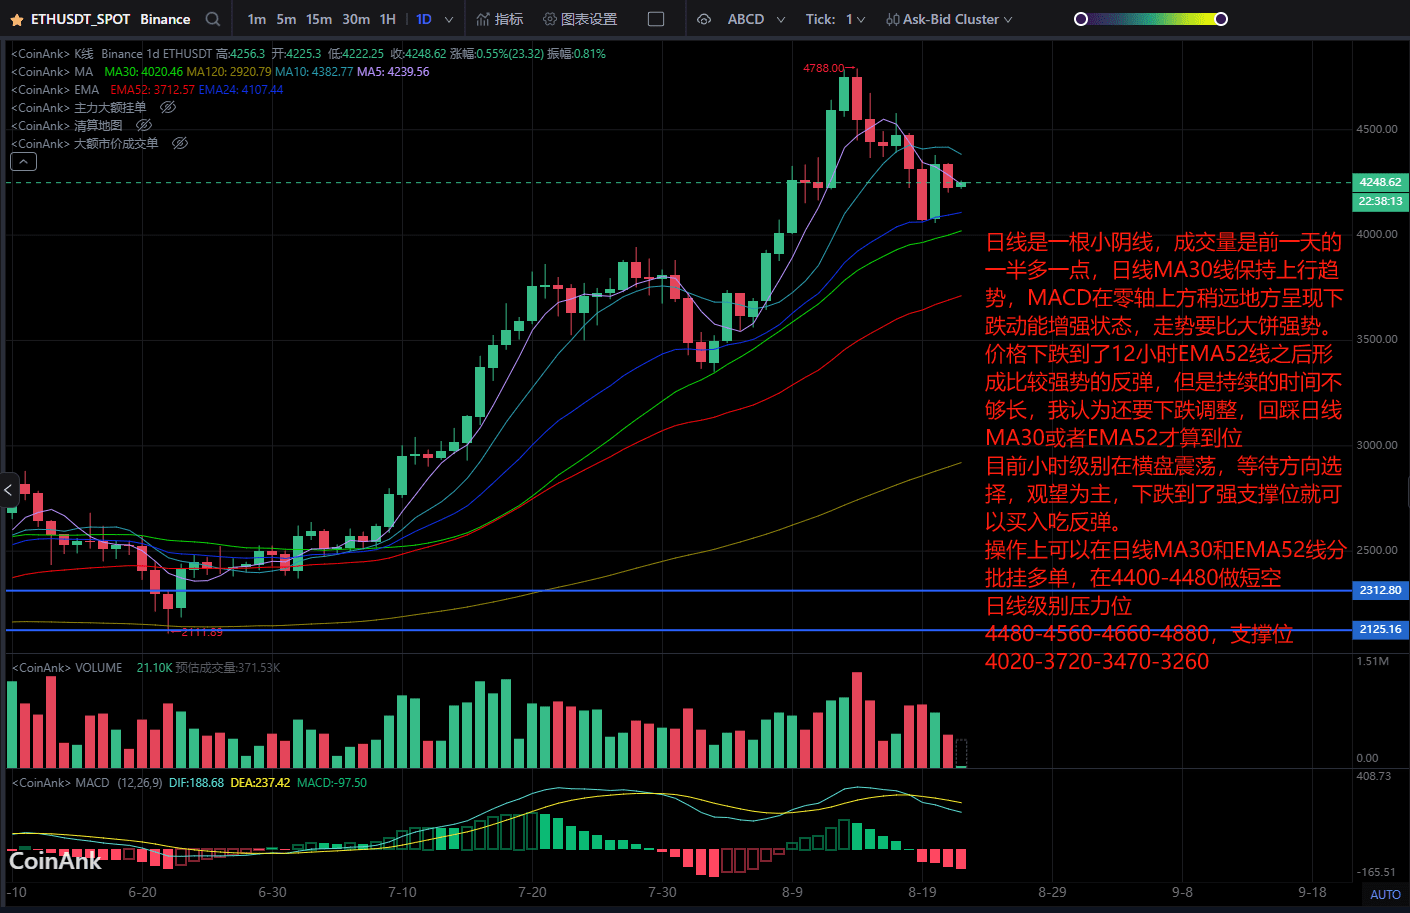
The daily chart shows a small bearish candle, with volume a little more than half of the previous day. The daily MA30 line maintains an upward trend, and the MACD shows enhanced bearish momentum slightly above the zero axis. The trend is stronger compared to Bitcoin.
After the price drops to the 12-hour EMA52 line, a relatively strong rebound forms, but the duration is not long enough. I believe further downward adjustment is needed, and a retest of the daily MA30 or EMA52 is necessary to confirm.
Currently, the hourly level is in a sideways consolidation, waiting for direction selection, mainly observing. When the price drops to a strong support level, it can be bought to take advantage of the rebound.
Operationally, you can place buy orders in batches at the daily MA30 and EMA52 lines, with short positions at 4400-4480.
Daily level resistance at 4480-4560-4660-4880, support at 4020-3720-3470-3260.