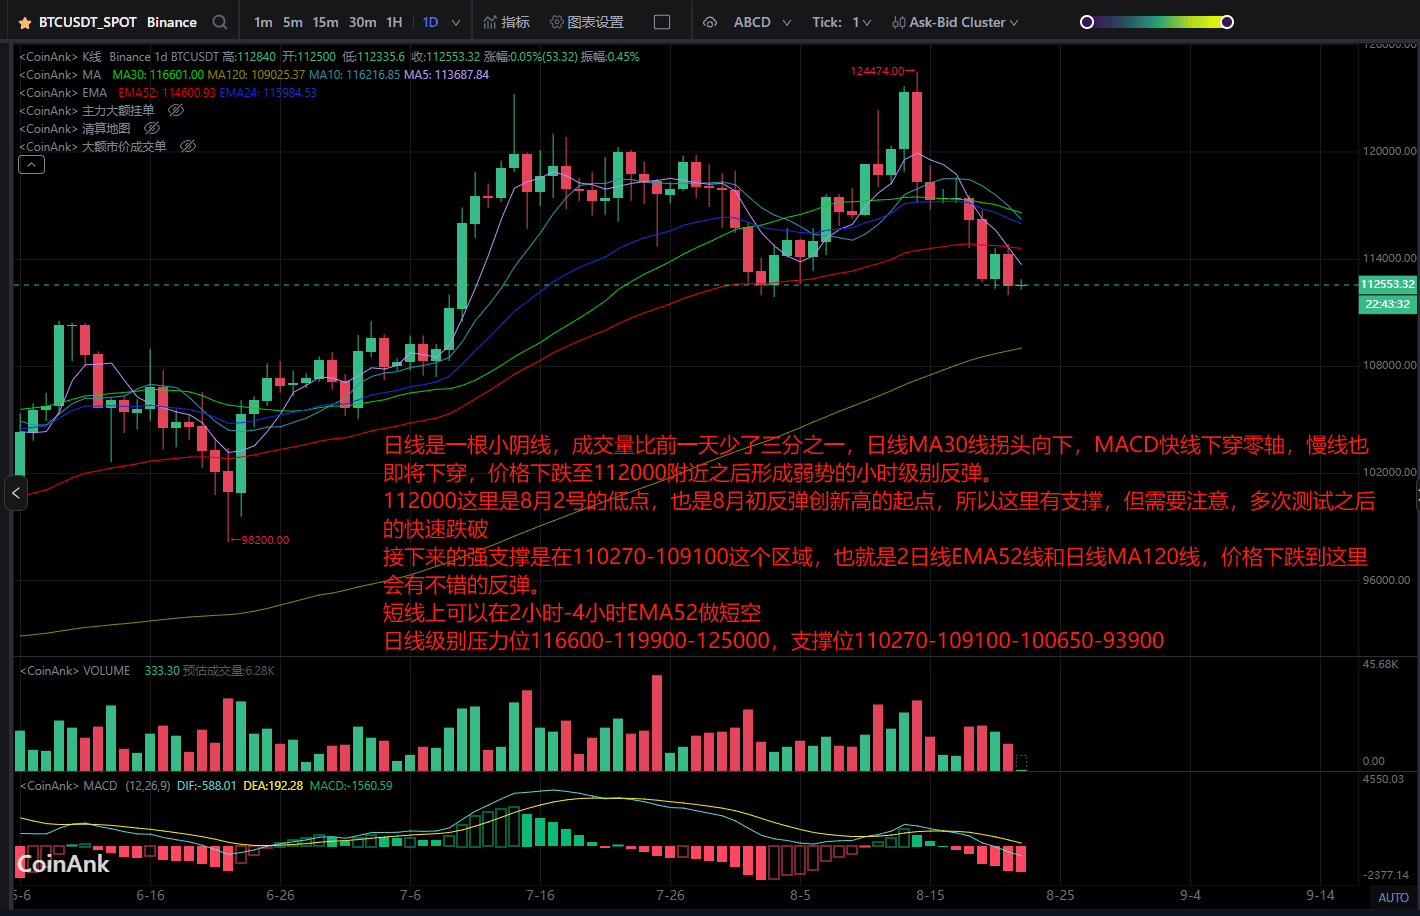
The daily line is a small bearish candle, with trading volume down by one-third compared to the previous day. The daily MA30 line is turning downward, the MACD fast line is crossing below the zero axis, and the slow line is also about to cross below. After the price drops to around 112000, a weak hourly-level rebound forms.
112000 is the low point from August 2, and also the starting point for the early August rebound to a new high, so there is support here, but caution is needed for a rapid breakdown after multiple tests.
The next strong support is in the 110270-109100 range, which is the EMA52 line of the 2-day line and the MA120 line of the daily line. A drop in price to this area will likely see a good rebound.
Short positions can be initiated on the 2-hour-4-hour EMA52.
Daily-level resistance levels are 116600-119900-125000, and support levels are 110270-109100-100650-93900.