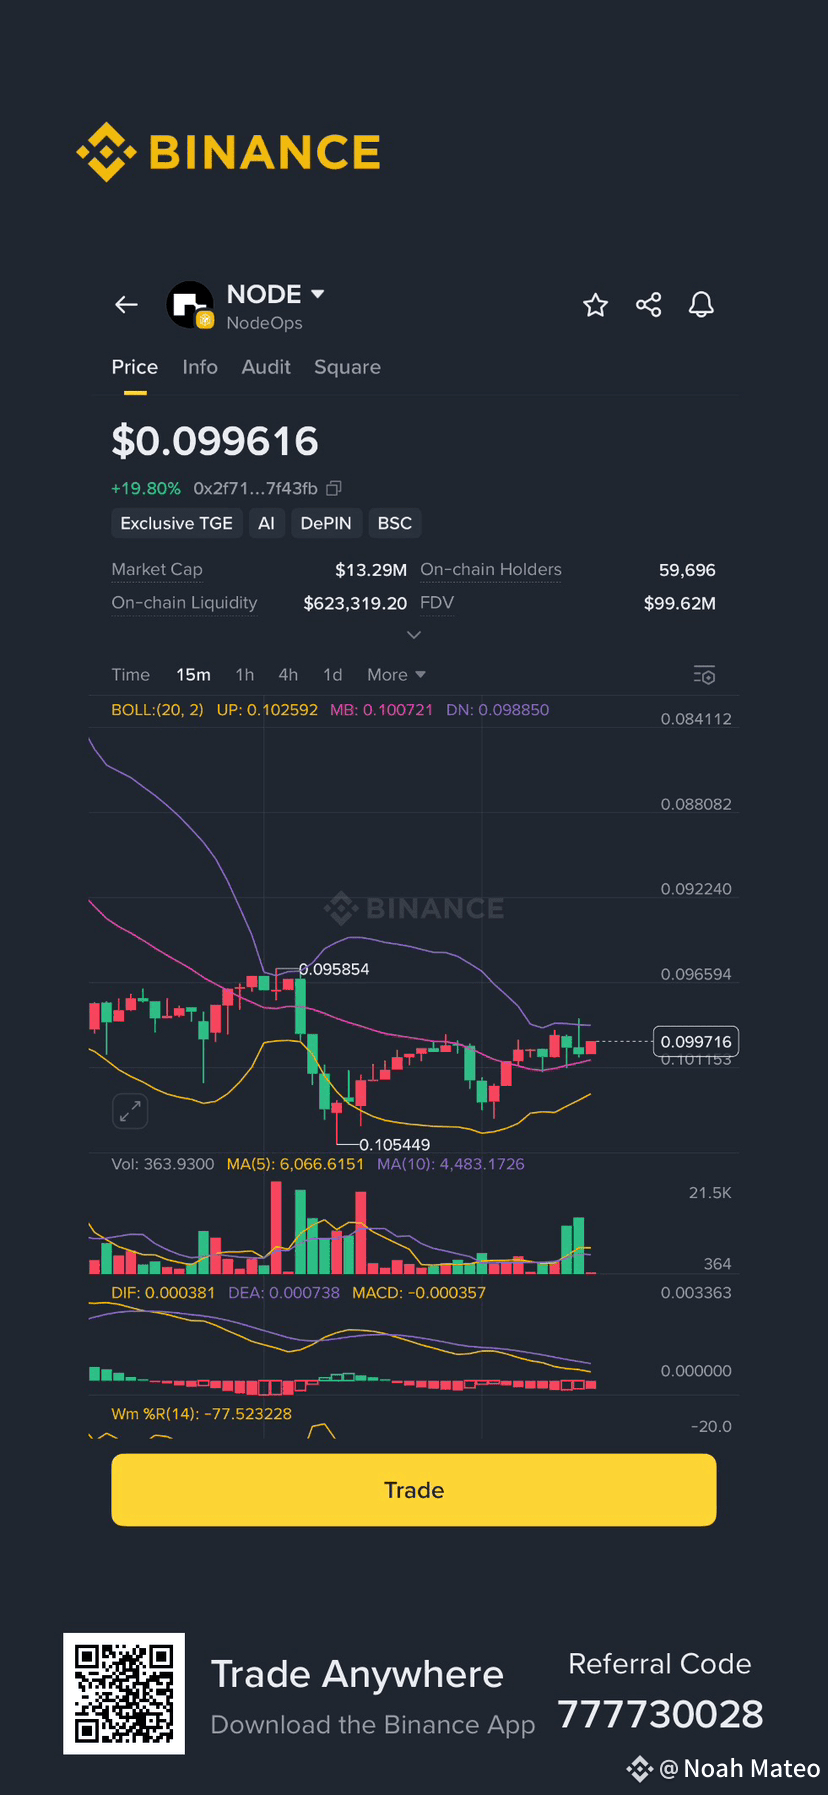
Price and Market Performance:
As of the snapshot in the image, the price of NODE stands at $0.099616. This represents a significant price increase, with the chart showing a recent +19.80% surge. This kind of upward momentum is a strong indicator of growing investor interest and positive market sentiment.
The market metrics further highlight NODE's potential. The Market Cap is listed at $13.29M, and the On-chain Liquidity is a robust $623,319.20. These figures, coupled with a healthy number of On-chain Holders (59,696), suggest a project with a decent level of maturity and a distributed ownership base, which can lead to greater stability. The 24-hour trading volume, at $99.62M, is particularly impressive, indicating a high level of trading activity and liquidity, making it easy for investors to enter or exit positions.
The DePIN Connection: A Game-Changer
The image clearly labels NODE with the DePIN tag. This is a crucial piece of information. DePIN, which stands for Decentralized Physical Infrastructure Networks, is a burgeoning sector in the crypto space. These projects leverage blockchain technology to create and manage real-world physical infrastructure, such as wireless networks, data storage, or energy grids. By decentralizing these networks, DePIN projects aim to offer more efficient, secure, and democratic alternatives to traditional, centralized services.
The fact that NodeOps is associated with this trend suggests that NODE is not just another speculative asset. It likely has a real-world use case related to decentralized infrastructure, which gives it intrinsic value beyond just market speculation. This fundamental utility is a strong selling point for long-term investors.
Technical Analysis: What the Charts Are Saying
The provided chart gives us a wealth of information for technical analysis.
Bollinger Bands (BOLL(20, 2)): The chart shows the price moving within the Bollinger Bands, with the upper band at $0.102592, the middle band at $0.100721, and the lower band at $0.098850. The price is currently near the middle band, suggesting it's in a relatively stable zone after its recent rise.
Moving Averages (MA): The chart displays two moving averages. The MA(5) is at 6.066,6151 and the MA(10) is at 4.483,1726. The crossing of these moving averages, or their relative positions, can be a key indicator for short-term price movements.
MACD: The MACD (Moving Average Convergence Divergence) is at -0.000357, with the Signal Line (DEA) at -0.000738. While both are in the negative, the MACD is rising towards the Signal Line, which could signal a potential bullish crossover in the near future.
Williams %R (Wm %R): The Williams %R is at -77.523228. This indicator is used to identify overbought and oversold conditions. A reading below -80 suggests the asset is oversold, while a reading above -20 suggests it's overbought. At -77.523228, NODE is not yet in the oversold territory, but it is moving closer to it, suggesting there might be a minor pullback before a potential further rally.
Why NODE is an Attractive Investment:
Fundamental Utility: As a DePIN token, NODE likely has a real-world application, which provides it with a value proposition beyond pure speculation.
Strong Market Momentum: The +19.80% price increase and the high trading volume indicate strong and growing interest from the market.
Listed on Binance: Being traded on a major exchange like Binance provides legitimacy, liquidity, and a vast user base, making it easily accessible to global investors.
Positive Technical Indicators: The charts show a project with healthy trading activity and technical signs that could lead to continued growth.
For those looking to diversify their portfolio with an asset that combines high growth potential with a strong narrative in the booming DePIN sector, NODE presents a compelling opportunity. Remember to always conduct your own research (DYOR) before making any investment decisions.