The price of BNB jumped about 14% in the last 30 days and recently touched its all-time high at $881. While the price is now trading just 2% below this level, what matters more is how it maintains stability above the key resistance.
In just the past 24 hours, BNB has risen another 3.4%, showing strong interest from buyers. Two key on-chain signals suggest that this rise may not be a fleeting event. Both long-term and mid-term holders support this rise.
Coin holders are buying on strength and they are not alone.
The chart below displays HODL waves for BNB — a metric that measures how long investors have held their tokens without selling. It divides all BNB holders into age categories. The key here is the behavior of two specific groups: long-term holders (1–2 years) and medium-term conviction buyers (3–6 months).
On July 21, the age group of 1–2 years held only 6.56% of the supply. This figure grew to 7.49% as of August 20. Similarly, the age group of 3–6 months rose from 1.5% to 7.3%. These are significant increases, especially as the price of BNB rose during the same period.
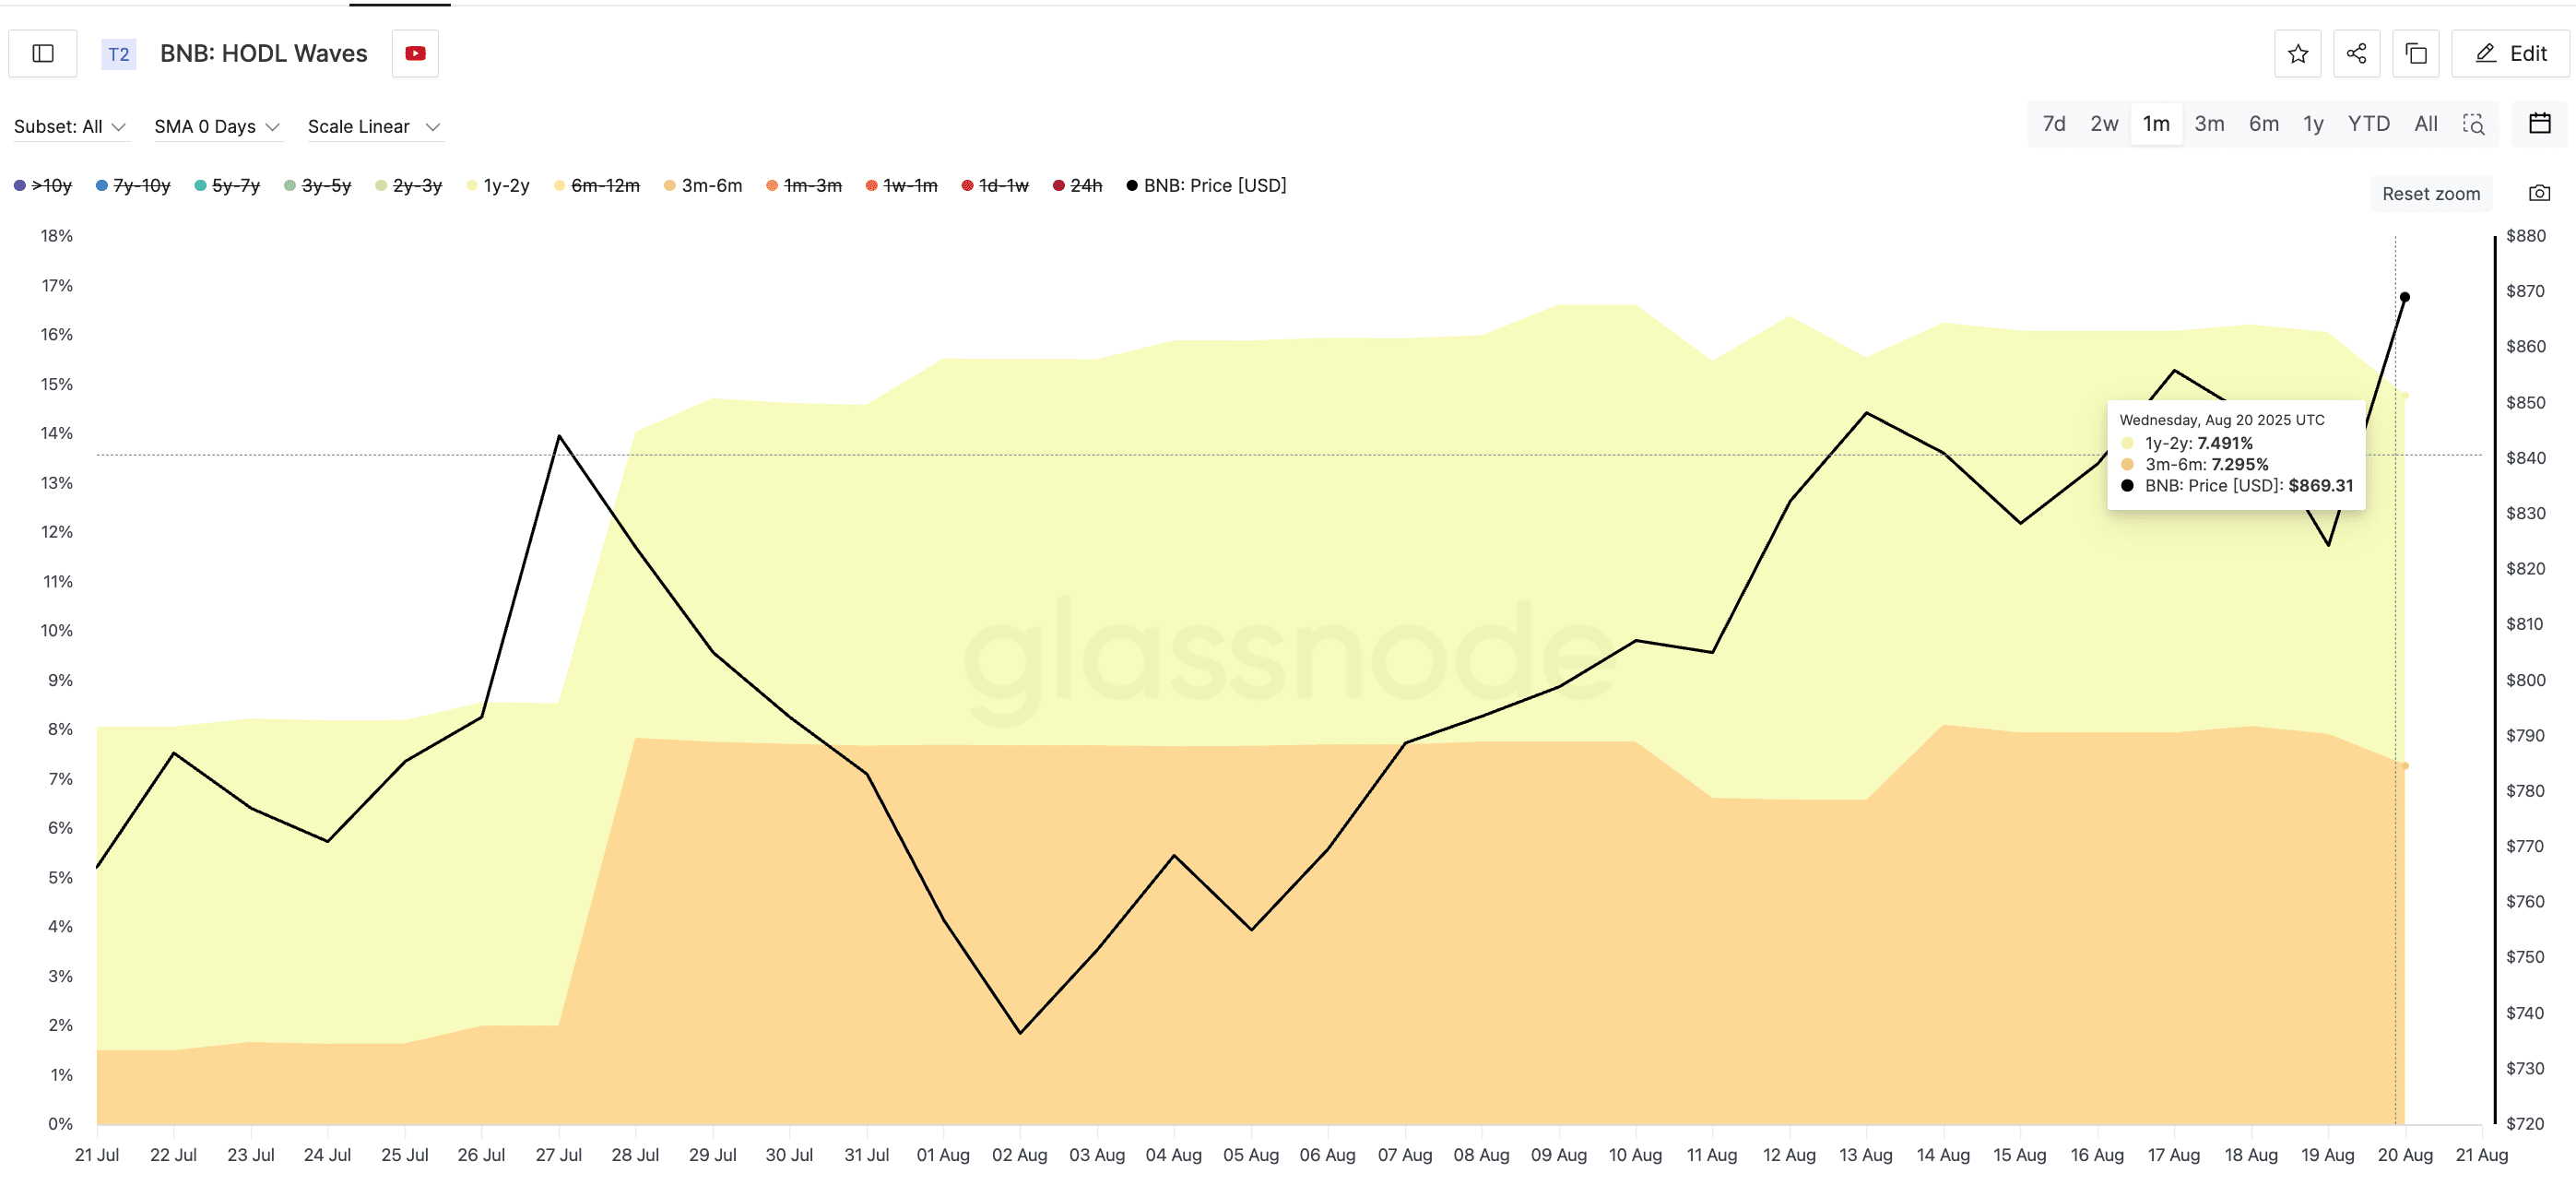
This type of accumulation does not occur during a decline. It happens during a 14% increase in BNB price, which means these holders are not waiting for a pullback. They are stepping in with strength.
Now look at the exchange balances. Between August 19 and 20, the price of BNB jumped from $824 to $869. During the same period, exchange balances fell from 31.91 million to 31.38 million BNB — a drop of 530,000 tokens in one day.
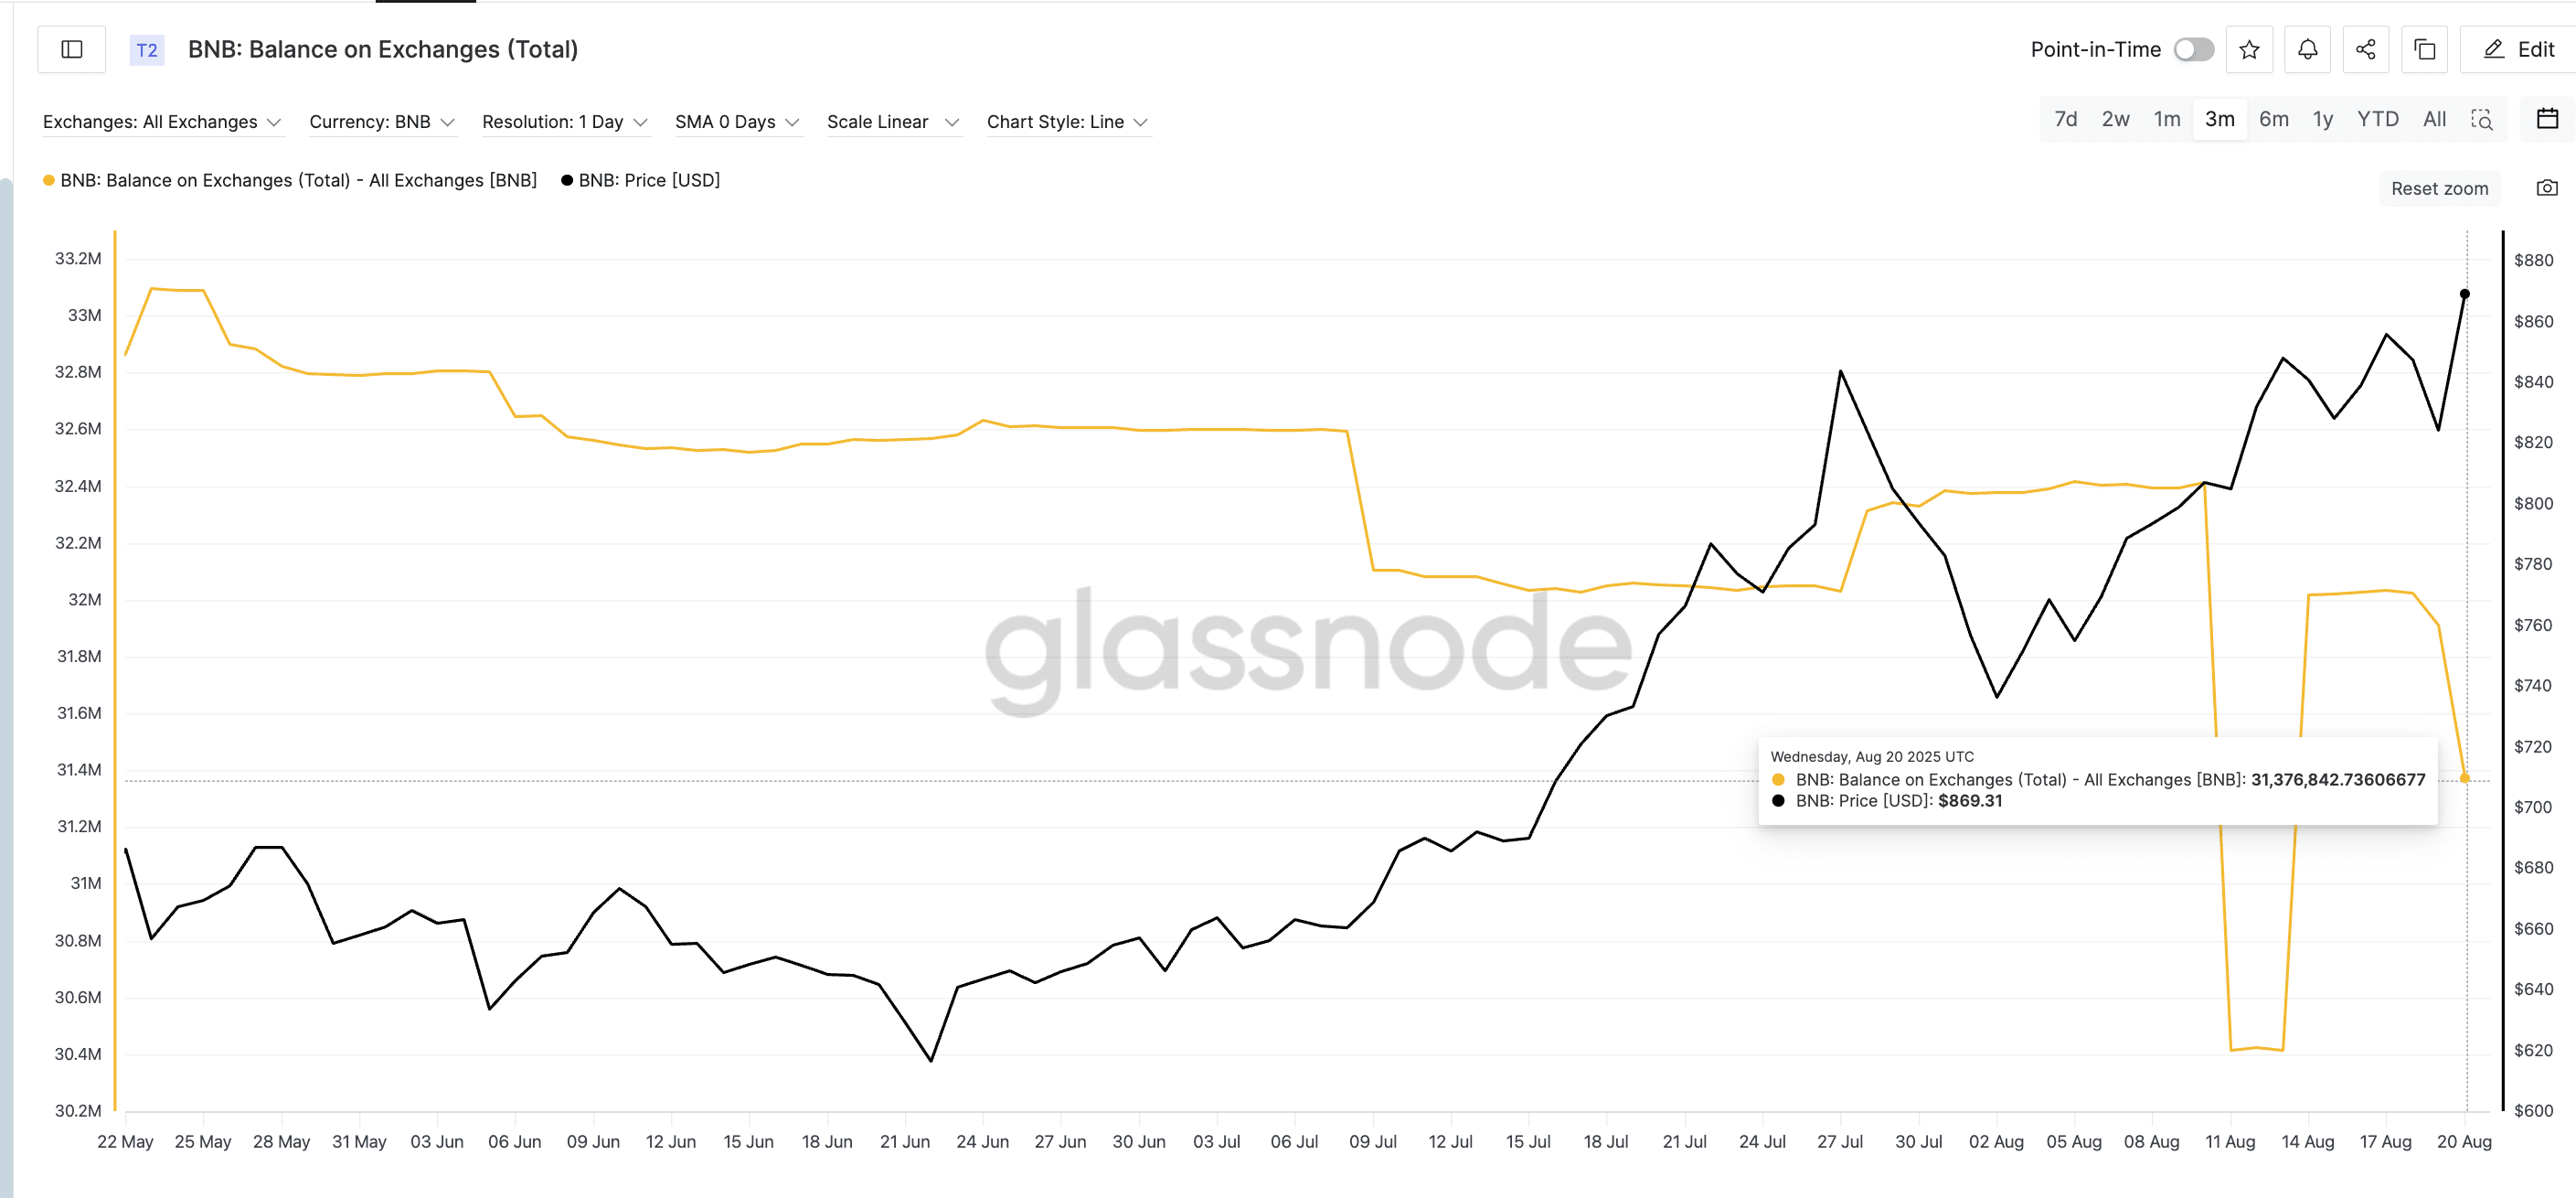
This means that traders were not sending coins to sell. They were withdrawing coins. With the rise in HODL ranges, this is clear: BNB holders are expecting higher prices.
The price movement of BNB confirms that $881 was just the first barrier.
The rise in BNB price was not random. It followed a clear upward trend, with pullbacks respecting Fibonacci retracement levels. The chart shows a Fibonacci extension based on the trend drawn from the last push: $730 (the start) to $864.95 (the peak), retracing to $812.
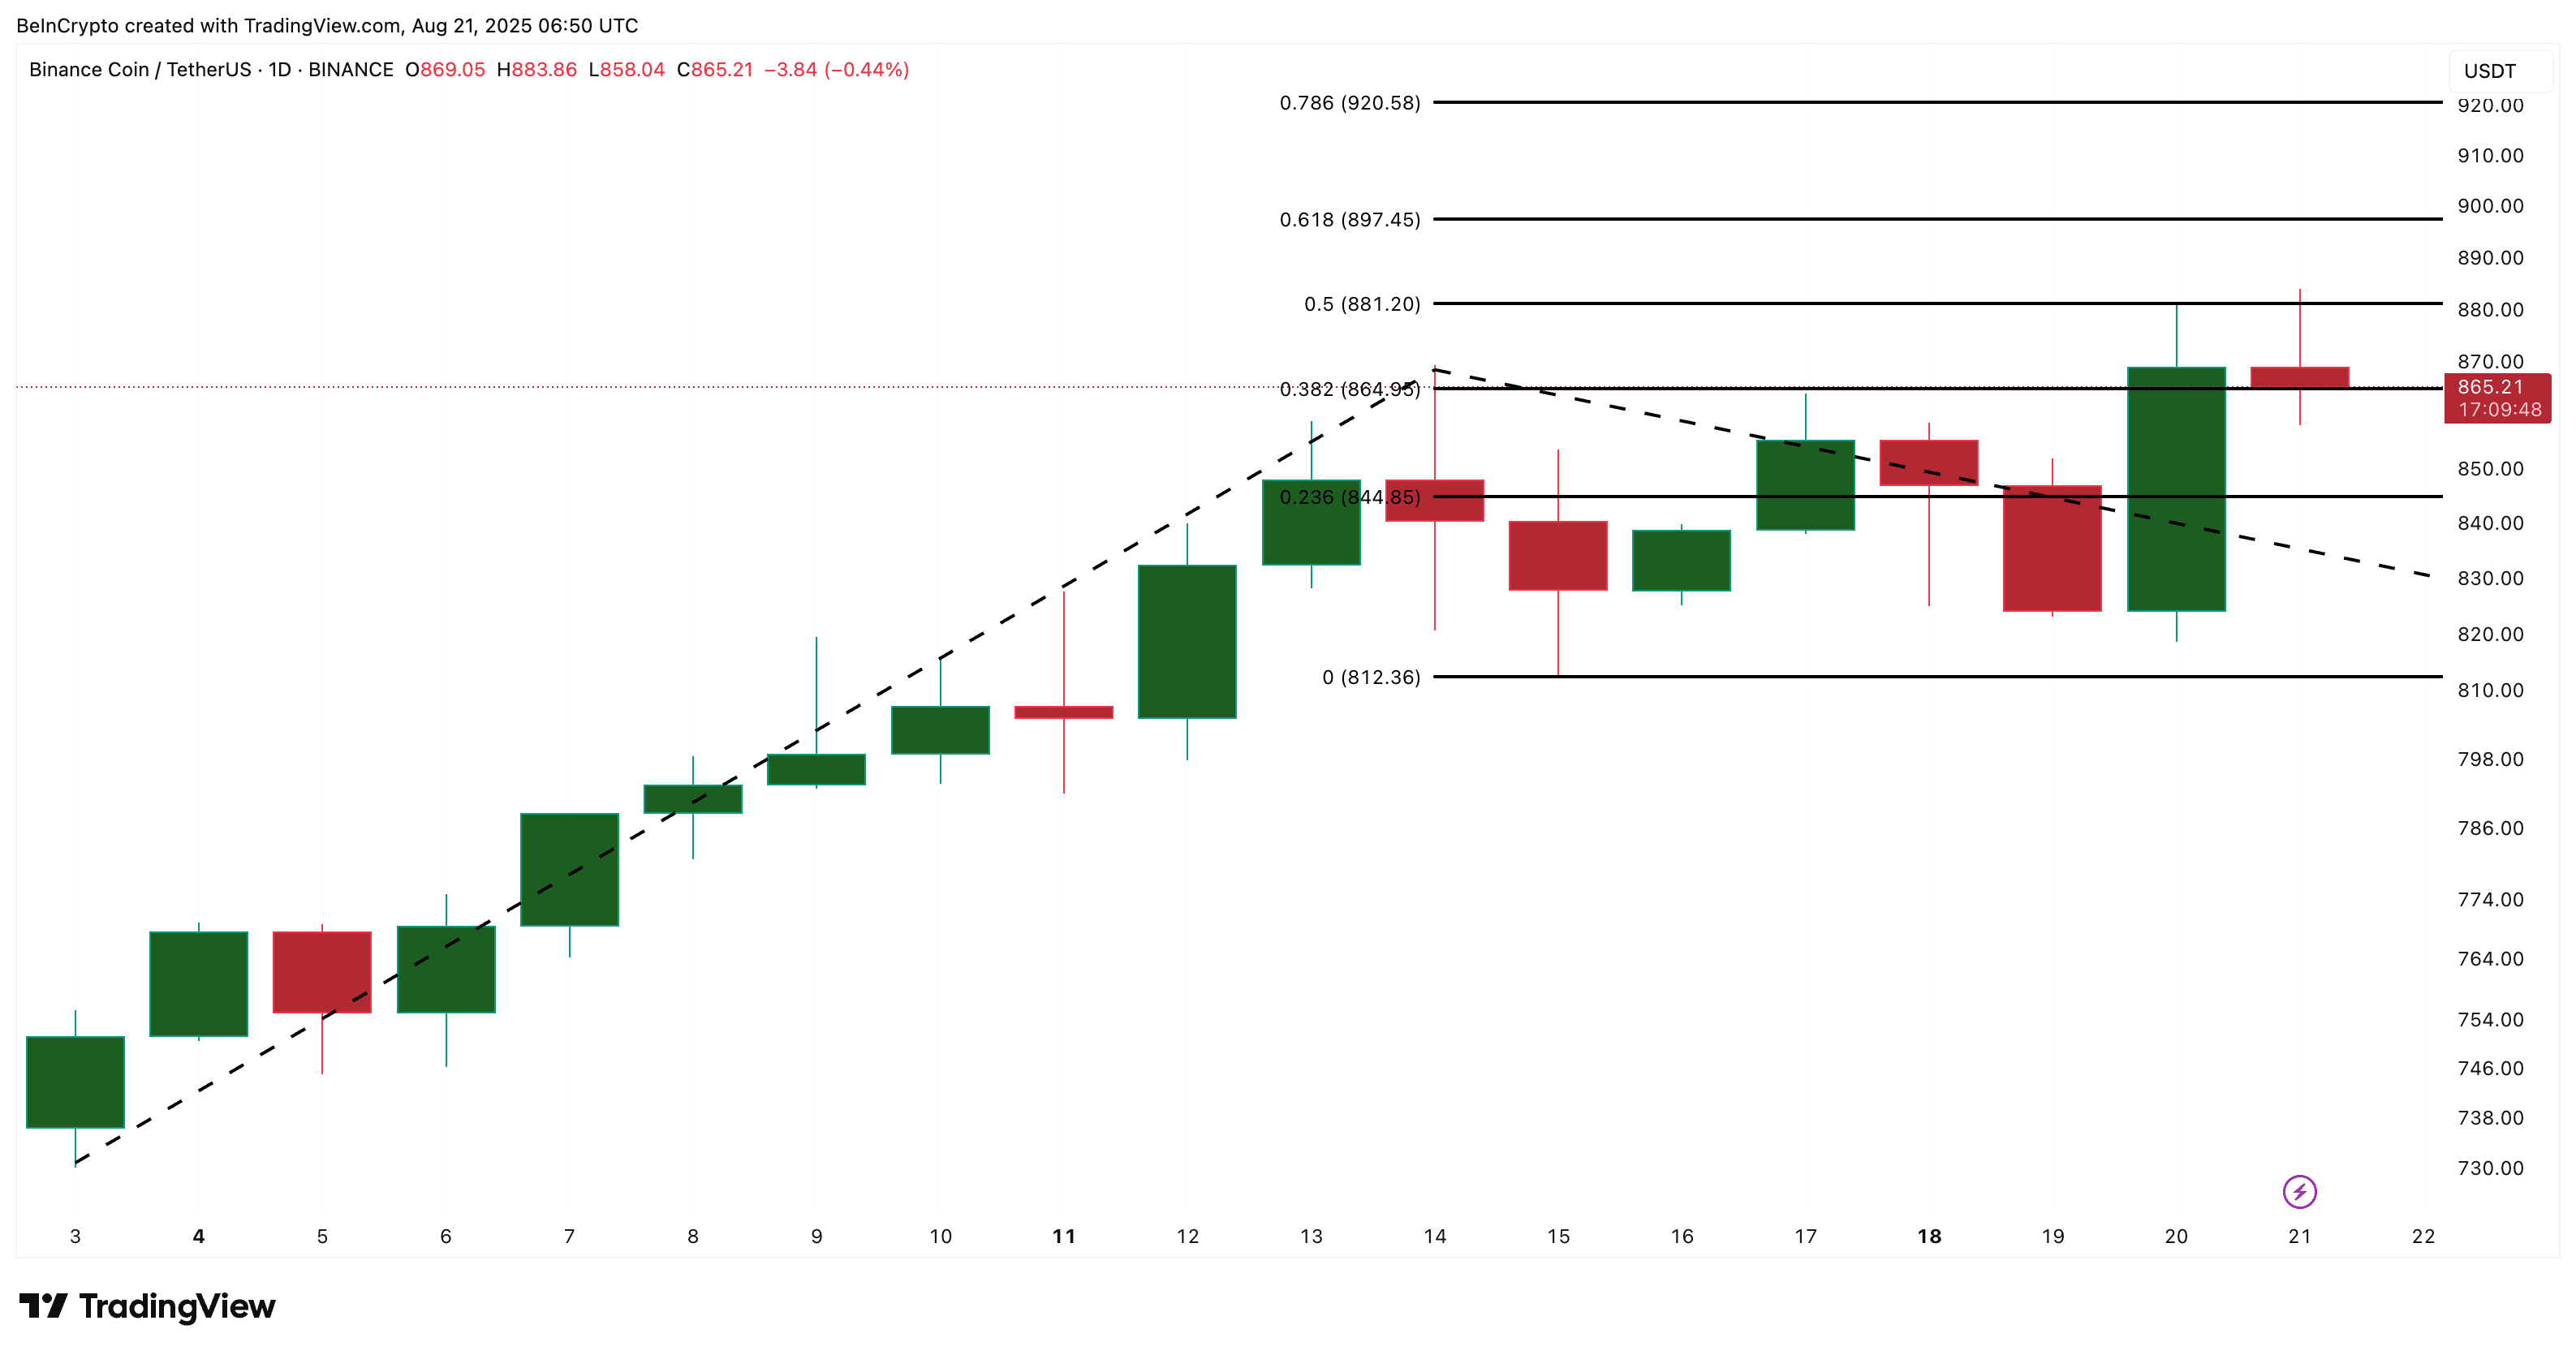
Accordingly, the level of 0.5 — $881 — acted as a clear resistance and was tested almost perfectly. This test defined the all-time high for BNB. If this resistance is broken, the next Fibonacci levels open at $897 and $920; both would be new all-time highs.
But there is one risk. If the price of BNB falls below $812, it weakens the trend structure. The level acted as a key correction area, and losing it would change the sentiment. But even then, the setup prefers to continue.
