The price of XRP has risen by less than 1% in the past 24 hours but is still down by more than 15% this month. Despite a strong July, the asset is sending short-term bearish signals again.
Whale activity has surged sharply, and EMAs are close to confirming another bearish crossover, with key price levels under threat. All three signs point to a potential short-term decline - especially for traders looking to play the next wave of volatility.
Whale inflows to exchanges have historically preceded sell-offs.
Whale flows to Binance have started to rise again after being low since August 13. On that date, flows peaked at around 29,805 XRP, and the price of XRP dropped from $3.27 to $3.08 shortly thereafter.
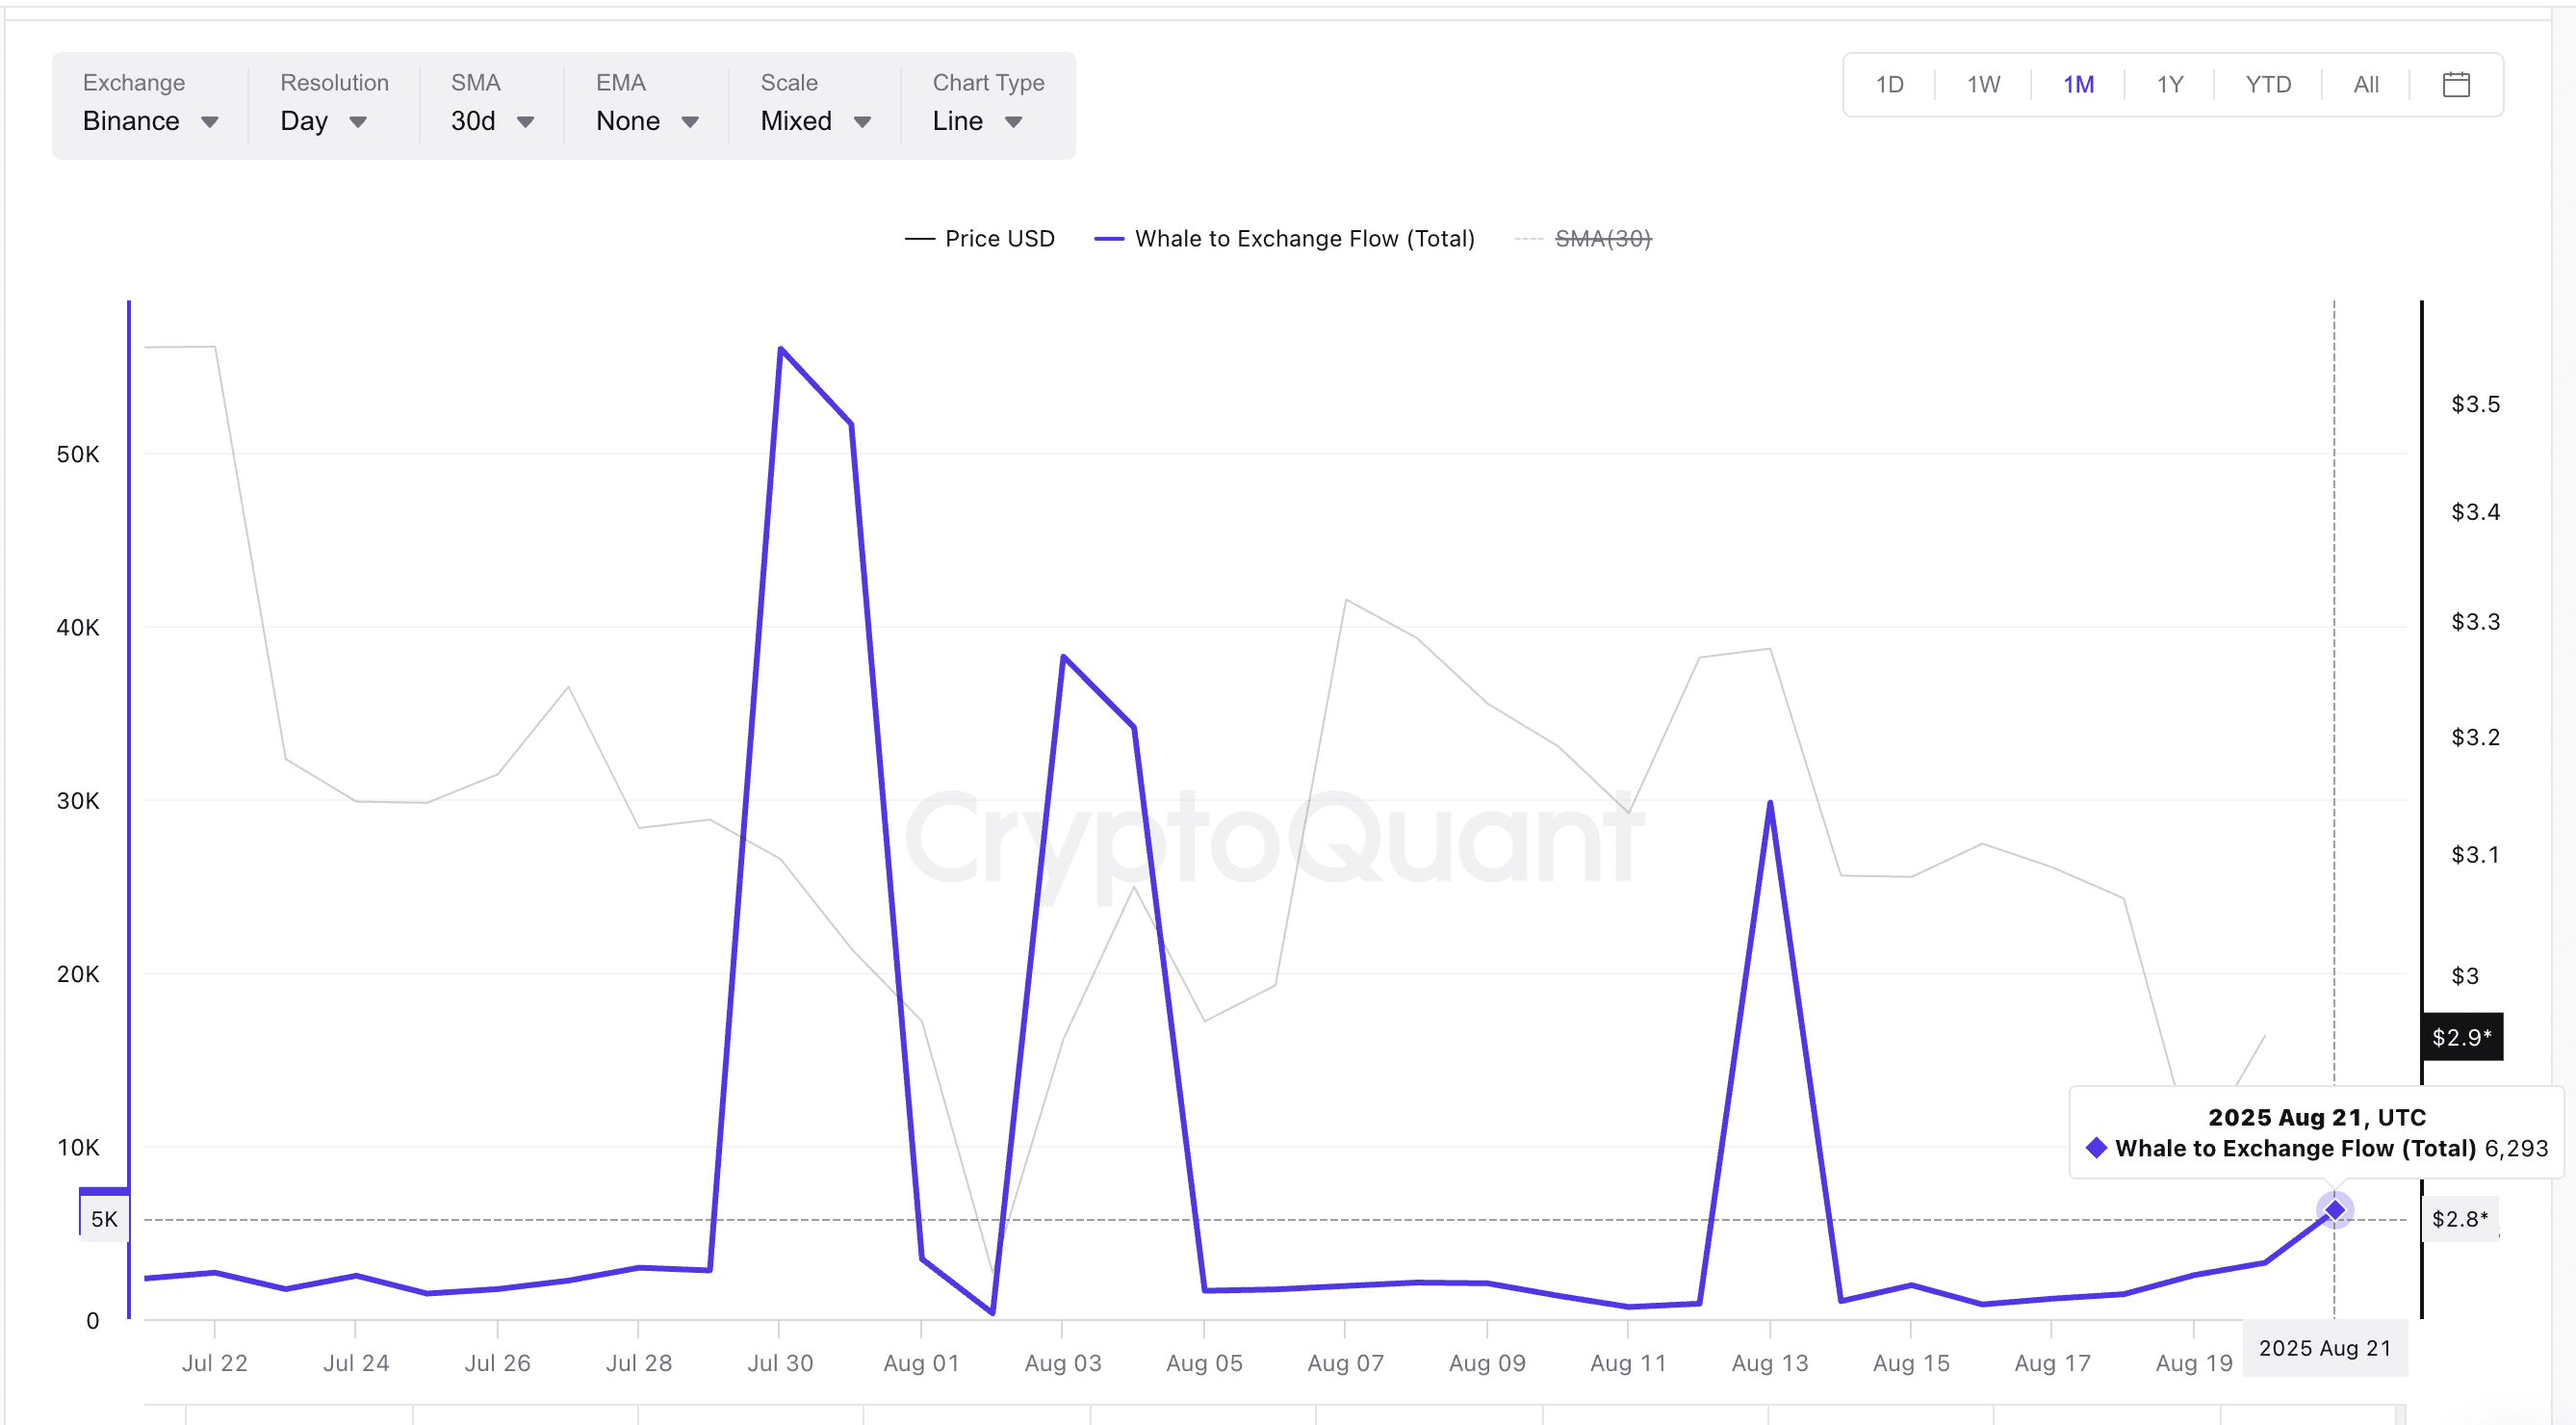
By August 21, whale flows jumped 7 times from a local low of 900 tokens on August 16 to 6,293 XRP. Historically, these spikes have been followed by price declines:
July 30 spike: Price declined from $3.09 to $2.76.
August 3 spike: Price declined from $3.07 to $2.96 (in the following days).
If this new peak exceeds the threshold of August 13, it will be a sign of higher whale flows, something we have not seen in this bearish phase. This could lead to more aggressive selling, adding short-term pressure.
Whale flows to exchanges track the volume of tokens that large holders (whales) transfer to centralized exchanges - often indicating a selling intent.
XRP has just recorded two death crossovers; the third is on the way.
The 4-hour chart for XRP's price shows that the downward momentum is rapidly increasing. Two bearish EMA (exponential moving average) crossovers have already been identified on the chart (red arrows), and the third is now forming. A death cross for the EMA occurs when a short-term moving average crosses below a long-term average, often indicating a shift in trend direction.
If the third crossover is completed, XRP's price chart will witness three bearish formations in less than a week.
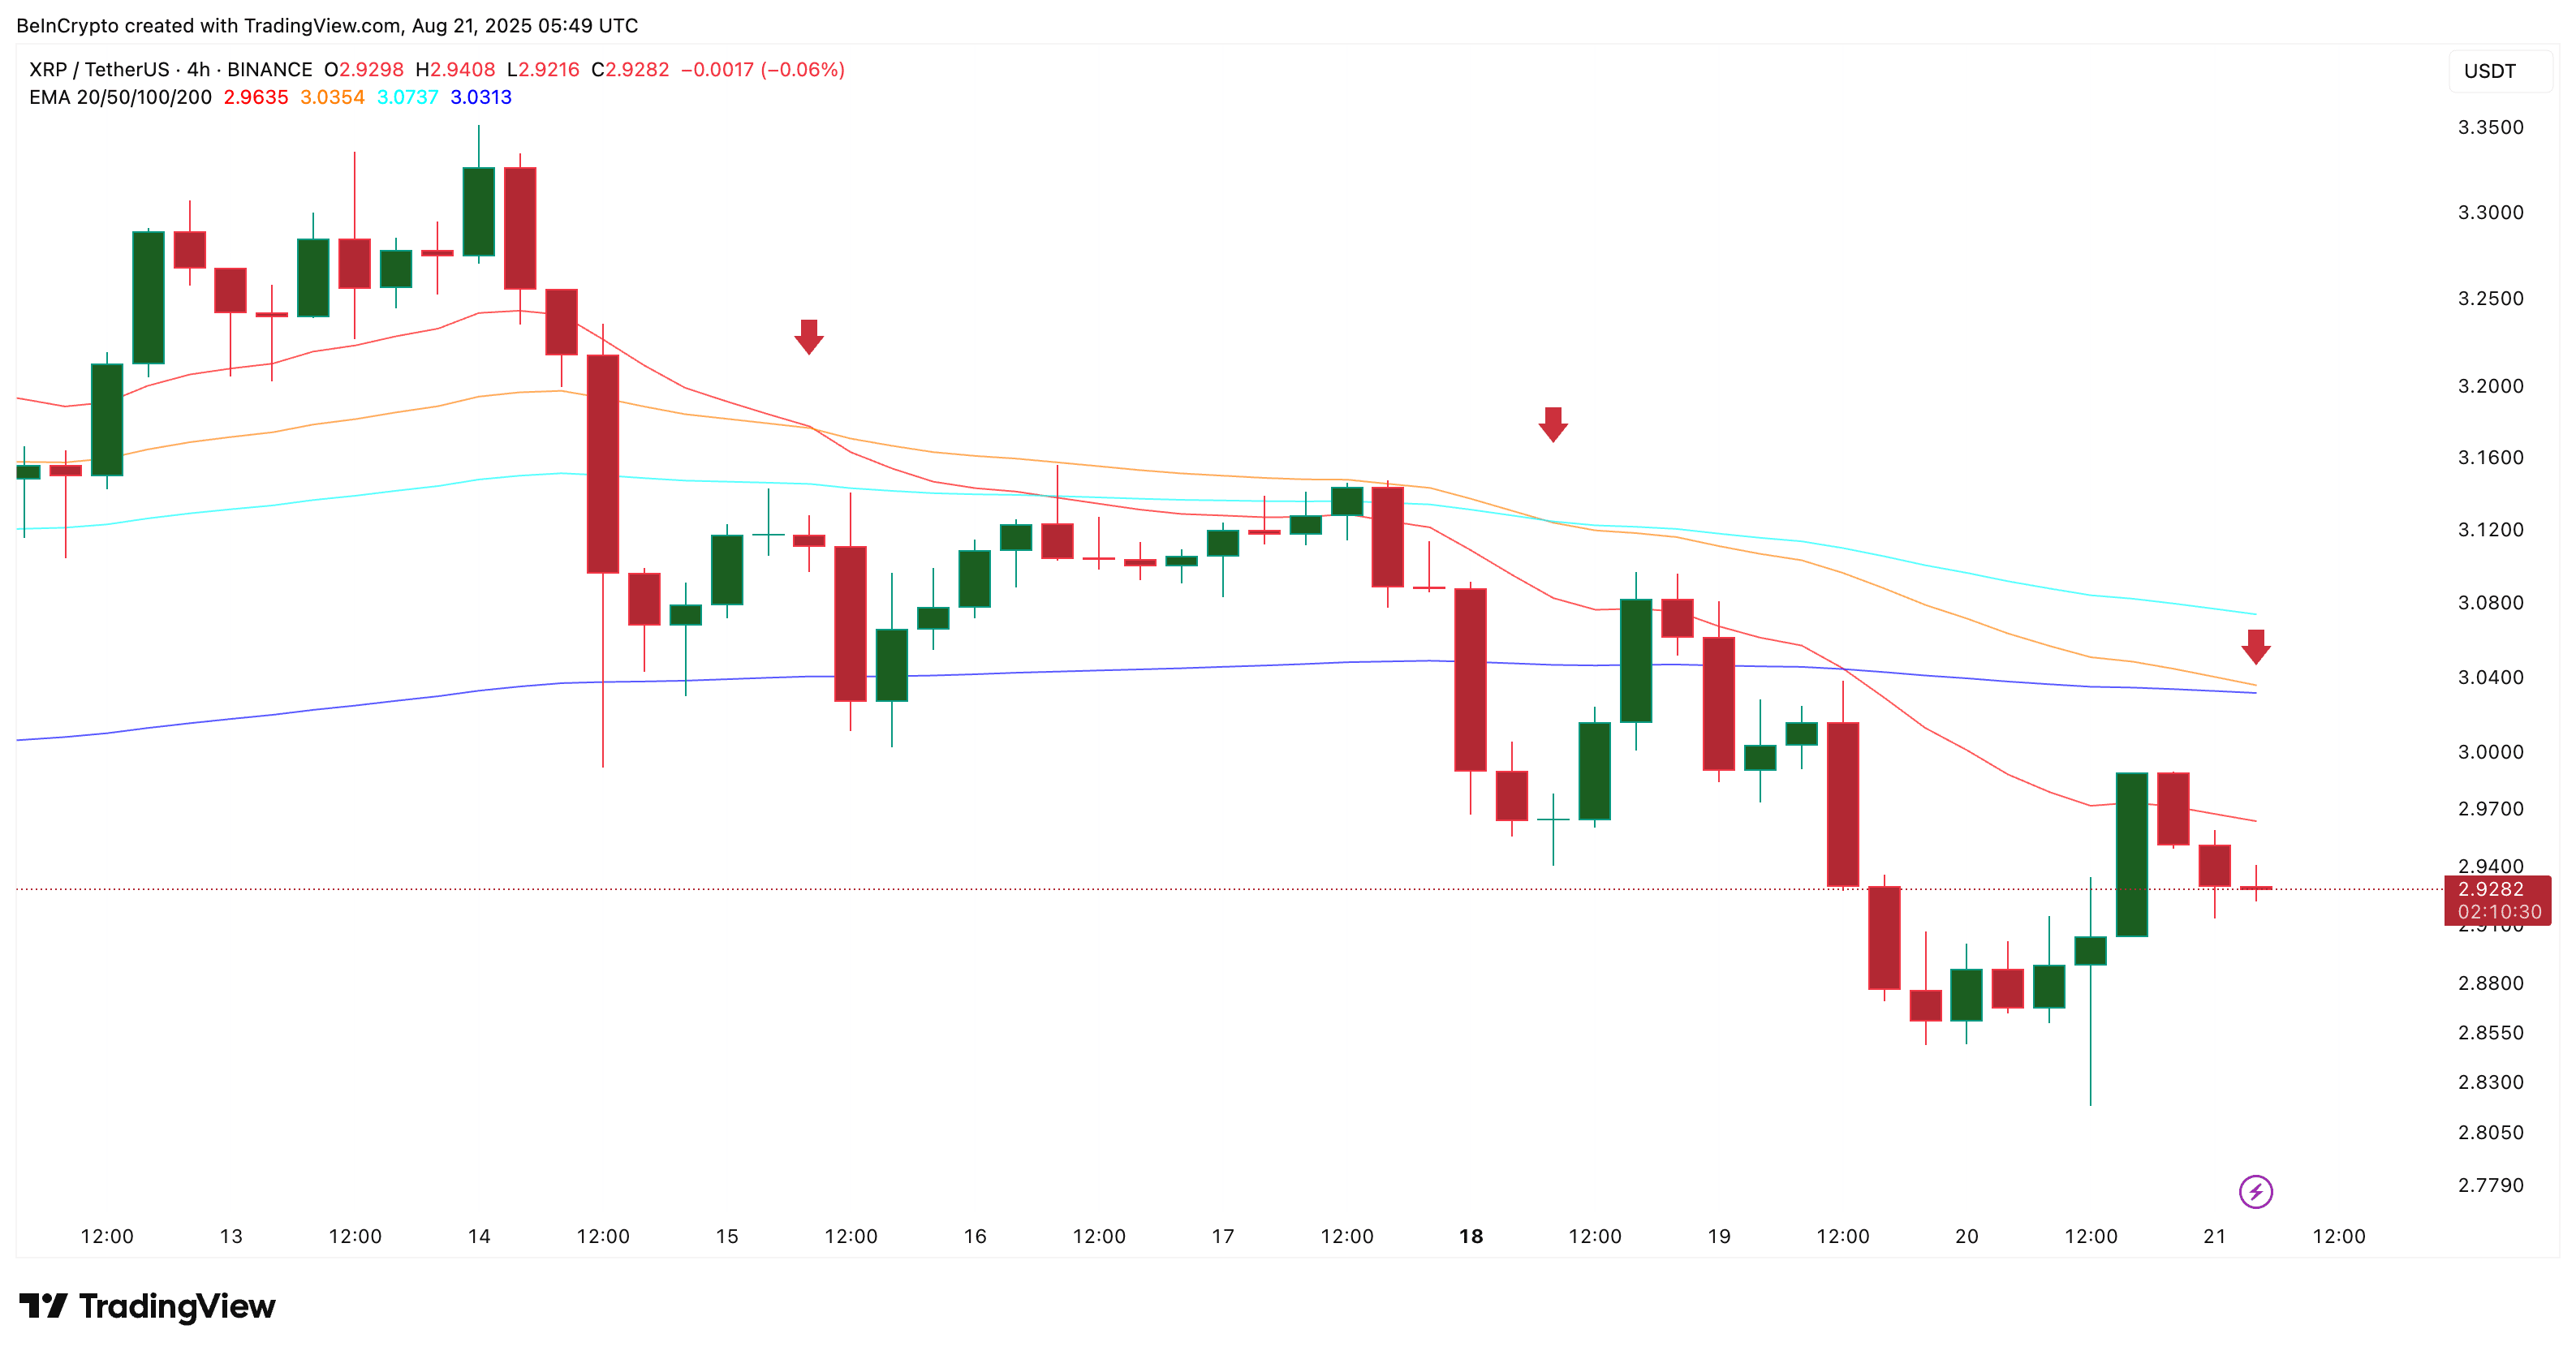
Each of the previous death crossovers was followed by a rapid decline:
August 15 (20/50 crossover): Decline from $3.12 to $2.93.
August 18 (50/100 crossover): Decline from $3.03 to $2.93.
The third crossover, where the 50 EMA slips below the 200 EMA, is much more significant because it reflects a change in the broader trend, not just short-term weakness. With whale flows rising at the same time, the bearish EMA setup reinforces the case for further declines.
The pattern indicates that short-term sellers are gaining increasing momentum, in line with the increase in selling pressure led by whales.
Key levels for XRP's price: Resistance at $2.95, support at $2.81 at risk.
The daily chart shows that XRP continues to struggle near the Fibonacci resistance at $2.95. XRP briefly tested this level again but failed to convert it into support.
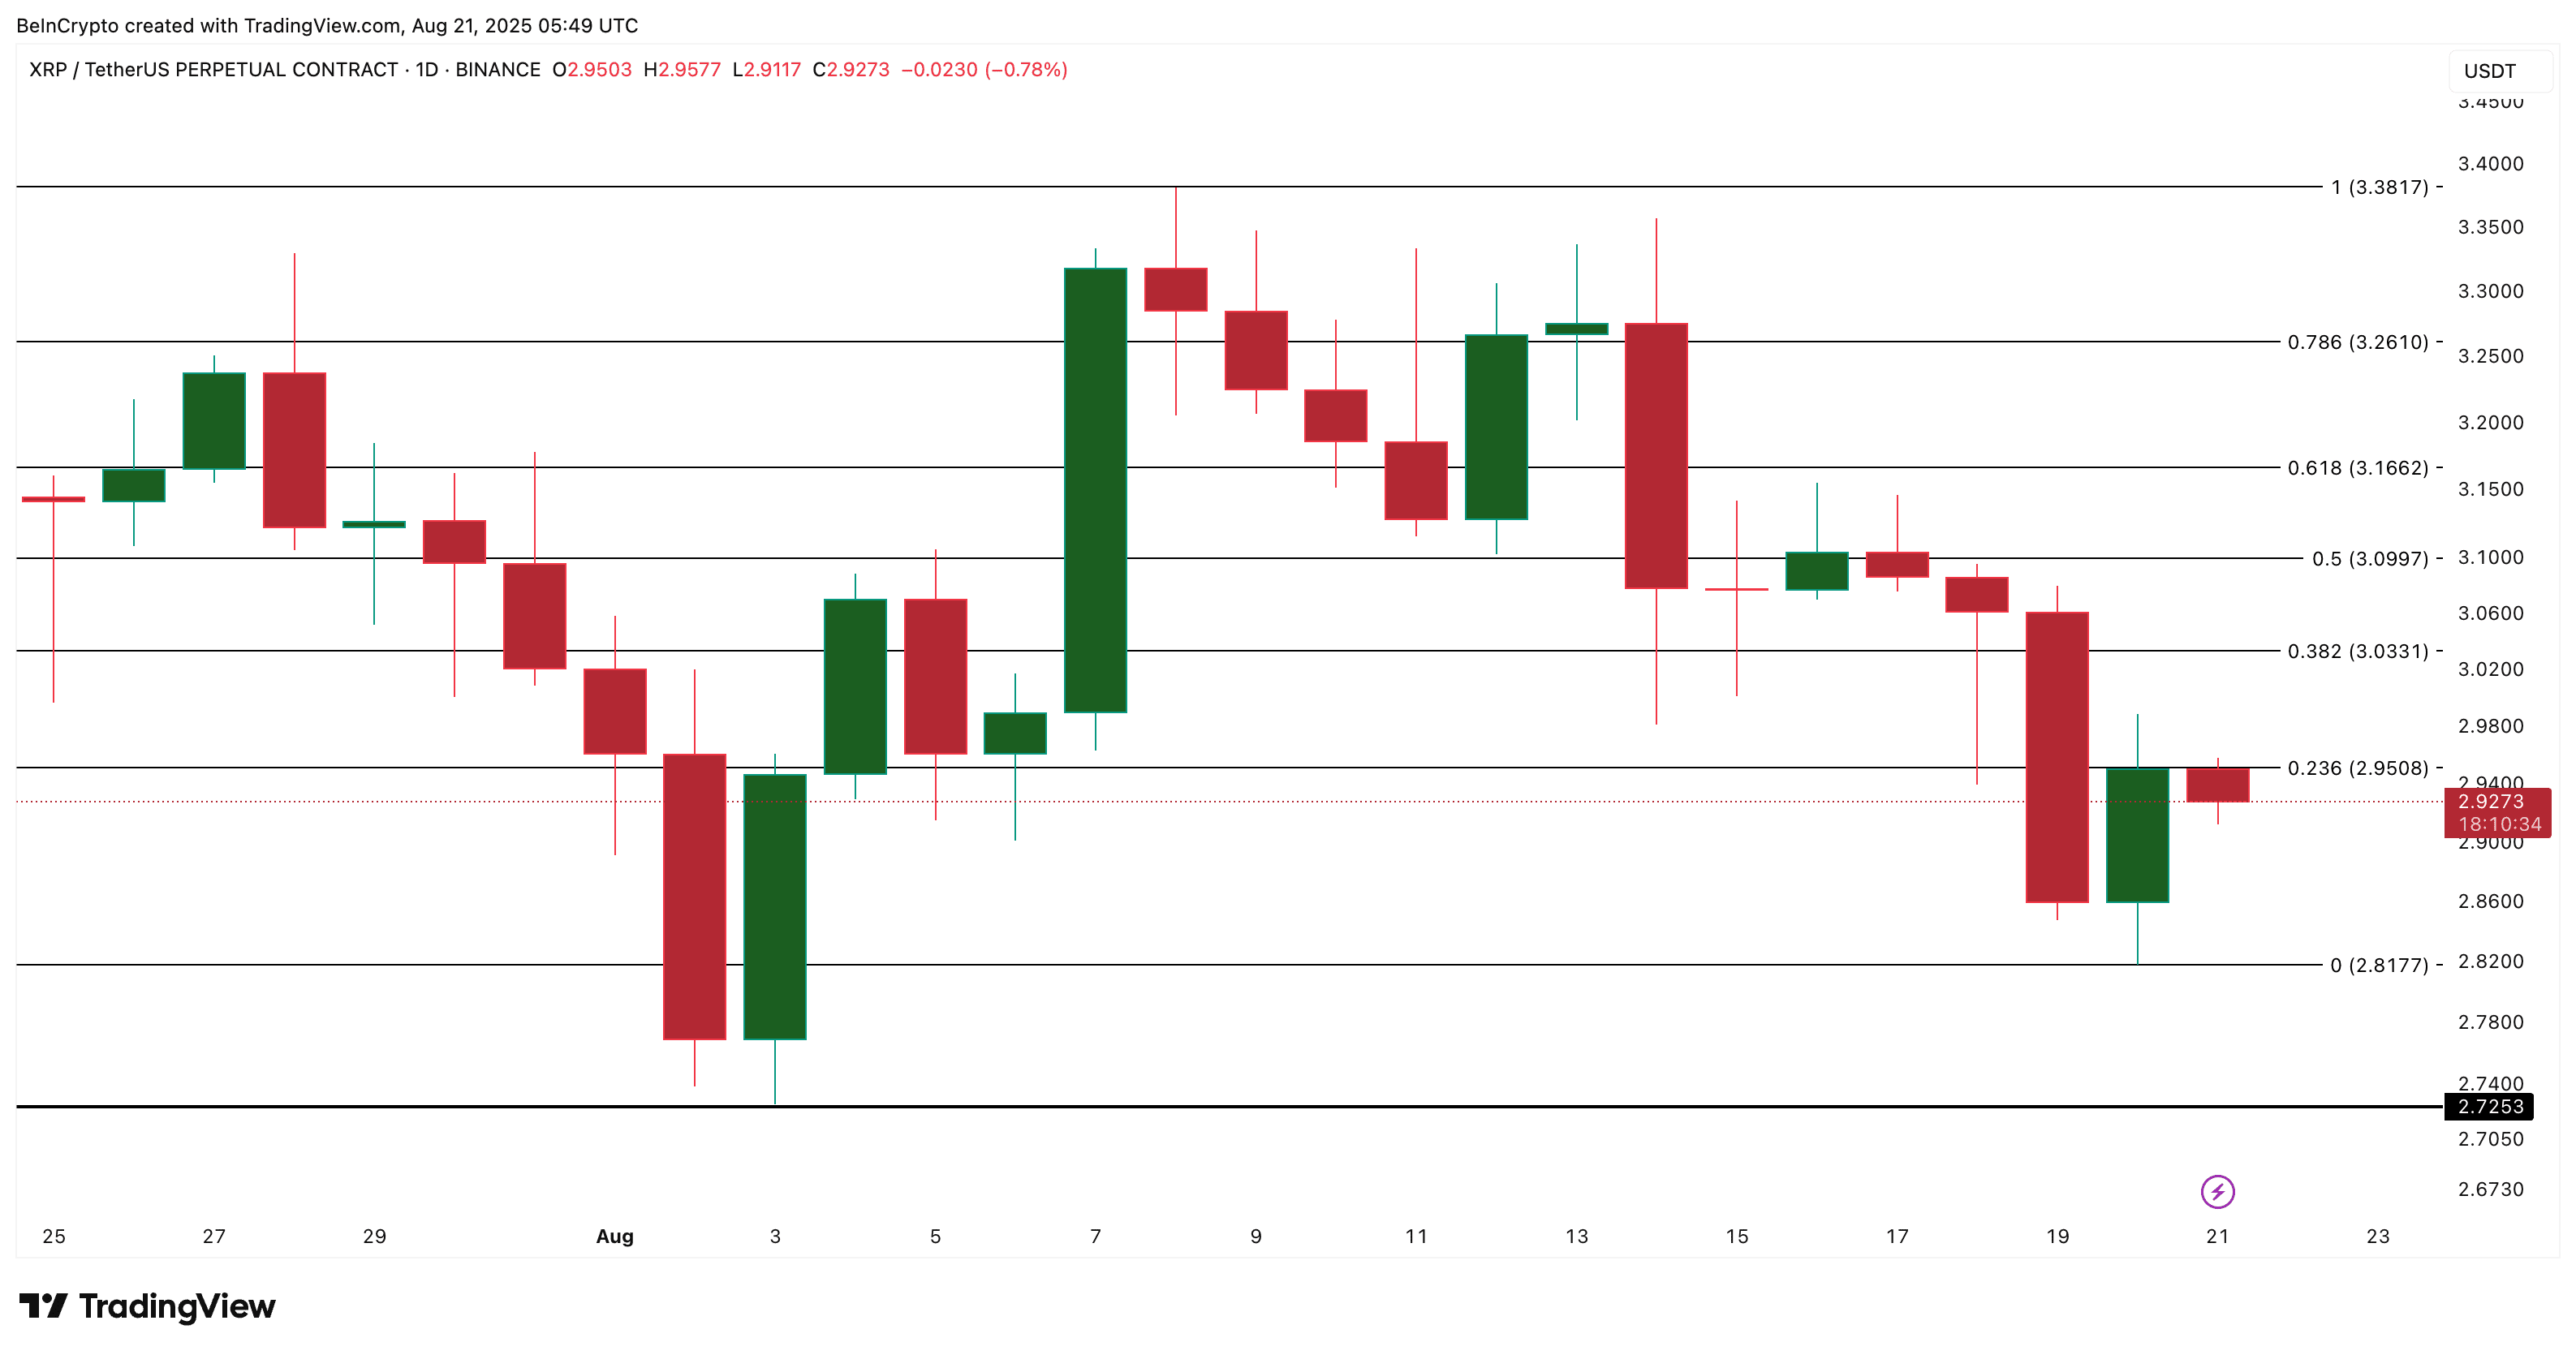
The next main support is at $2.81, which was previously a strong reversal zone. If this level breaks, the next downside target is at $2.72, which is the final support before prices risk retreating to lower levels.
An upward recovery seems unlikely unless the price of XRP can reclaim $3.16, which is the 0.618 Fibonacci level that served as resistance throughout most of August. However, if that happens, the short-term bearish outlook will fade.