In the cryptocurrency market, these candlestick theories apply only to some extent; not all indicator analyses are useful in the crypto space. Although the accuracy of candlestick techniques is not 100%, and many candlestick knowledge seem less useful after learning, according to the experiences of many experts, candlestick techniques still play a key role in the long-term analysis of cryptocurrency prices. No matter which direction the price is heading, it will be reflected in trading. We can use these techniques to understand the direction of price movement. Candlestick analysis is about probabilities and can guide you to a bright path when you are confused.
Without further ado, let's get to the point.
Today, we will focus on basic indicator strategies:
1. Usage and settings of moving averages.
2. RSI Indicator + Usage 3 Value Investment
1. How to use moving averages to judge trends.
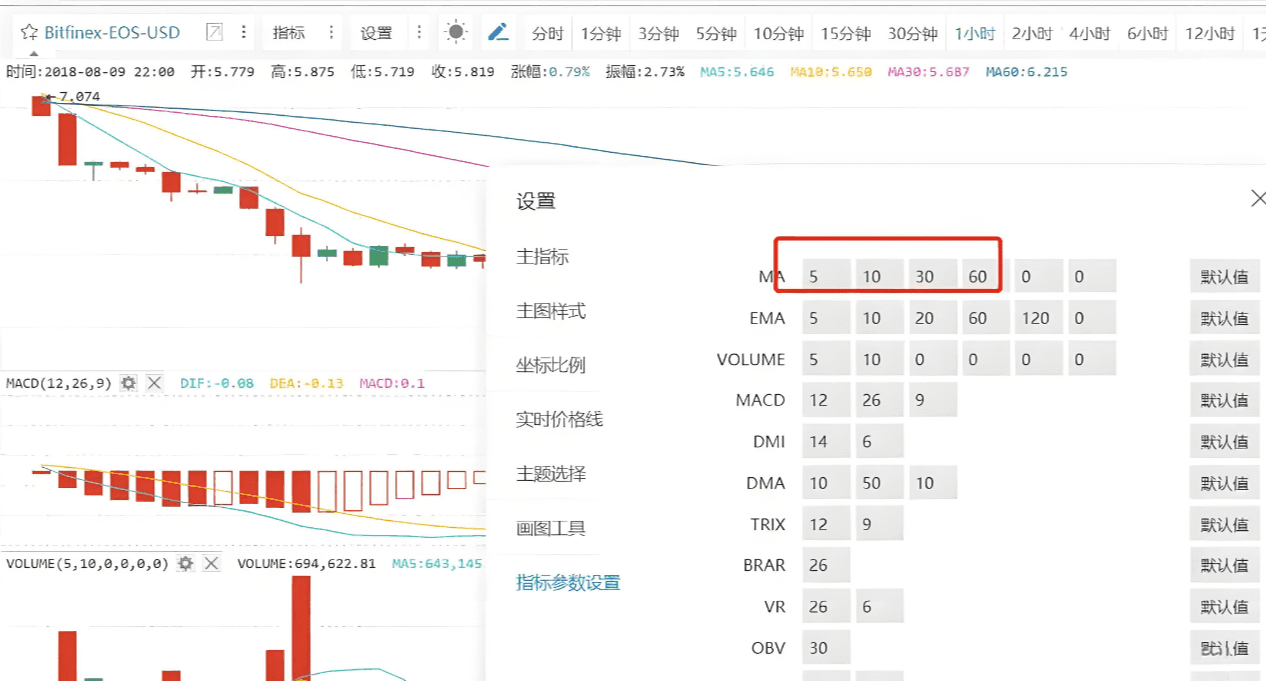
1. First, let's learn how to set indicators.
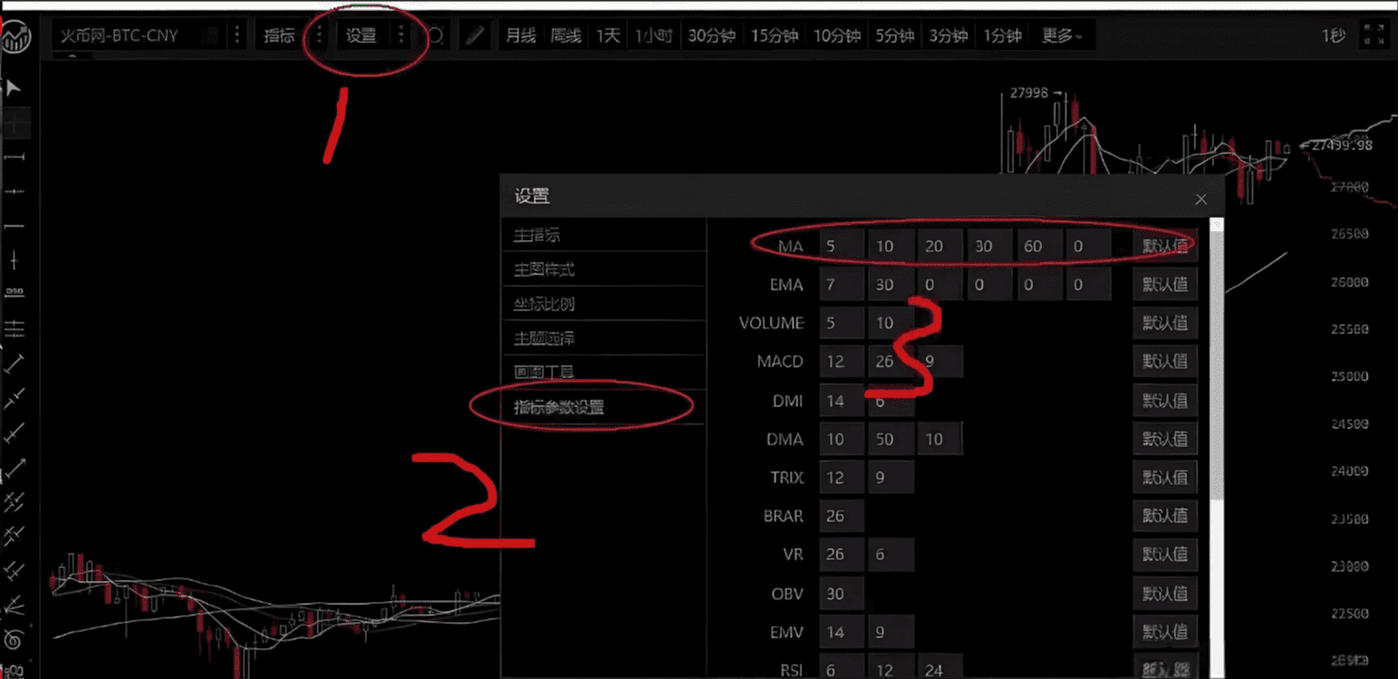
Due to some updates in the settings on Huobi, if you cannot find it, you can directly click on the line with your mouse.
You can see these lines and directly click on them to modify.
After clicking here, you can directly change it. The moving averages we will use are: five-day line, 30-day moving average, 60-day line, and 120-day line. If you feel it is not effective, you can even change the five-day line to a four-day line for a more agile market response.
2. Short-term moving average indicators: Five-day moving average strategy.
The five-day line is commonly used for short-term trading.
What is the five-day line? The five-day line is the sum of the closing prices over five days divided by five.
Generally, the system is set to weekly lines. In short, it is based on the average price over a week as the moving average, but a week is too long, and the reflection is relatively slow. Of course, some experts also use a four-day line, etc. These can be visually displayed through settings.
The five-day moving average is the most practical for short-term judgment.
The five-day moving average represents the average price level within five days, indicating the buying and selling signals during that period, reflecting the range that traders can bear, which is the average holding cost. Therefore, changing the moving average follows the same logic.
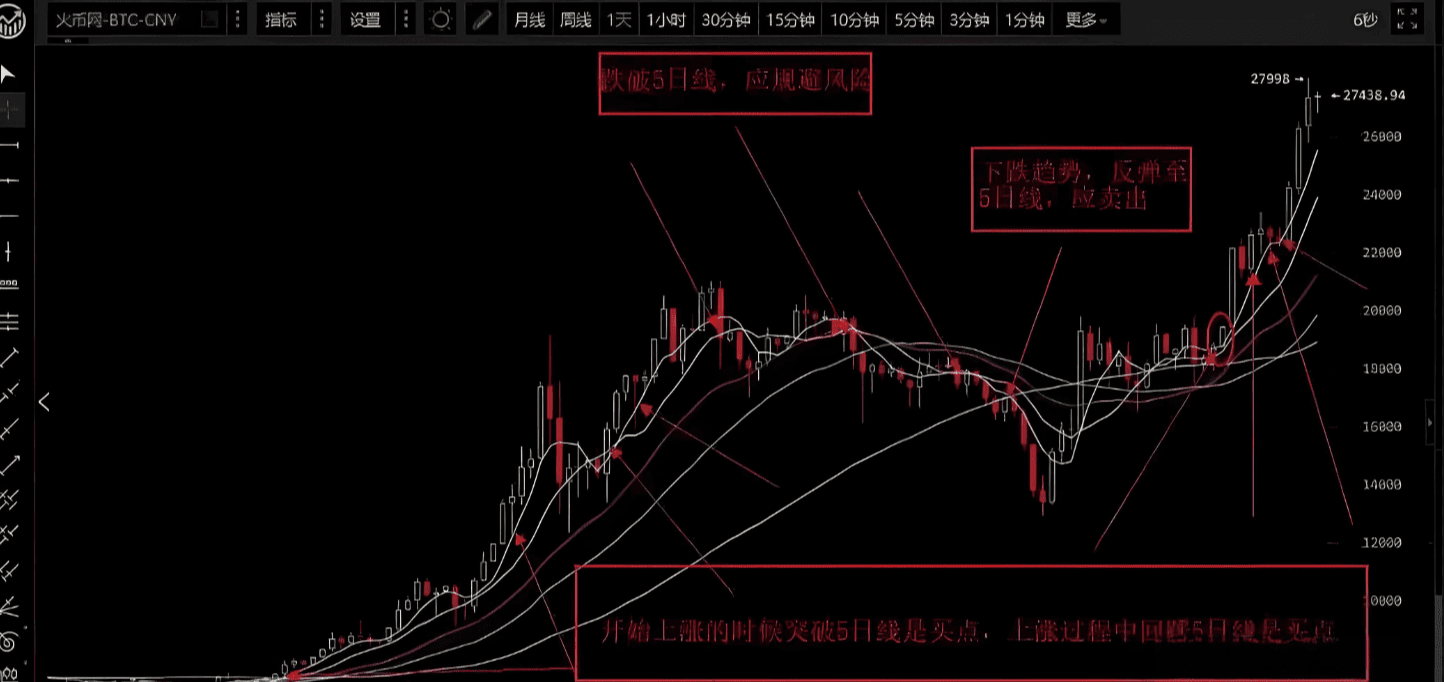
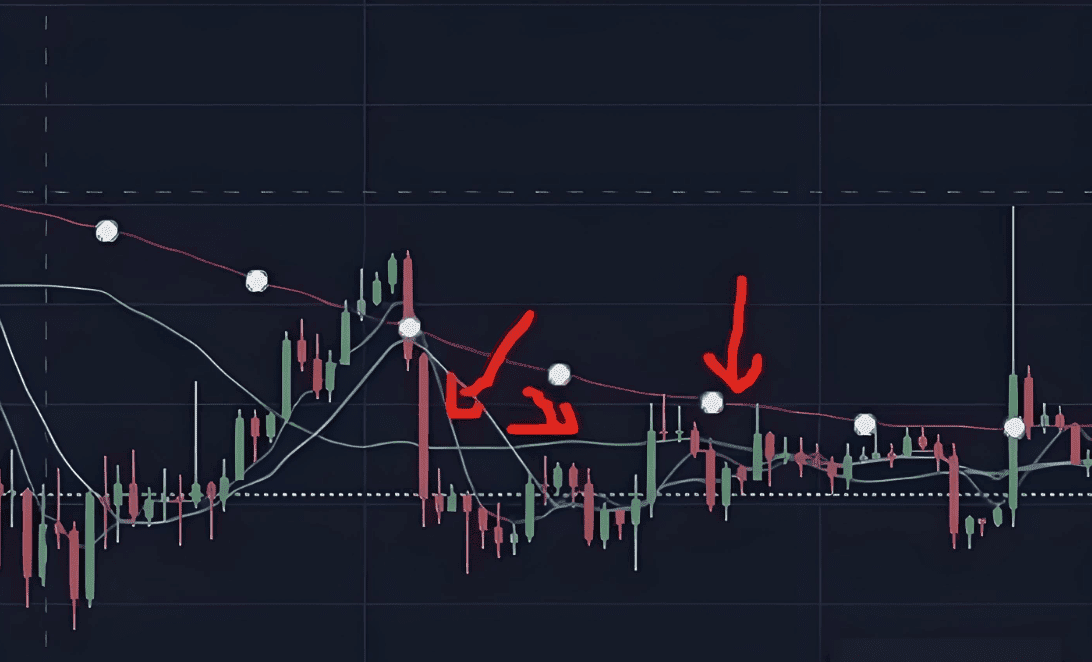
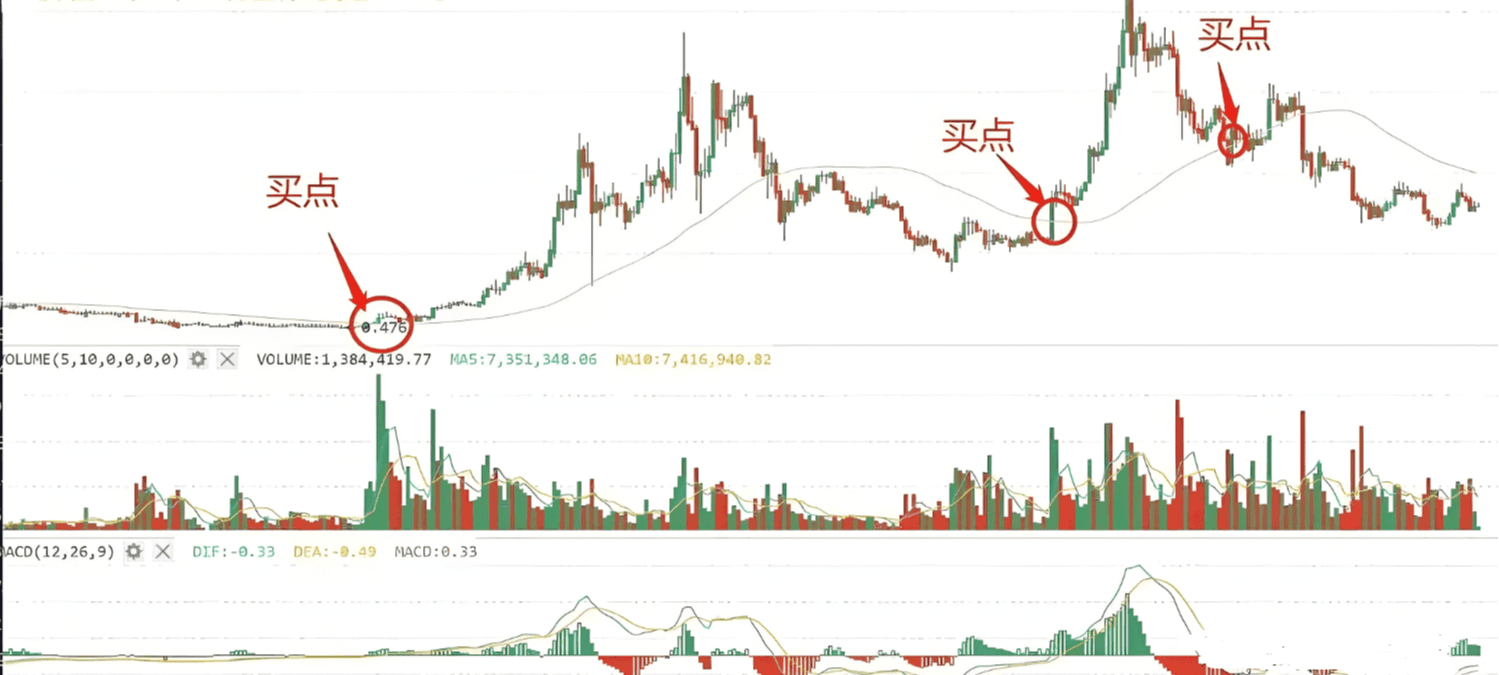
Usage: In a bull market, when the price pulls back to the five-day line, it is time to buy (if it quickly breaks down, one should hold back); in a bear market, when the price falls below the five-day line, one must sell quickly. As long as it does not break below the five-day line, there should not be a major issue.
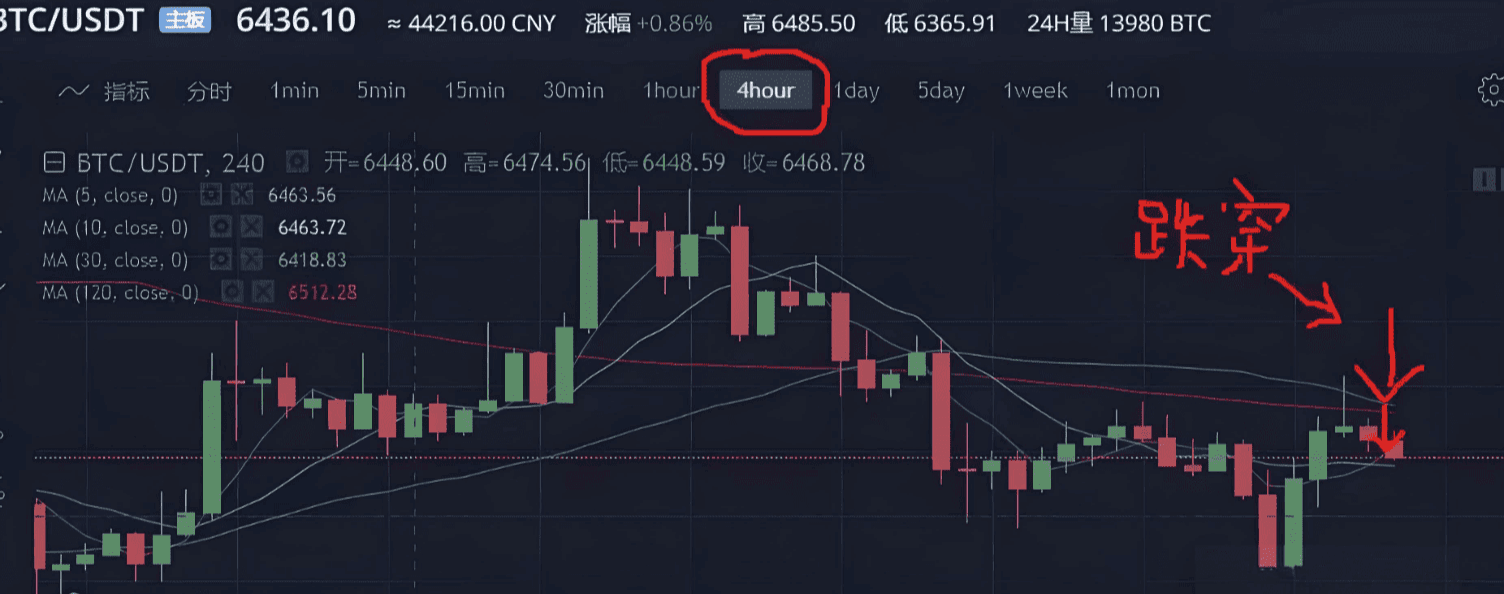
During a volatile period, one can look at the one-hour and four-hour lines; this is the short-term usage.
This theory requires exploration by everyone, as very few will tell you that you will encounter many problems in practice. This needs to be verified repeatedly. Undoubtedly, the five-day moving average strategy is highly useful in practice, and is one of the indicators that short-term experts must rely on.
Why use the five-day line? Because it is said that one day in cryptocurrency is equivalent to a year in the human world, the market reacts particularly quickly. If you use a conventional seven-day line, it will be relatively slow and unable to keep up with the market's changes. We all know that there are no limits to the fluctuation of prices in the cryptocurrency market, and trading occurs even twenty-four hours a day.
If the five-day line is used as a judgment standard, then when the price reaches the five-day line, it will form a support level. If it sells, it will fall below the five-day line, and once it needs to wait to return to the cost price, one can only wait, and this point will also create a support level.
It shows that the current price has not yet risen above the five-day line, and there is still much uncertainty. At this time, we should use the hourly and four-hour lines.
Practical summary: This strategy mainly focuses on short-term indicators. When approaching the moving average, which is essentially everyone’s cost price, selling pressure will decrease, and the price will tend to rise again. If it deviates too far from the moving average, the probability of adjustment increases, mainly because investors will choose to arbitrage, leading to a price drop.
3. Combining the 30-day line and the 10-day line with short-term strategies:
The 30-day line is also a short to medium-term strategy. If you are not a fan of frequent trading, we recommend this strategy to you.
As usual, if you previously followed my settings: five-day line, 30-day line, 60-day line, and 120-day line, then change the 60-day line to a 10-day line.
This set of indicators only requires the use of the 10-day and 30-day lines.
This set of indicators is relatively simple to use. Sell when it falls below the 10-day line, and buy when it breaks above the 30-day line. Change the time to one hour, as detailed in the chart:
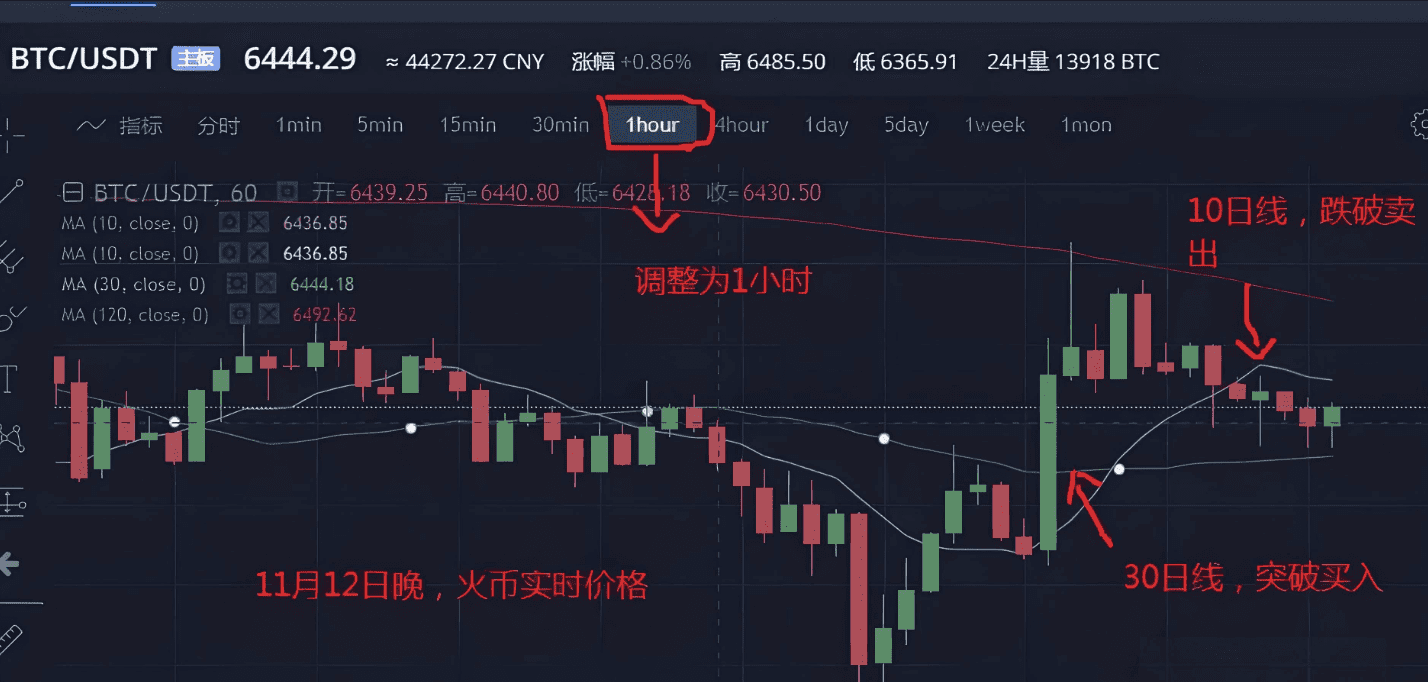
This theory is similar to the five-day moving average. The 30-day moving average represents the short to medium-term trend. When set to one hour, it becomes a short-term buying point. If it falls below the 10-day moving average, a short-term downward channel opens up. The combination and application of these methods in practical trading are significant.
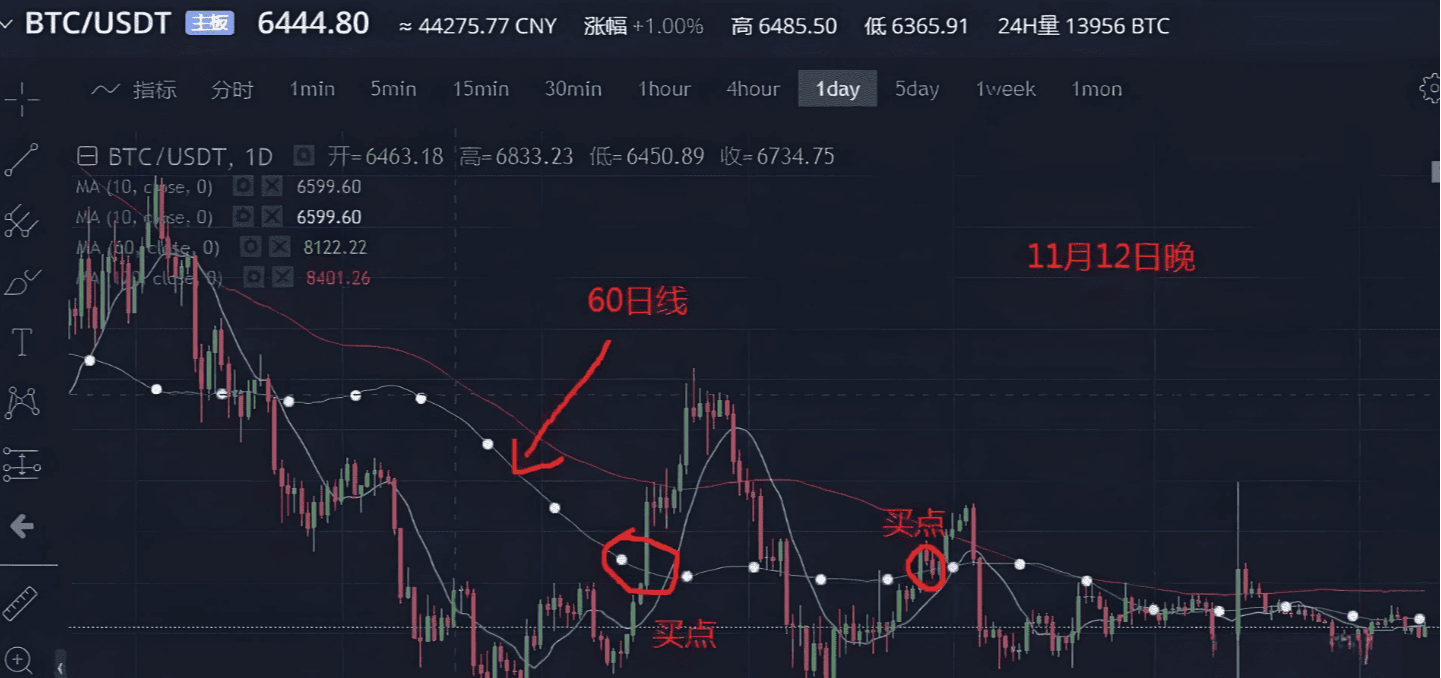
4. Medium to long-term trading strategies: 60-day line and 120-day line.
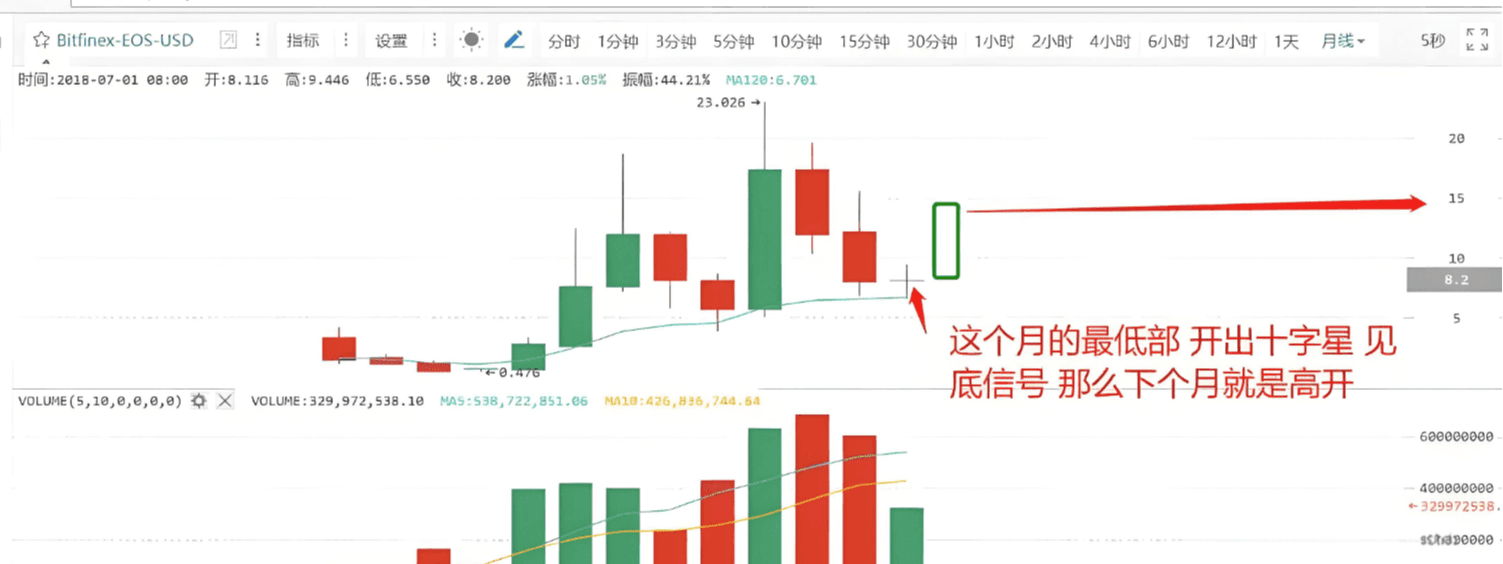
 This chart shows the EOS price trend. It is said that some investors trade several bottoms each year using the 60-day line, making stable investments. This method is suitable for those who do not have time to trade.
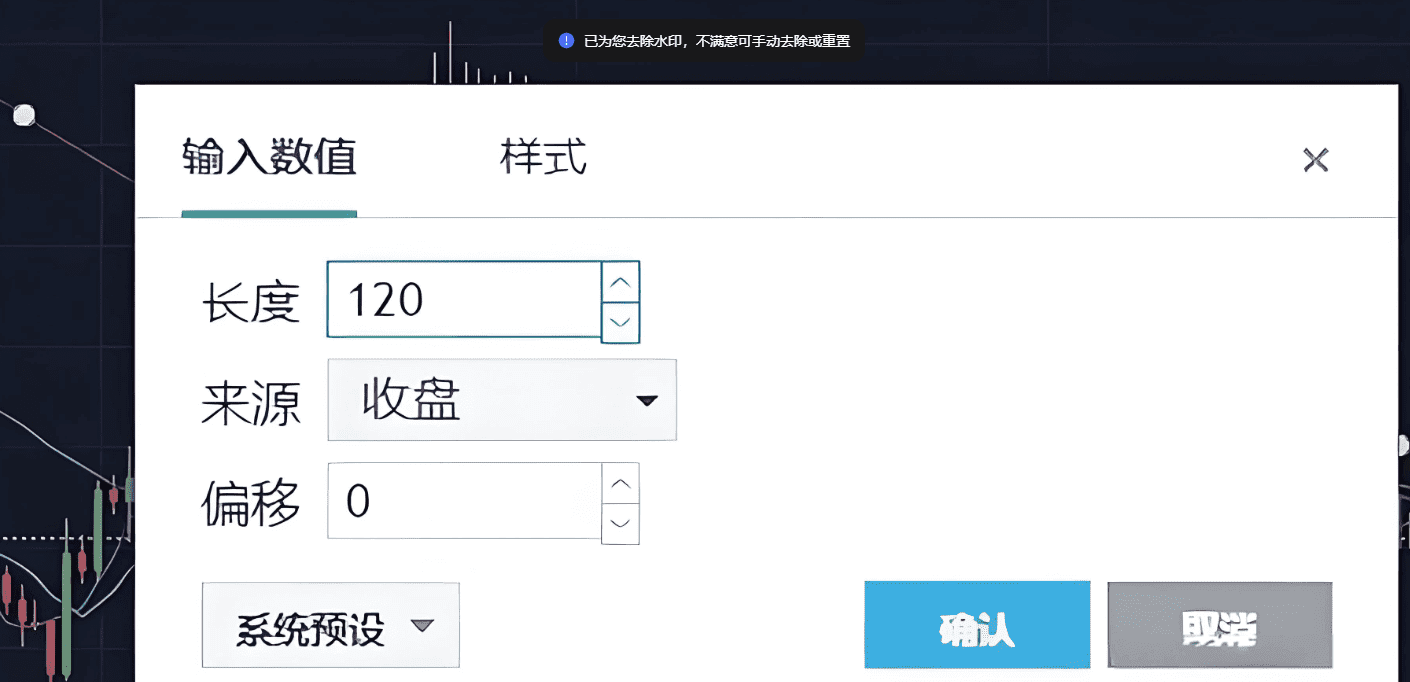
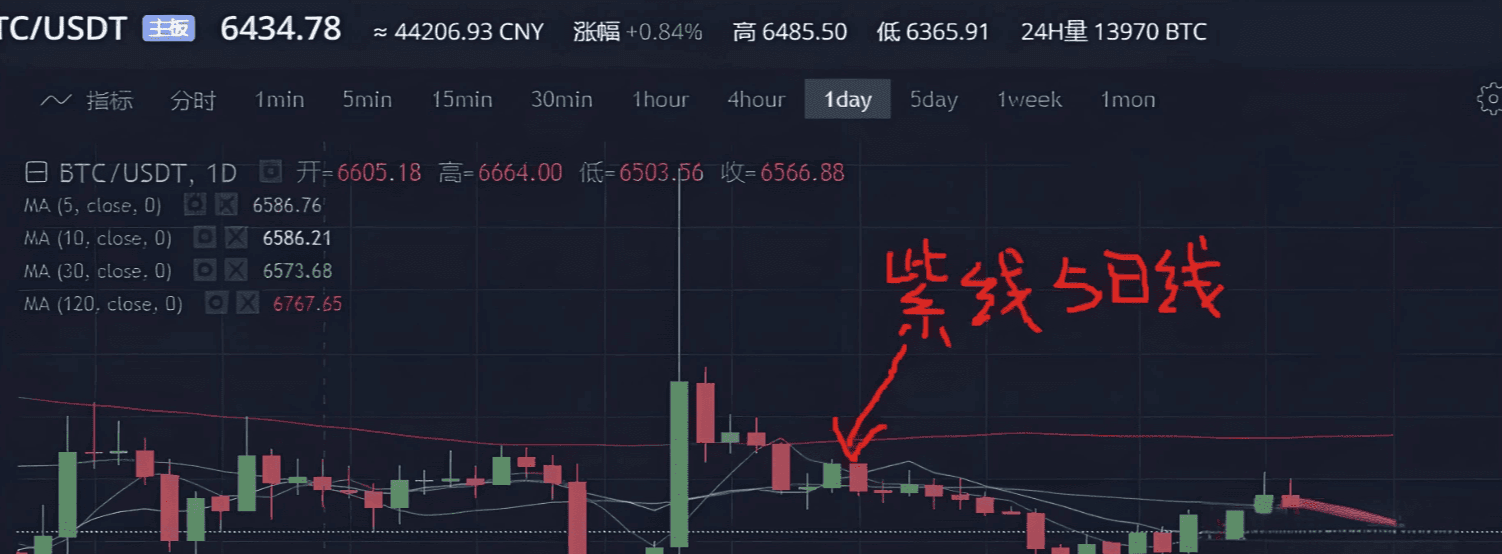
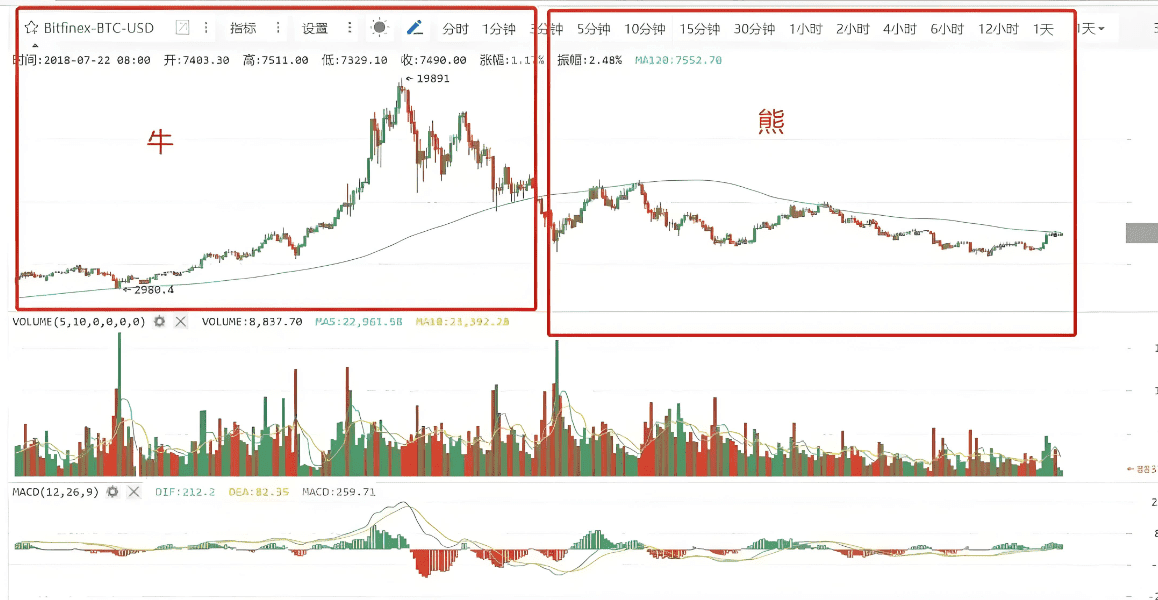
When it comes to the 120-day line, it is the dividing line between bulls and bears.
So how can one use the 120-day line for investment?
This is the previous technical chart. As per the current market, it has not broken through the 120-day line. The 120-day line is actually a technical indicator for determining long-term trends. In daily trading, it is also a reference. This bear market has not ended yet, and once it breaks through the 120-day line, it will signal the arrival of a bull market.
We often see that what various experts refer to as resistance and support levels are essentially moving averages.
When analyzing the major trend, long-term investors should not look at the five-day moving average strategy. The key moving average for the bull-bear transition is mainly the 120-day moving average.
5. Use box waves to observe resistance and support.
This comes from Elliott Wave Theory, which provides a good explanation of wave trading. Many beginners in the stock market have swept the market for years relying on this theory. Of course, its practicality is debatable since seeing is believing. Here, we briefly introduce box wave support and resistance levels.
When the cryptocurrency price runs within a certain box, the waves formed create a line at each wave's peak, which indicates resistance. The bottom of the waves connected creates a line for support.
The general judgment is that if a breakout occurs, it may lead to a higher peak. In this case, how should one choose?
The main point comes from the fundamentals, which is that the release of positive news or the entry of large funds can follow the market trend. Another situation is a breakout followed by consolidation, which is also quite common, indicating that the funds lack the strength to push higher or that there is too much selling pressure. In this case, one must be more cautious. Of course, this span can be quite large and can only serve as a reference.
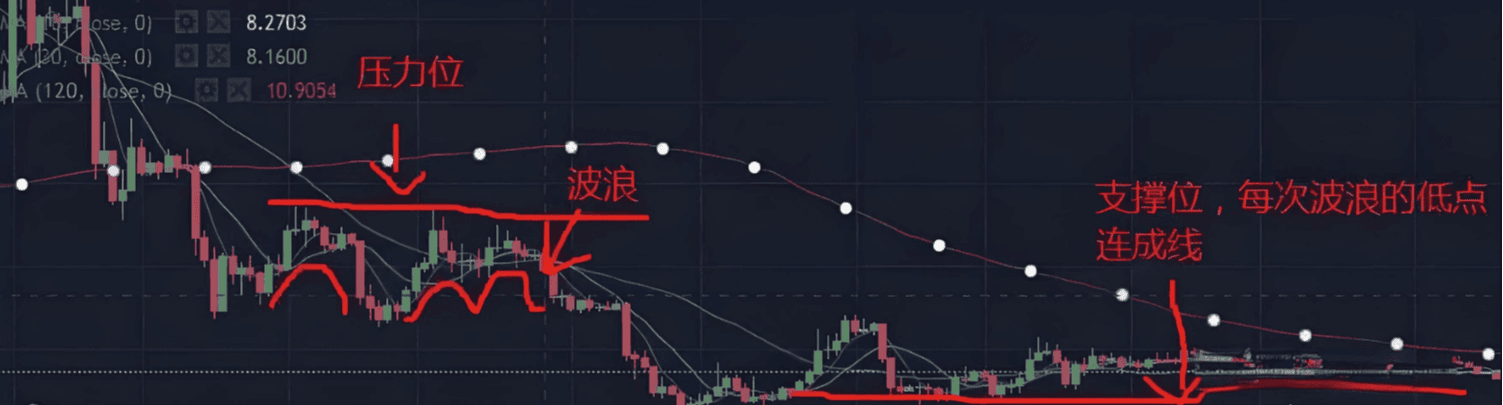
By examining the box wave, one can identify each low and high point to assess support and resistance, which is a relatively common analysis method. It is simple but not very accurate. You can explore this in daily practice or refer to technical books on wave theory. Honestly, I have read several good wave theory books, but their practical application is not very effective. However, that doesn’t mean that everyone will have the same experience after reading them; everything still relies on practical exploration. I prefer practical techniques over conceptual knowledge. What do you think?
6. RSI bottom-hunting and peak-escaping rules.
RSI is also an old technical indicator in the stock market and works particularly well as a reference in the cryptocurrency space.
The RSI indicator represents a degree of strength, calculated based on the statistics of the cryptocurrency price increases and decreases.
The principle of the RSI indicator is simply to calculate the strength comparison between buyers and sellers using numbers. For example, if there are 100 people buying a cryptocurrency, with 60 buying and 40 selling, the price will rise.
So how is it used? 80 to 100 indicates a strong sell; 20 to 50 indicates a strong buy; a weak hold is from 0 to 20, which means a very weak buy.
Once it reaches a golden cross, it becomes a buy/sell point.
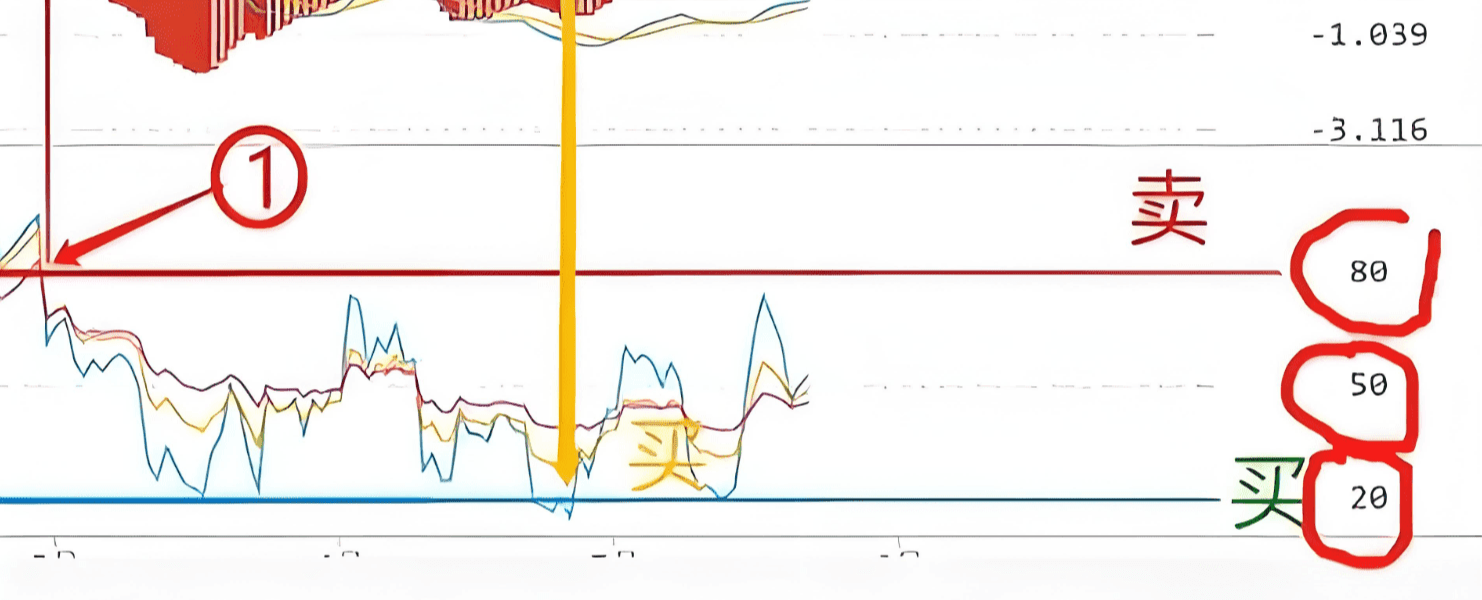
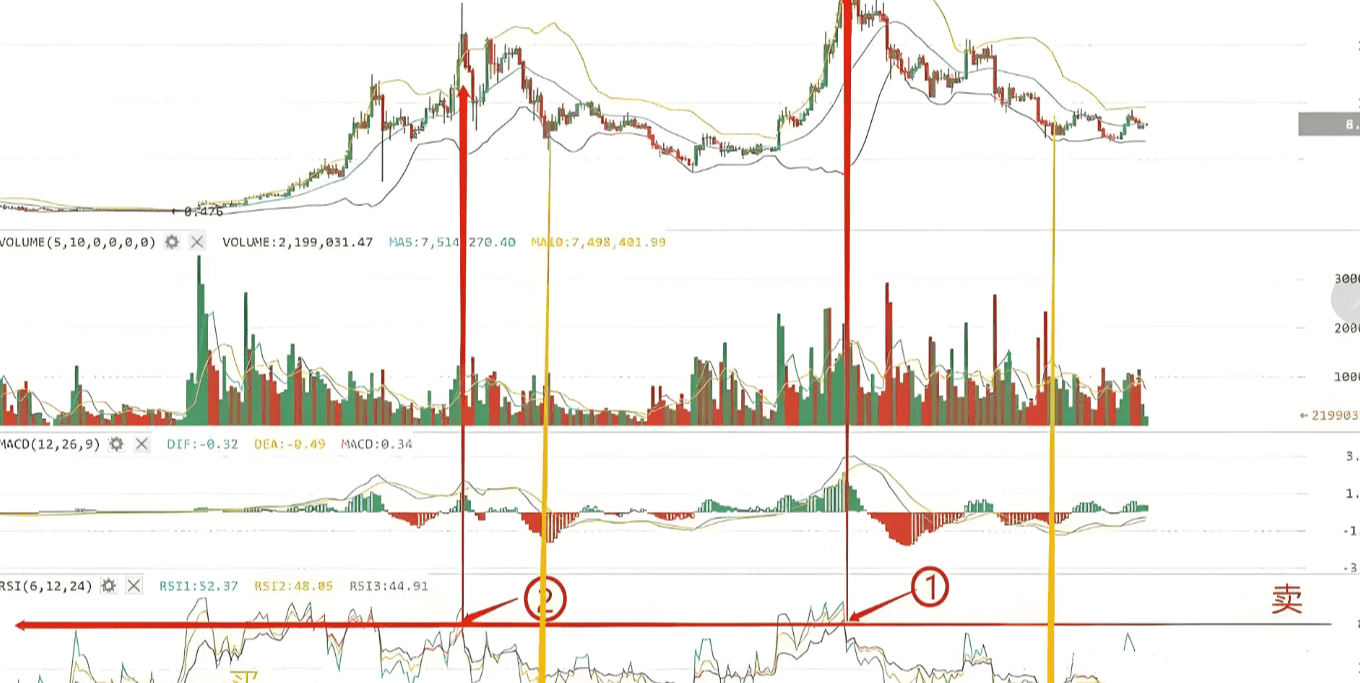 Note, if it reaches 80, there is a significant risk of a pullback. So when should you sell? Sell at the moment it falls below 80. The RSI technique has been validated by the market; it has been used since 1978. Its reference value is considerable. In the emerging cryptocurrency market, this set of indicators can also effectively lead you to victory.
Short-term waves can be operated with the one-hour line to achieve peak escape.
Summary: Let's review the five technical indicators we discussed today: the five-day moving average strategy, the combination of the 10-day and 30-day moving averages, the medium to long-term strategies of the 60-day and 120-day lines, box wave support and resistance levels, and the RSI bottom-hunting and peak-escaping rules.
Although many of the above reference indicators are quite simple, in reality, the simpler the reference indicator, the more useful it is. In practice, we introduced five technical methods for trading cryptocurrencies. Through practical investment, I believe one of these can bring you a unique investment experience, and one can become a powerful tool on your investment journey.
You no longer need to stay up all night watching the market and guessing trends; you don't need to worry about whether buy/sell points are accurate. Focus only on clear trend opportunities. In a bear market, hold back; in a bull market, hold your position. Remember, the cryptocurrency market is not lacking in opportunities, but in the execution ability to keep up.
Old blog only does real-time trading. The team still has opportunities to enter the market quickly.