Only because I stuck to the classic buy and sell mantra of the moving average, I almost consumed all the profits from my positions. The principle is simple: stick to this type of trading system, and over time, this system will become your cash machine.
The trading system includes a comprehensive system that encompasses traders' trading philosophy, trading signals, risk management, emotional control, and more.
Trading philosophy: The trader's understanding of the market and trading objectives, such as whether to pursue trend trading, swing trading, or other specific trading opportunities.
Trading signals: Specific buy and sell points indicated, such as signals generated through technical analysis indicators (e.g., moving averages, MACD, etc.), or information based on fundamental analysis.
Emotional control: Maintain calm decision-making ability and avoid irrational trading behavior caused by greed or fear.
Risk management: Set stop-loss points, take-profit points, and capital management strategies to ensure that losses can be controlled even in unfavorable market conditions.
Execution difficulties: Including overcoming psychological barriers, strictly executing the established trading plan, and continuously optimizing and improving the trading system.
Trend supremacy: Follow the major trend, counter the minor trend.
Identifying trends is the top priority: Use weekly and monthly charts to judge long-term trends (e.g., a rising 20-week moving average indicates a bull market, while a falling one indicates a bear market), and use daily and 4-hour charts to judge medium-term trends. In a range-bound market (like sideways consolidation), sell high and buy low; in a trending market (like breaking through critical resistance), decisively chase highs and cut losses.
Livermore's famous saying 'The trend is your friend' emphasizes that once a trend is confirmed, ignore short-term fluctuations and hold positions until the trend reverses (e.g., falling below the 20-week moving average).
Breakout and reversal signals: A jump high/low after a long period of sideways trading (e.g., breaking through previous highs/lows) is a strong trend signal; at this time, one should decisively follow up (e.g., buy at market price after a jump high breakout). Conversely, do not short near the limit up or long near the limit down, avoiding 'catching falling knives.'
For example, if a stock that has been sideways for half a year suddenly jumps high at the opening, it often signals the start of a big market move, and the probability of success in chasing the rise is very high.
In the crypto space, there is a basic principle: do not sell on spikes, do not buy on drops, and stabilize in sideways markets.
Why do 80% of retail investors lose money in a bull market? Because they sell low and buy high, because they chase rises and panic sell.
According to statistics, retail investors earned only 6.7 billion in the last bull market. You might say that 6.7 billion is not a small amount, and I could even marry a fresh graduate from this share! But don't be too happy too soon; retail investors can be divided into large and small investors. Large investors with accounts over 500,000 earned a total of 254 billion, while small investors with accounts under 500,000 lost a total of 250 billion. Do you see the problem? Stock trading does not create wealth; it is merely a redistribution of wealth.
And the bull market only plays the role of mixing the drinks.
Candlestick charts: An essential technical analysis tool for crypto investment.
Investment and wealth management is becoming a choice for more and more people, and the crypto space, as an emerging investment method, is attracting attention. Although the crypto space is full of opportunities, high risks are also a constant companion.
For beginners, blind buying and selling and relying on rumors often lead to losses. Trading coins requires technical support; as an important technical indicator, candlestick charts contain rich information.
1. Basics of candlestick charts
1. The origin and significance of candlestick charts.
The candlestick chart, also known as the candle chart, originated in Japan during the Tokugawa shogunate. Initially, it was used by merchants in the rice market to record market conditions and price fluctuations.
Due to its unique representation, the candlestick chart has been widely applied in capital markets, becoming an important tool for investors to analyze market trends.
2. Structure and drawing of candlesticks
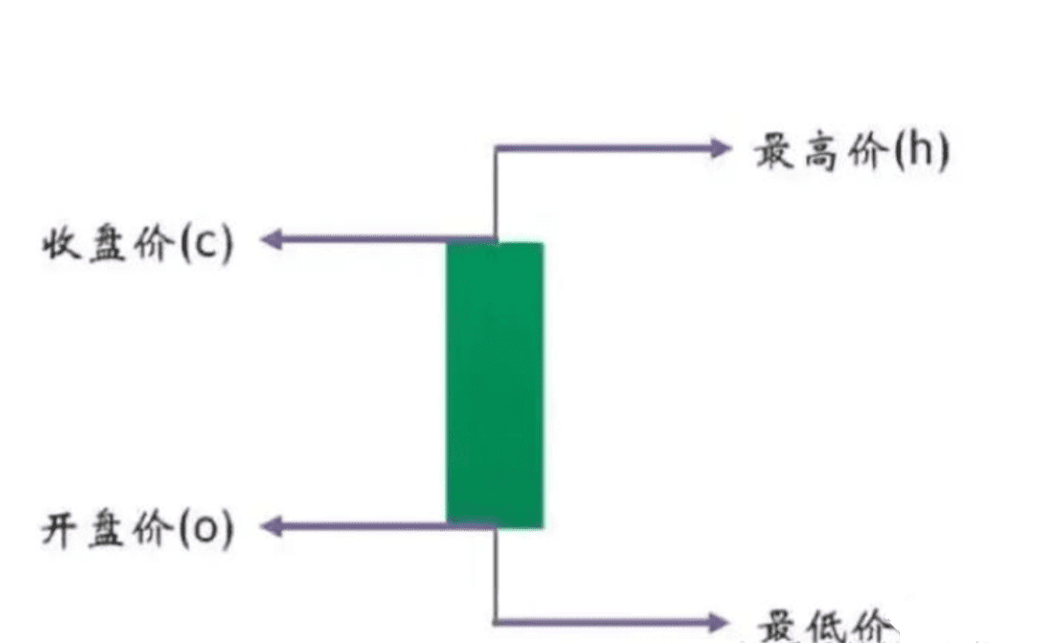
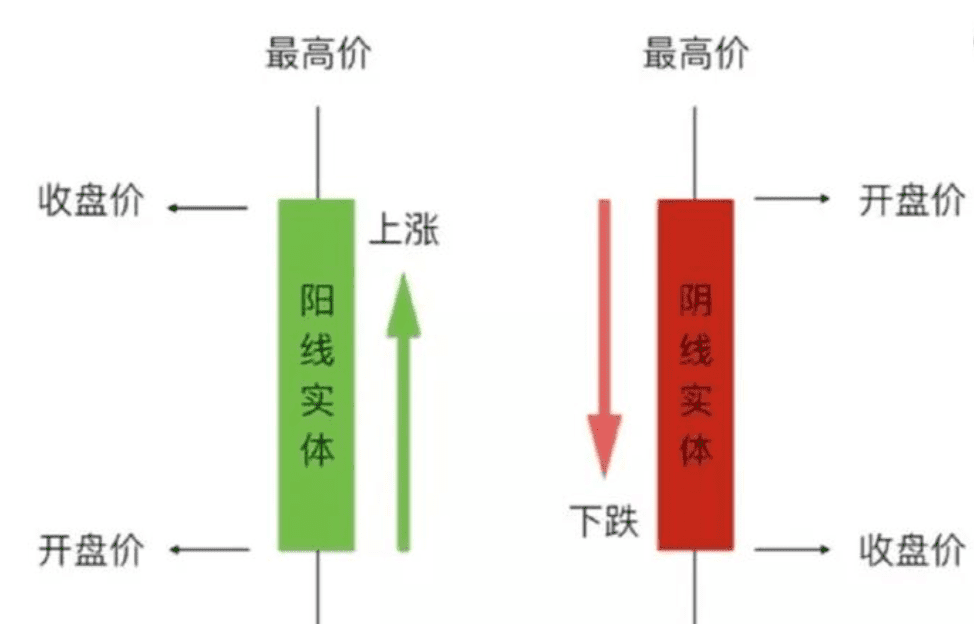
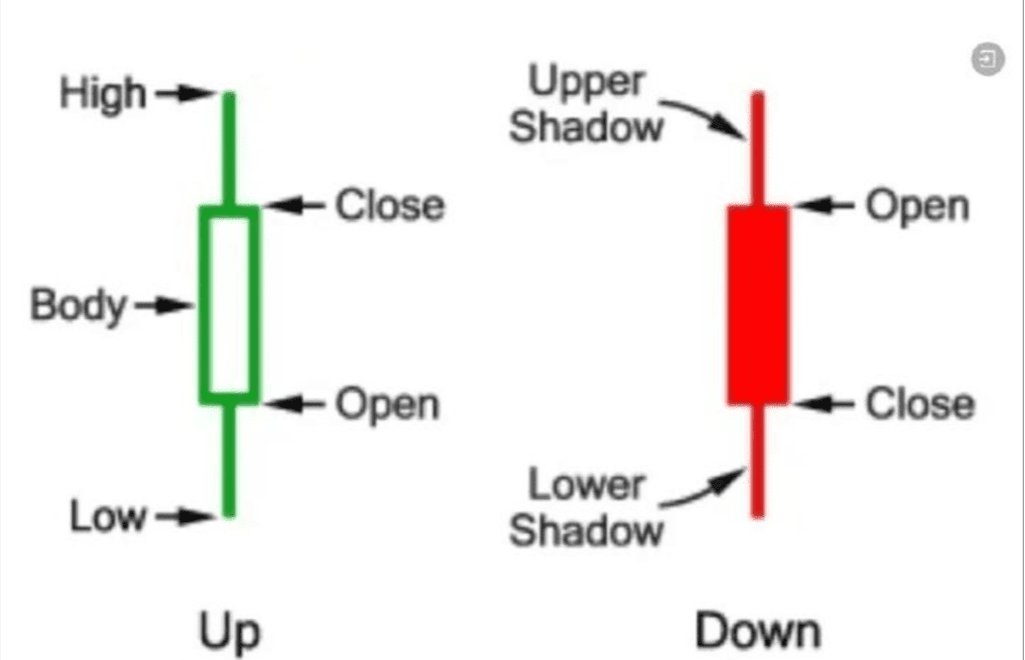
Candlesticks are drawn from the opening price, highest price, lowest price, and closing price of each analysis cycle. Structurally, a candlestick can be divided into an upper shadow, a lower shadow, and a middle body, each containing rich market information.
3. How to learn to read currency trading candlestick charts?
Colors of candlesticks in the cryptocurrency market.
In the cryptocurrency market, green usually represents bullish candlesticks, indicating that the closing price is higher than the opening price; red represents bearish candlesticks, indicating that the closing price is lower than the opening price. Through different colored candlesticks, we can intuitively understand the market's ups and downs.
 What benefits do I get from reading candlestick charts?
As an important tool for trading in the crypto space, the candlestick chart can help you formulate more precise investment strategies. It can not only reveal market trends but also guide you in choosing the best times to buy and sell.
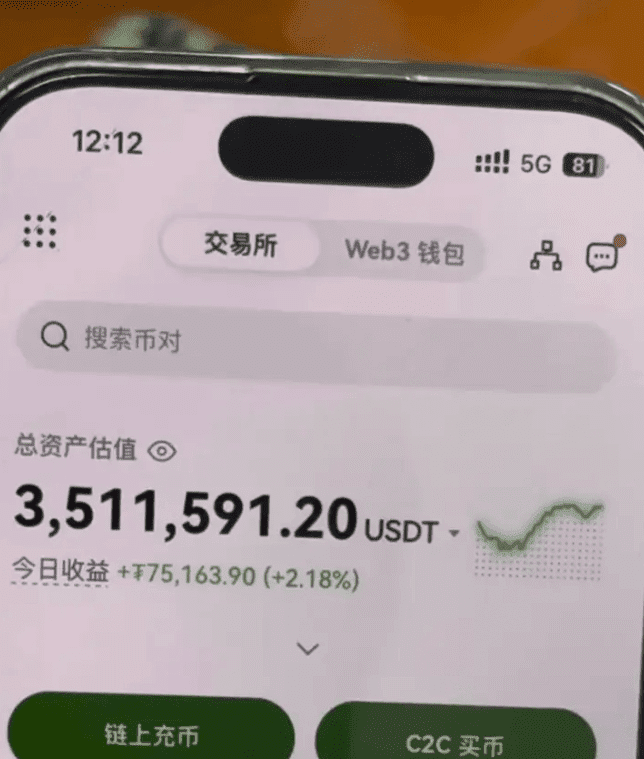
For those who firmly believe in holding coins, understanding candlestick charts is equally crucial. In the trading interfaces of major exchanges, candlestick charts occupy a central position. If you do not understand candlestick charts, it may be somewhat awkward in the crypto space.
Therefore, mastering the analysis techniques of candlestick charts is an essential skill for those who want to thrive in the crypto space. Whether for short-term trading or long-term holding, candlestick charts are an indispensable assistant.
What key information can you get from reading candlestick charts?
Candlestick charts allow you to clearly grasp the price trends during specific periods, including opening, closing, highest, and lowest prices.
It is also an intuitive record of the battle between bulls and bears, showcasing the fierce competition in the market.
Master candlestick charts, understand market trends, and help you make wiser investment decisions!
4. Basics of candlestick charts
a. Components of the candlestick chart
The candlestick chart is mainly composed of bullish and bearish candlesticks.
Each candlestick reflects four key prices: the highest, lowest, opening, and closing prices.
The 'rectangular body' is formed between the opening and closing prices, connecting the highest and lowest prices to form a complete candlestick.
b. Bullish and bearish candlesticks
Core of the candlestick chart: Bullish and bearish candlesticks.
Green indicates a bullish candlestick, representing strong buying power.
Red indicates a bearish candlestick, representing strong selling power.
Taking daily charts as an example: more bullish candlesticks indicate stronger buying power; more bearish candlesticks indicate stronger selling power.
c. Secrets of moving average charts
The colorful lines in the candlestick chart represent moving averages.
White, yellow, purple... Each color represents a different period of the moving average.
5-day, 10-day, 90-day... Moving average settings can be flexible to capture the market pulse.
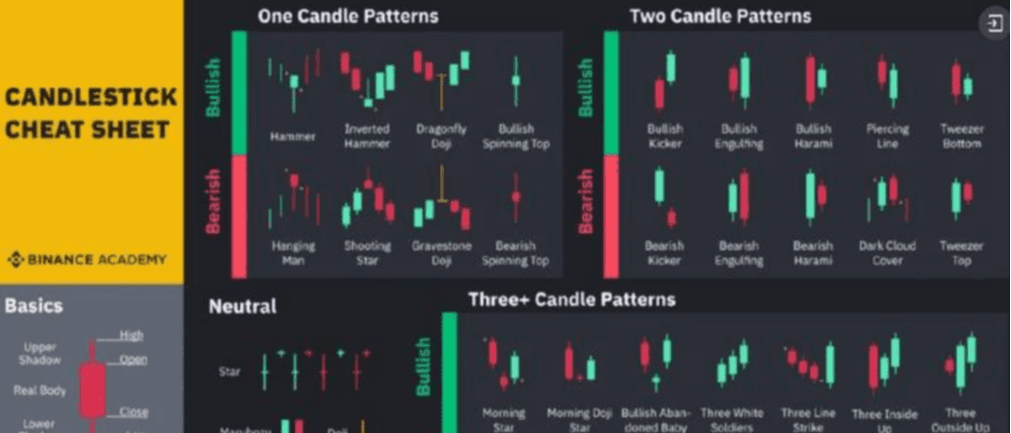
5. Cryptocurrency candlestick chart patterns
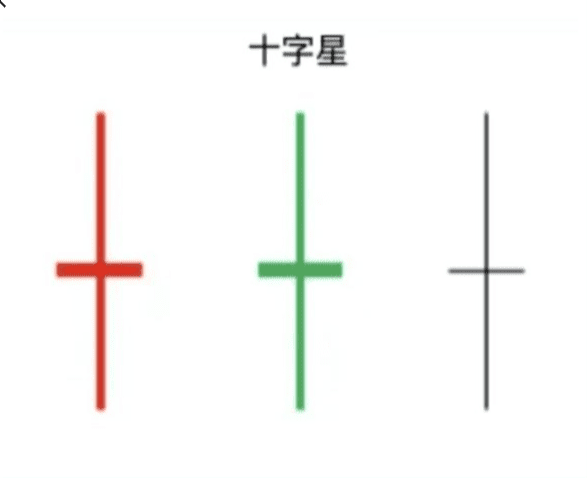
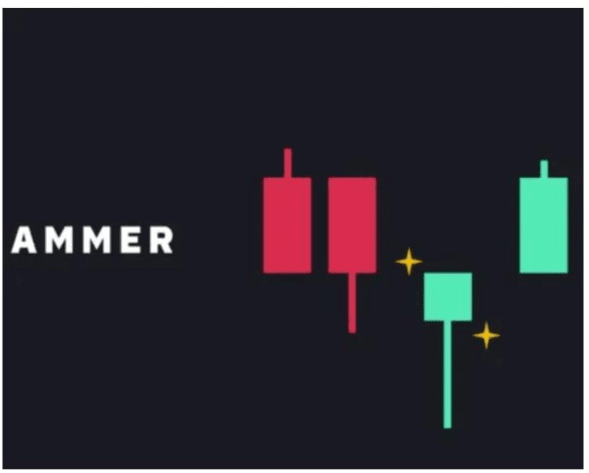
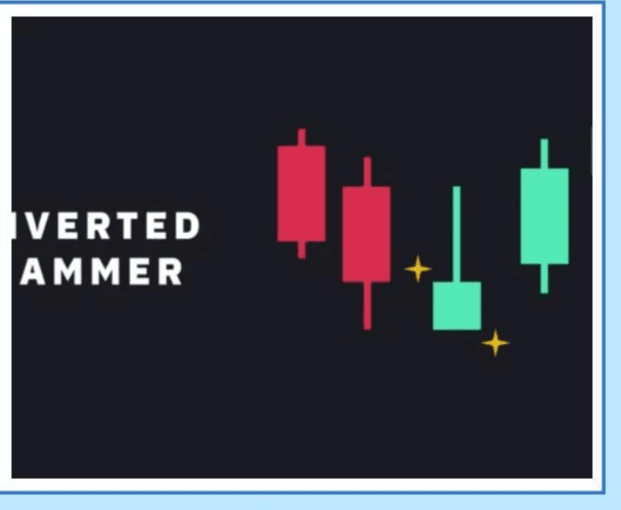
Based on different patterns of candlestick charts, we can categorize them into several major types:
Reversal patterns, consolidation patterns, trend patterns, special patterns
These patterns are not isolated; they are usually used in conjunction with other technical indicators such as trading volume, moving averages, etc., to provide a more comprehensive and accurate market analysis. It is important to note that while candlestick patterns can provide useful information, they are not absolute tools for predicting market trends, and investors should also consider various other factors when making decisions.
What information is included in the candlestick chart?
Opening price: The price at the beginning of the current time unit. (For example, the opening price at the start of each hour is the opening price)
Closing price: The price at the end of the current time unit. (For example, the closing price at the end of each hour is the closing price)
Bullish candlestick: When the closing price is greater than the opening price, the body is green, indicating a price increase; we call this a bullish candlestick.
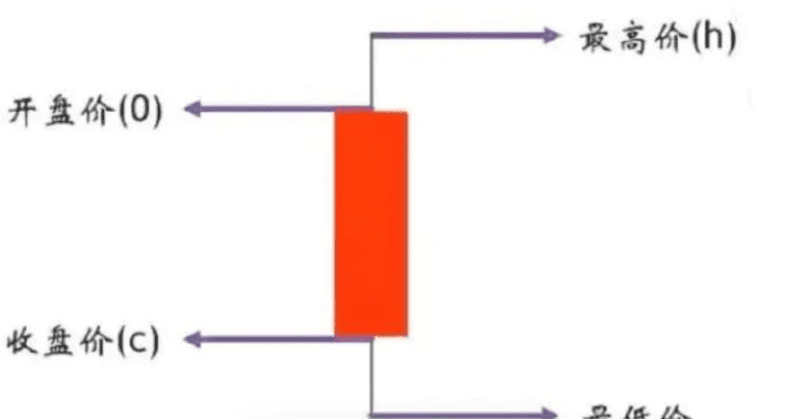
Bearish candlestick: When the closing price is lower than the opening price, the body is red, indicating a price drop; we call this a bearish candlestick.
Note: Since the crypto market trades continuously 24 hours, when the time unit is days, the opening price for the day is the closing price from the previous day. Different exchanges have different anchoring times; Huobi usually opens/closes at 00:00 AM, while some like OKEX open/close at 08:00 AM.
Highest price: The price at the highest point in the candlestick chart. When the lowest price
Lowest price: The price at the lowest point in the candlestick chart.
Each candlestick represents four prices for the day: the highest price, the lowest price, the opening price, and the closing price. The part between the opening price and the closing price is drawn as a 'rectangular body', and the highest and lowest prices are connected, forming the candlestick.
The six core strategies.
1. Crash: If a coin falls for 9 consecutive days, buy at the bottom on the 10th day (the limit of a washout by the market maker is 9 days).
2. Surge: If a coin rises for 2 consecutive days, it must reduce positions; remember—money in the crypto space is made by selling, not by holding.
3. Silence: A coin that remains flat for 6 days suddenly surges on the 7th day; follow up immediately (this is a signal before the main force starts).
4. Principle: If the coin you bought does not earn back the transaction fee the next day, cut your losses immediately! Time cost is the invisible killer.
5. The secret 'Three-Five-Seven Law': The third coin on the gain list will rush to the top five, and the fifth will definitely rush to the top seven. But 99% of people die waiting to break even...
6. The curse: A coin that rises for 4 consecutive days will definitely crash at 3 PM on the fifth day! This is the fixed routine of quantitative machines.
Dollar-cost averaging strategy: Regardless of price fluctuations, buy regularly, and the cost will naturally average out.
Long-term holding: Do not chase high prices, do not panic sell; holding is key to significant returns.
Risk management: Only invest what you can afford to lose, and do not use living expenses to enter the market.
From being empty-handed to earning a living through trading coins, I have summarized '15 iron rules for trading coins,' each is a gem of wisdom, worth its weight in gold; I recommend saving them!
Survival rules in the crypto space—those who can survive are the kings!


These rules may seem simple, but they are not easy to execute. Only those who can truly implement them can become the ultimate winners!
The above '15 iron rules for trading coins' are earned with real money from over a decade of trading. Each rule is essence; I genuinely feel they are useful and share them with everyone. I hope you can absorb them well in conjunction with your own operations and help you in the crypto space, avoiding years of detours!
The old trader only engages in real trading, and the team still has positions available, so hurry up to join.