BTC/USDT daily candlestick chart details with examples.
🔹 1. Chart Basics
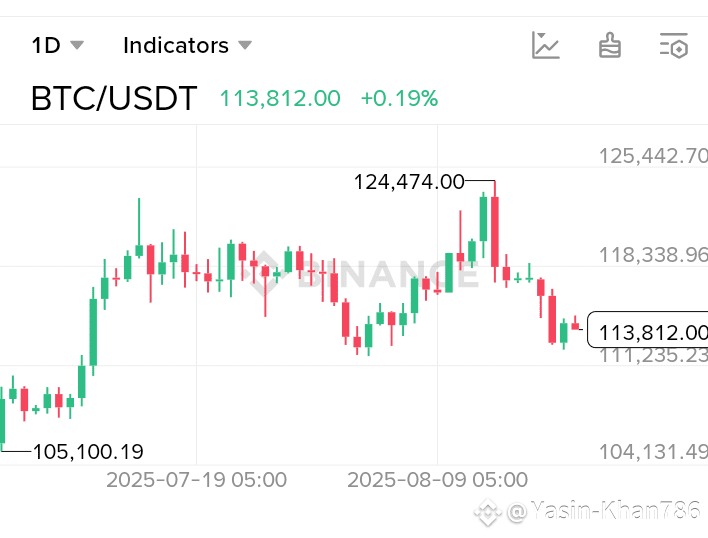
Pair: BTC/USDT (Bitcoin vs. Tether)
Timeframe: 1 Day (1D) → each candlestick represents 1 full day of trading activity.
Current Price: 113,812 USDT
Change: +0.19% (slightly positive today).
🔹 2. Important Price Levels in Chart
Lowest Point (Support): Around 105,100 USDT (on July 19, 2025).
Example: If someone bought here, they’d now be in profit since price is higher at 113,812 USDT.
Highest Point (Resistance): Around 124,474 USDT (on August 9, 2025).
Example: If someone bought near this top, they are currently at a loss of ~8.5% since the price dropped to 113,812.
Current Zone: 113,812 USDT → this is near the mid-range between recent support (105K) and resistance (124K).
🔹 3. Candlestick Patterns
Green candles = bullish days (closing higher than opening).
Red candles = bearish days (closing lower than opening).
Notice:
From mid-July → strong bullish rally (105K → 124K).
After Aug 9 → bearish correction (124K → 113K).
🔹 4. Trend Analysis
Uptrend Phase (July 19 – Aug 9): BTC climbed from 105K → 124K.
Correction Phase (After Aug 9): Price retraced back to 113K.
Currently: Price is consolidating (sideways movement with small candles) near 113K, which often signals market indecision.
🔹 5. Future Possibilities (Examples)
Bullish Scenario 🚀
If BTC holds support near 111K–113K and breaks above 118K, it may retest 124K or even push toward 125K+.
Example: A trader entering at 113K and selling at 124K would make ~10% profit.
Bearish Scenario 📉
If BTC fails to hold 111K, it could drop back toward 105K support.
Example: Someone buying now at 113K but stop-loss set below 110K would risk ~3%.
🔹 6. Trading Lesson
Support = buying zones (buyers step in).
Resistance = selling zones (sellers take profit).
Trend = your friend: In July → trend was bullish, good for long trades. Now → correction, so short-term traders may short or wait for reversal confirmation.
✅ Summary in Simple Words:
BTC rose from 105K → 124K, then corrected back to 113K. Right now, it’s consolidating, waiting for the next big move. If it breaks 118K, bullish momentum may return. If it drops below 111K, bearish pressure could bring it back toward 105K.
