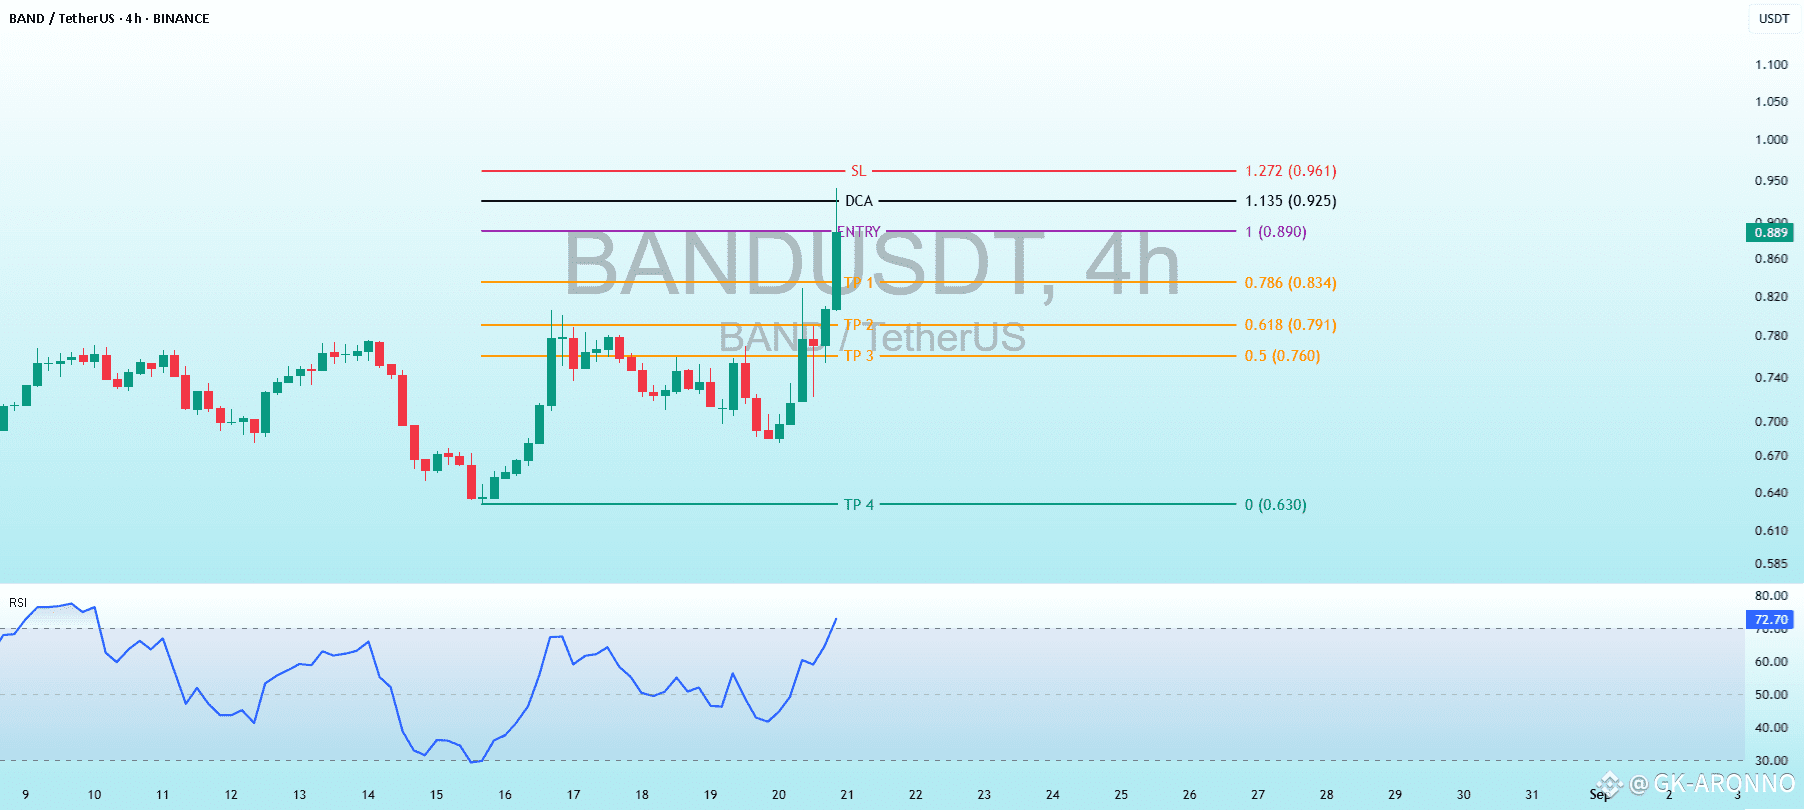
Support and Resistance:
SL (Stop Loss): 1.272 (0.961 USDT) – A potential level to exit if the price moves against the trade.
DCA (Dollar-Cost Averaging): 1.135 (0.925 USDT) – A level for adding to the position if the price drops.
ENTRY 1 ( 0.890 - 0.880 USDT)
TP1 (Take Profit 1): 0.786 (0.834 USDT)
TP2: 0.618 (0.791 USDT)
TP3: 0.5 (0.760 USDT)
TP4: 0 (0.630 USDT) – These are potential profit-taking levels if the price moves downward.
The chart shows a recent downward trend with a sharp drop, followed by a potential reversal or consolidation near the Entry level.
Technical IndicatorsRSI (Relative Strength Index): The bottom panel shows the RSI, which is currently around 72.13. This indicates the asset is in overbought territory (above 70), suggesting a potential reversal or pullback might occur soon unless bullish momentum continues.
Trading StrategyThe chart outlines a bearish strategy with multiple take-profit levels (TP1 to TP4) below the current price, indicating an expectation of further decline.
The Entry at 0.890 - 0.880 USDT suggests a short position or a buy-the-dip opportunity depending on the trader’s intent.
The DCA level at 0.925 USDT allows for averaging down if the price retraces upward slightly.
The SL at 0.961 USDT provides a risk management level to limit losses.
ObservationsThe price action shows volatility with significant red (bearish) candles recently, aligning with the bearish TP targets.
The RSI being overbought could signal a short-term correction, which might test the SL or DCA levels before continuing downward.