This paper studies the combination of deep learning models with financial data modalities, aiming to enhance the predictive performance of high-frequency trading strategies and portfolio optimization by processing limit order book (LOB) data. We propose a novel method of using limit order book snapshots as input image channels and applying embedding techniques to algorithmic trading. Experimental results indicate that this method achieves state-of-the-art performance in high-frequency trading algorithms, demonstrating the effectiveness of deep learning in financial applications.
1. Introduction
Algorithmic trading relies on extracting meaningful signals from various financial data sources, including candlestick charts, order books, trading volume data, limit order books, and news streams. Despite deep learning's significant success in handling unstructured data, its application in structured financial data still faces challenges. Limit order books (LOB) are a commonly used data modality in high-frequency trading, employed to extract the current market state and predict market dynamics for efficient market making. The core contributions of this paper include:
Treating limit order book data as a unique financial data modality and proposing several embedding techniques.
Designing high-frequency trading strategies based on limit order book data, focusing on the cryptocurrency market.
2. Data
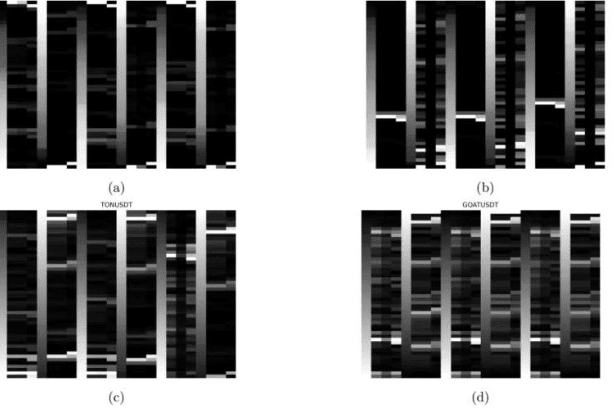
This paper uses limit order book snapshot data collected from the ByBit exchange for cryptocurrencies (such as BTC, ETH, SOL, etc.) over the time range from November 27 to 29, 2024. Each LOB snapshot contains the top 50 depths of sell (ask) and buy (bid) prices, along with the corresponding order volumes. Key data indicators include:
Spread: The difference between the minimum sell price and the maximum buy price.
Mid-price: Calculated using the formula
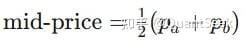
Calculation, where (p_a) and (p_b) are the best sell and buy prices, respectively.
3. Methodology
3.1 Data Sampling and Embedding Techniques
To convert LOB data into a format suitable for deep learning models, we propose the following key steps:
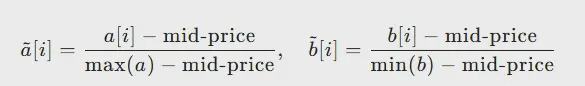
Price Normalization: Normalizing sell and buy prices to the range of 0 to 1, with the specific formula as follows:
Order Volume Normalization: Three normalization methods are used, including z-score normalization, global min-max normalization, and domain-specific min-max normalization. Domain-specific min-max normalization is ultimately chosen as it better reflects the distribution of order volume in the LOB.
Feature Enhancement: In addition to normalized prices and order volumes, global min-max normalized columns, price and order volume hierarchical widths, and other features were added to capture market changes.
.2 Data Aggregation Techniques
Aggregation Methods: Two aggregation methods are proposed:
Time Aggregation: Aggregating LOB snapshots at fixed time intervals (e.g., 1 second or 1 minute) to generate non-overlapping sequences.
Window Aggregation: Aggregating LOB snapshots using a sliding window to generate overlapping sequences.
Data Representation: Merging multiple LOB snapshots into a single two-dimensional image (merged method) or treating them as image channels (stacked method).
Prediction Target: Selecting to predict the change in mid-price or relative growth rate, with the specific formula as follows:

4. Experiment
4.1 Model Architecture
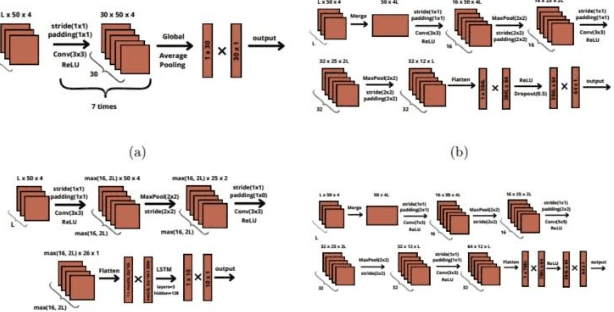
Four models based on convolutional layers are designed, including:
SimpleCNN: A simple convolutional neural network model.
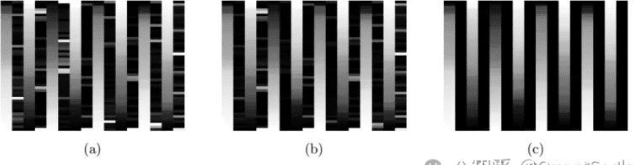
SimpleCNN 2D: A convolutional neural network model for processing merged sequences (see Figure 3a).
CNN2LSTM: A model that combines convolutional neural networks with Long Short-Term Memory (LSTM) networks for processing stacked sequences (see Figure 3b).
CNNModel 2D: A complex convolutional neural network model for processing merged sequences (see Figure 3c).
4.2 Trading Strategies
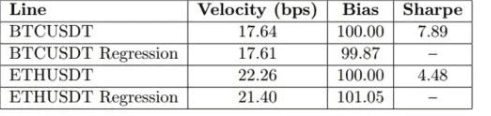
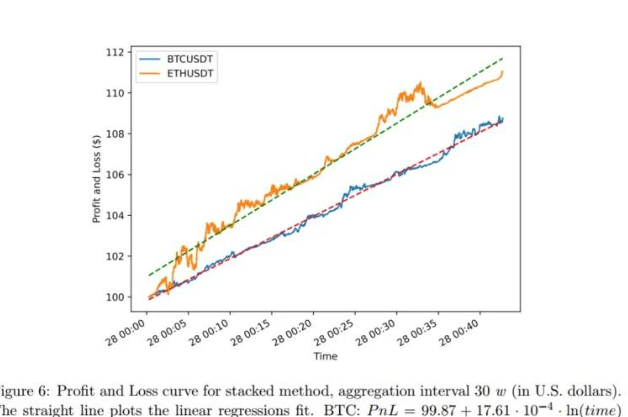
Using an Automated Market Making (AMM) strategy, placing both sell and buy orders based on the model-predicted mid-price while considering a price spread of 0.1 USD. The experimental results show that the strategy based on the CNN2LSTM model performs well, with a high Sharpe ratio and profit.
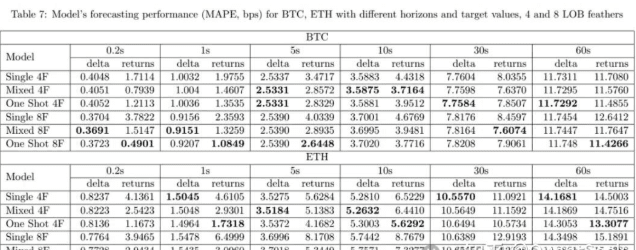
.3 Evaluation Metrics
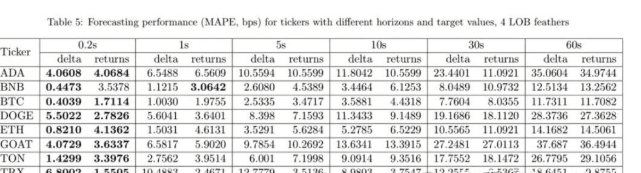
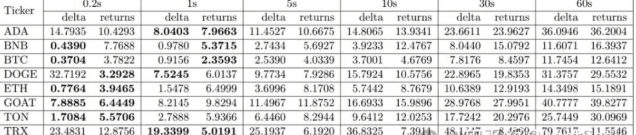
The model prediction quality is evaluated using Mean Absolute Percentage Error (MAPE), and the performance of trading strategies is assessed through Sharpe ratio, profit, and Maximum Drawdown. Experimental results indicate that predicting price changes (delta) is more suitable for short-term forecasts, while predicting relative growth rates (returns) is better for long-term forecasts.
5. Results and Discussion
5.1 Optimal Parameter Selection
Experimental results indicate that longer historical intervals can reduce MAPE values, while predicting price changes (delta) performs better in short-term forecasts. Additionally, increasing the number of LOB features (such as global normalization and price hierarchical width) can further reduce errors in certain cases.
5.2 Multi-Asset Training
Experiments show that aggregating LOB data from multiple assets into a single model for training (one-shot method) can significantly reduce prediction errors, especially in short-term forecasts.
BTC BTH


