Candlestick charts are one of the most important tools in trading. Whether you are a beginner or an advanced trader, understanding candlestick patterns will help you make better decisions in the crypto market.
---
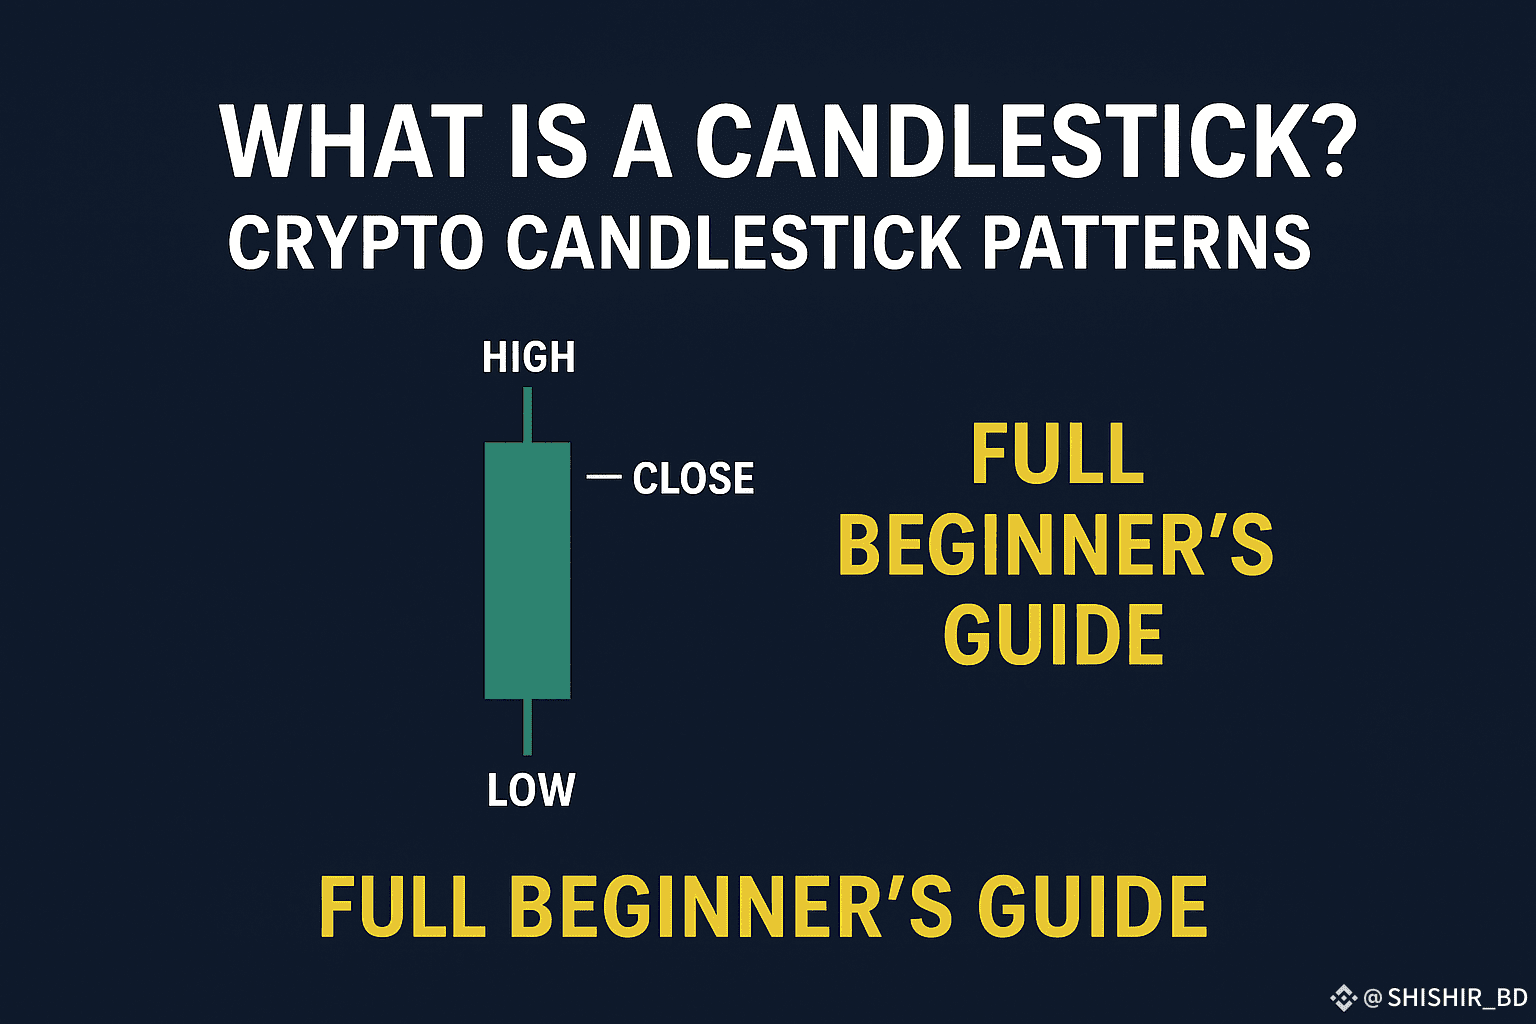
🔥 What is a Candlestick?
A candlestick represents price movement within a specific timeframe (1 minute, 1 hour, 1 day, etc.).
Each candlestick shows 4 key points:
1. Open Price → The price at the start of the period.
2. Close Price → The price at the end of the period.
3. High Price → The highest price reached.
4. Low Price → The lowest price reached.
✅ If the closing price is higher than the opening price → Bullish candle (Green/White).
✅ If the closing price is lower than the opening price → Bearish candle (Red/Black).
---
🟢 Basic Candlestick Types
1. Bullish Candle → Market going up, shows buying pressure.
2. Bearish Candle → Market going down, shows selling pressure.
---
📌 Most Important Candlestick Patterns
1. Doji
Looks like a “+” sign.
Open and close prices are almost the same.
Meaning: Market indecision (neither buyers nor sellers are in control).
Signal: Possible trend reversal or continuation.
2. Hammer
Small body, long lower shadow.
Appears after a downtrend.
Meaning: Buyers are entering the market strongly.
Signal: Bullish reversal.
3. Shooting Star
Small body, long upper shadow.
Appears after an uptrend.
Meaning: Sellers are pushing the price down.
Signal: Bearish reversal.
4. Engulfing Pattern
A big candle completely “engulfs” the previous candle.
Bullish Engulfing: Strong buying pressure.
Bearish Engulfing: Strong selling pressure.
5. Morning Star & Evening Star
Morning Star: Bullish reversal pattern (after a downtrend).
Evening Star: Bearish reversal pattern (after an uptrend).
---
🎯 Why Candlestick Patterns Are Important?
Help predict future price movements.
Show trend continuation or reversal signals.
Give traders confidence to enter or exit trades.
Used with other tools (Support/Resistance, Indicators, Volume) for better accuracy.
---
⚠️ Tips for Beginners
Don’t rely only on candlestick patterns → always confirm with volume and indicators.
Practice reading charts in demo trading before risking real money.
Look for candlestick patterns on higher timeframes (1H, 4H, 1D) for stronger signals.
#Crypto #CandlestickPatterns #CryptoTrading #BeginnerTrading #TradingTips #CryptoEducation #Binance #BTC #ETH #SOL
