🚀 ETH/USDT Technical Outlook – 4H Chart Analysis
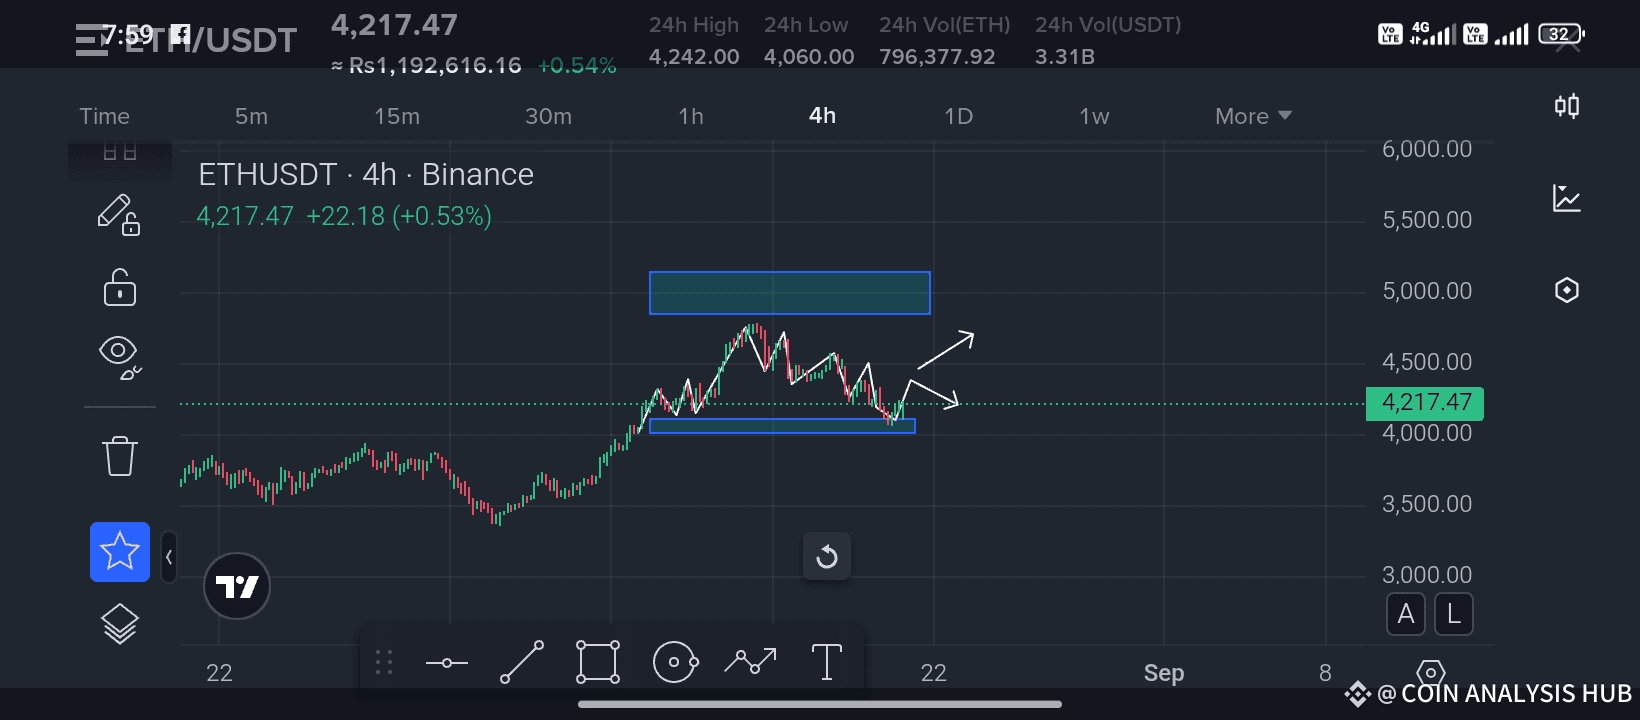
ETH is currently trading around $4,217, showing a mild recovery after retesting the support zone near $4,060 – $4,100.
📊 Key Levels to Watch:
🔵 Support Zone: $4,060 – $4,100 (holding strong so far)
🟦 Resistance Zone: $4,450 – $4,600
📈 Technical View:
After forming a double-bottom pattern near support, ETH is attempting to push higher. If price holds above $4,100, we may see another retest of the resistance zone. However, a failure to hold this level could trigger further downside pressure.
➡️ Bullish Scenario: Break and sustain above $4,300 could open doors toward $4,450 – $4,600.
➡️ Bearish Scenario: Closing below $4,060 may invite sellers, dragging price toward $3,800 – $3,900.
🔑 Tip: Always manage your risk! Wait for confirmation before entering trades, and don’t chase pumps—trade with levels and patience.
💡 If you like this analysis, drop your tips to support my work and keep the updates flowing! 🙌
Best of luck 🤞 🍀 🤞
