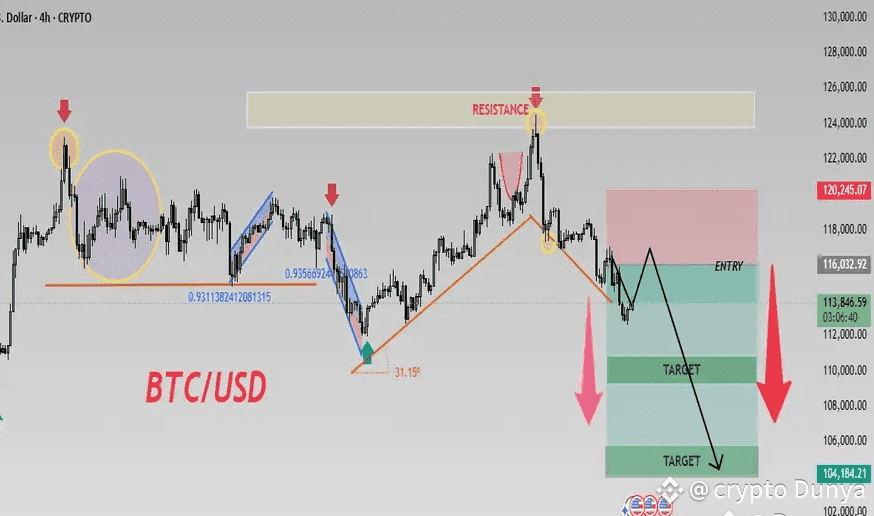
Bitcoin (BTC/USD) has hit a major resistance zone between $118,000 and $120,000 and faced multiple rejections, confirming strong selling pressure at this level, according to technical analyst Metral_Trade[1]. The chart clearly shows a bearish structure marked by lower highs and lower lows, alongside sharp impulsive drops with weak corrective rallies—a textbook sign of continued downside momentum.
Key trade levels are mapped out, with an entry zone just below resistance and profit targets set between $104,000 and $106,000. The current phase suggests a distribution pattern where sellers dominate unless bulls can break above $120,000 with significant volume[1].
The recommended strategy is to short near resistance and aim for these liquidity targets, with stop-losses above resistance to protect against false breakouts. Traders should prepare for more bearish action unless a major bullish reversal materializes.
This setup highlights a critical period for Bitcoin, where bears appear poised to maintain control in the near term.