How to determine if the correction is about to end?
There are many methods to determine if a short-term correction is about to end, such as analyzing from different angles like chip structure, financial pressure, emotional feedback, etc. Today I will share another method I often use and find very effective, which is to observe changes in the cost bases of different time groups as a reference.
Before discussing the logic, let's first look at a case study—judging the bottom of a large cycle.
In the chart below, 1, the blue line represents the average turnover cost of long-term holders (LTH-RPC), the red line represents the average turnover cost of short-term holders (STH-RPC), and the black line is the price of BTC.
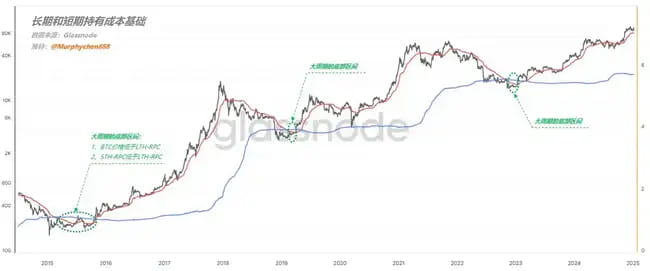
Friends, please pay attention to the area I circled with a green dashed line. As long as the following two conditions are simultaneously met:
- Condition 1: BTC price is below LTH-RPC
- Condition 2: STH-RPC is below LTH-RPC
This stage is the bottom range of the large cycle, and it is an excellent area for bottom-fishing!
The underlying logic is:
First, the BTC price has fallen below the LTH-RPC, meaning that the average long-term holders are all at a loss. This indicates that the current price is severely undervalued, and the market bubble has almost completely cleared.
Second, for the vast majority of the time, the longer-term chip relative cost is lower. Therefore, it is extremely rare for STH-RPC to fall below LTH-RPC.
This indicates that during the price decline, a large number of STHs incurred losses and left the market in the short term, but new STHs came in to bottom-fish; after frequent turnover, the short-term chip cost was pulled below the long-term chip cost. This is a signal of a phase of price overselling and that panic emotions have hit the bottom. According to the logic above, the same reasoning can also be applied to the judgment of the timing of bull market corrections.
In the chart below, 2 lists the chip costs: 1d-1w chip cost (red line), 1w-1m chip cost (yellow line), 1m-3m chip cost (blue line), 3m-6m chip cost (purple line)
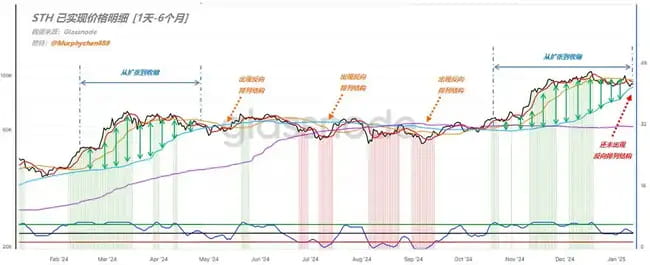
First, let's look at the period from February to May 2024, which is precisely the process of transitioning from a trend starting to decline and correct. The entire process is accompanied by the distance between the blue and red lines expanding to contracting (as indicated by the green arrow in the diagram);
Ultimately, the blue line has risen to the top, while the red line is at the bottom, meaning that the relative short-term chip cost is lower than the relatively long-term chip cost. I refer to this phenomenon as the 'reverse arrangement structure' of long and short-term cost bases.
I have marked three places in the chart with orange dashed lines, all forming a blue, yellow, red arrangement from top to bottom, or a purple, blue, yellow, red arrangement as a 'reverse arrangement structure,' corresponding to the relative bottom during the correction.
So the current trend is also transitioning from rapid expansion to gradual contraction, but the blue line is still below. If we want to see the market restart in the short term, it may require first forming a 'reverse arrangement structure.' However, after this period of turnover, the blue line is already very close to the red and yellow lines. As long as it consolidates for a while longer, the structure can form, meeting the conditions for a relative bottom.
PS: Of course, it would be best to form a 'reverse arrangement structure' of purple, blue, yellow, and red, but this will require a longer turnover time (at least 4-5 months).
Summary:
Using the changes in cost bases of different time groups as a judgment criterion for the timing of corrections, if the longer-term chips have relatively higher costs, once a 'reverse arrangement structure' of blue, yellow, and red is formed from top to bottom, it means sufficient turnover, emotions nearing the bottom, and the correction time is about to end.


