One, K-line Pattern: Bollinger Bands opening downward, 3950 USD becomes a 'meat grinder'
Bollinger Bands opening downward:
Bollinger Bands (BOLL) consist of the upper band, middle band, and lower band. When the opening is downward, it indicates that the market is in a one-sided downward trend, and volatility is expanding. On August 20, ETH's Bollinger Bands opened downward, indicating that bearish forces continue to suppress the price, which runs along the lower band, forming a typical downward channel.3950 USD is a key resistance level:
Previously, ETH fluctuated multiple times around 3950 USD but failed to break through effectively. This price level has become a short-term dividing line between bulls and bears. In the market on August 20, a large number of sell orders appeared near 3950 USD, and the price rebounded to this level but encountered selling pressure, forming a 'meat grinder' effect, continuously consuming bullish funds at this position.
Two, Technical Indicators: Clear bearish signals, weak rebound
MACD Indicator:
Data from August 20 shows that the MACD (Moving Average Convergence Divergence) DIF line (fast line) has been consistently below the DEA line (slow line), and the histogram (MACD bars) is expanding below the zero axis, indicating strong bearish momentum.
Previously, the MACD had shown a 'death cross' (DIF crossing below DEA), further confirming the short-term downward trend.
KDJ Indicator:
The J value of the KDJ (Stochastic Indicator) dropped below 20 on August 20, entering the oversold zone, but the K line and D line are still diverging downward, indicating that the short-term oversold condition has not triggered a rebound, and market sentiment is extremely pessimistic.
Historical data shows that ETH tends to spend a short time in the oversold zone, but this time the KDJ did not show a significant bullish divergence, and the rebound signal is weak.
RSI Indicator:
The 14-day Relative Strength Index (RSI) fell below 30 on August 20, nearing the oversold zone, but did not drop below 20 (extreme oversold line), indicating that although bearish strength is strong, bullish resistance is extremely low.
Three, Market Sentiment: Negative news accumulates, and bullish confidence collapses
Regulatory uncertainty:
The U.S. SEC's stance on cryptocurrency ETF approvals is inconsistent. Before August 20, market rumors suggested that the SEC might delay the final decision on the ETH ETF, resulting in a strong wait-and-see sentiment among institutional funds.
Although the EU (Markets in Crypto-Assets Regulation) (MiCA) classifies ETH as a 'technological asset,' the strict information disclosure requirements have increased compliance costs, and some project teams have chosen to suspend ETH-related operations.
Risk of technical vulnerabilities:
On August 19, a Layer 2 scaling solution was reported to have security vulnerabilities, leading to some ETH being locked, escalating market concerns over the security of the Ethereum ecosystem, and funds flowing into Bitcoin and other safe-haven assets.
Macroeconomic pressures:
Expectations of interest rate hikes by the Federal Reserve are rising, the dollar index is strengthening, and risk assets are generally under pressure. On August 20, Bitcoin (BTC) also fell over 5%, while ETH, being a highly volatile asset, saw a larger decline.
Four, Fund Flow: Bull liquidation wave surges, bears dominate the market
Contract market:
According to CoinGlass data, on August 20, the funding rate for ETH perpetual contracts turned negative, indicating that bears are paying interest to bulls, but bulls are still facing continuous liquidation.
Within 24 hours, the liquidation amount of ETH contracts exceeded 200 million USD, with the ratio of long liquidations reaching 85%, indicating that leveraged funds are exiting rapidly.
Spot market:
On-chain data shows that the inflow of ETH into exchanges surged on August 20, while outflows sharply decreased, indicating that investors are concentrating on selling spot, and institutional buying willingness is low.
Five, Market Outlook: Short-term weakness hard to change, pay attention to key support levels
Support Level Analysis:
If ETH falls below 3800 USD (previous low), the next support level may move down to 3600 USD (July 2025 low).
If it can rebound above 3950 USD and stabilize, it may alleviate short-term downward pressure, but it needs to break through 4200 USD (200-day moving average) to confirm a trend reversal.
Risk Warning:
Current market sentiment is extremely pessimistic, technical indicators show bears in control, and investors should be cautious of further downward risks.
It is advisable to pay attention to the Federal Reserve's policy direction, ETH ecosystem security events, and institutional fund flows to avoid blindly bottom-fishing.
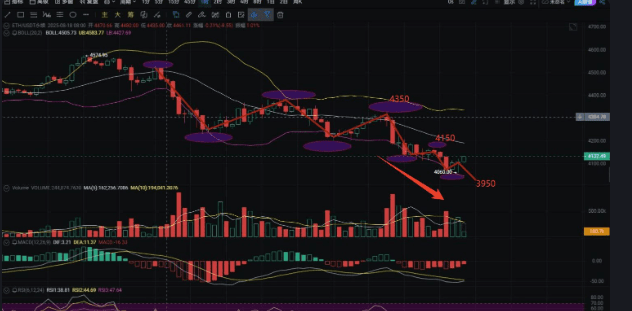
Price trend: Bollinger Bands opening downward, price sliding along the lower band, fierce competition between bulls and bears near 3950, the bullish side suffers a crushing defeat, a downward channel is formed, and the rebound is suppressed by the middle band, with rebound characteristics clearly showing short positions.
Volume situation: Red and green bars alternate frequently, the main force is 'quantum delivery', the MA5 volume line is suppressed, the 5-day average volume is below the 10-day average volume, bottom-fishing funds are waiting, and market sentiment is gloomy.
Technical indicators: MACD shows a 'death kiss', RSI suspected to be a 'local trap', bears are in control, and short positions are an opportunity if the rebound cannot break the middle band at 4100.
Operational Suggestions
Short-term traders: Playing with fire, set stop-loss below 3% of 3950 to prevent major capital loss.
Contract experts: Do not go long if not above 4100 on the 4-hour level; the trend is downward.
BTH BTC PEPE

