
Recently, the Dogecoin market has performed poorly, with the price adjusting downwards by 2% in the past 24 hours, erasing weekly gains and pushing the 7-day performance into negative territory. From the current market situation and on-chain indicators, Dogecoin seems to still face significant downward pressure, with the potential for even larger declines.
Price Corrections and On-chain Indicator Warnings
The price correction of Dogecoin is not an isolated event; several key on-chain indicators suggest that its downward space may not have hit the bottom yet. Among them, profit supply data and the dynamics of two key holding groups release potential bearish signals. If the market's key support levels are effectively broken, Dogecoin's price may further decline, with a potential drop of up to 15% from the current level.
Key Holding Group Reduction Situation
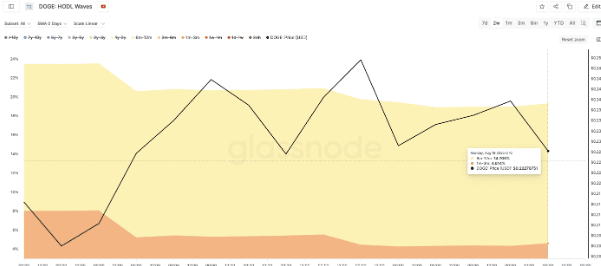
The HODL Waves indicator clearly reflects that two important Dogecoin holding groups are significantly reducing their positions:
6-month to 12-month holders: This group has seen a significant decline in holdings over the past two weeks, dropping from 15.46% to 14.705%. This indicates that some investors who entered during this period may be choosing to take profits or stop-loss due to concerns about market prospects or have already realized expected gains.
1-month to 3-month holders: This group's reduction is even more striking, with holdings dropping from 8.0% to just 4.614%. This sharp decrease in holdings over a short period reflects extreme pessimism among these investors regarding Dogecoin's short-term trend, prompting them to exit the market to avoid risks.
The reduction behavior of these two key holding groups has a significant negative impact on the Dogecoin market. The outflow of a large number of tokens increases selling pressure in the market, putting Dogecoin's price at greater risk of decline. In the current market environment, investors should closely monitor Dogecoin's price movements and the status of key support levels, making investment decisions carefully to prevent potential losses from substantial price declines.
Analysis Conclusion: The current Dogecoin (DOGE) market is under dual pressure of intensified short-term selling and declining confidence among medium to long-term holders, combined with historical patterns of high profit supply ratios, indicating further downward risks for prices. The following is the specific analysis:
I. Changes in Holder Behavior Revealed by HODL Waves
Medium to Long-term Holder Selling: HODL Waves data shows that medium to long-term holders (holding tokens for more than 6 months) are reducing their positions, indicating a decline in their confidence in the recent price recovery of Dogecoin. This shift occurs during price declines rather than after rebounds, suggesting that these holders may choose to cut losses or exit at the minimum return due to pessimism about future price trends.
Short-term Trader Behavior: The selling behavior of short-term traders (holding tokens for less than 1 month) may exacerbate market volatility. Their rapid entry and exit from the market may amplify the downward price trend.
II. Warning Signals of High Profit Supply Ratio
Historical Patterns: Based on historical data, when the profit ratio of Dogecoin's circulating supply exceeds 73%, the price often adjusts accordingly. This pattern reflects that after a certain level of profit accumulation in the market, investors tend to take profits, which triggers a price correction.
Current Situation: Currently, 76.95% of Dogecoin's circulating supply is still in profit. This ratio has exceeded the historical adjustment threshold, indicating that the price may face further downward pressure.
III. Market Sentiment and Future Outlook
Market Sentiment: Combining HODL Waves and high profit supply ratio data, it can be inferred that current market sentiment is leaning pessimistic. The selling behavior of medium to long-term holders may trigger panic among other investors, further exacerbating the market's downward trend.
Future Outlook: If market sentiment cannot be effectively improved and no new positive factors stimulate price increases, Dogecoin's price may continue to decline. However, the cryptocurrency market has high volatility and uncertainty, so price movements may also be influenced by other factors that could lead to reversals.
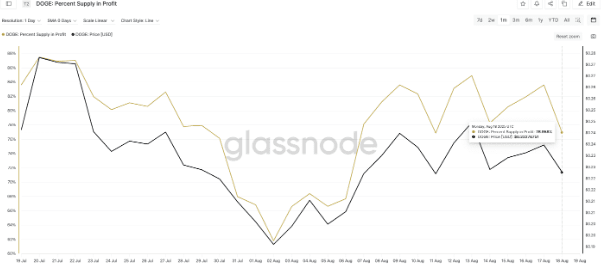
I. The Correlation between Profit Supply Percentage and Price Trends
Risk of Historical Pattern Repetition
When the profit supply percentage (i.e., the percentage of tokens currently priced above the holders' purchase price) falls to 61.79%, Dogecoin's price has historically rebounded.
The current profit supply percentage is at a high level of 76%, close to the historical peak range. This indicates:
Increased Selling Pressure: Short-term holders have a strong willingness to take profits, and if prices rise further, it may trigger concentrated selling.
Doubt about Support Level Effectiveness: If the profit supply percentage fails to fall back to a safe range (e.g., below 60%), the price may struggle to break through key resistance levels (e.g., $0.25).
Validation Role of HODL Waves
The reduction behavior of medium to long-term holders (holding for more than 6 months) resonates with the high profit supply percentage, reflecting the market's fear of 'missing the top.'
Historical data shows that when HODL Waves indicate a decrease in medium to long-term holder percentages, prices often undergo phase adjustments (e.g., from $0.48 to $0.13 in January 2024).
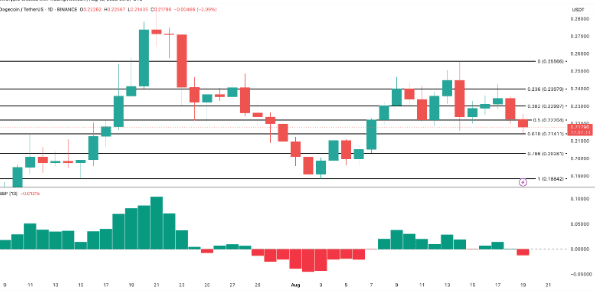
II. Current Price Technical Analysis: Key Support Levels and Bearish Targets
Short-term Support Level
$0.21: The current price is tightly close to this support level. If it effectively breaks down, it will confirm a fully bearish technical outlook.
$0.20: Secondary support level, but the market generally expects that after breaking below $0.21, the bearish target will shift to $0.18.
Bearish Targets and Decline Predictions
$0.18: The potential decline from the current price (about $0.21) is up to 15%.
In extreme cases, if market sentiment worsens, prices may test the $0.16-$0.15 demand area (near the November 2024 low).
Technical Indicator Signals
RSI (Relative Strength Index): The daily RSI is close to the oversold zone (below 30), but has not yet confirmed a bottom reversal signal.
MACD: The 4-hour MACD histogram remains negative, indicating weak bullish strength.
Bollinger Bands: The price is running close to the lower band, suggesting that short-term downward risks have not been fully released.
III. Dual Pressure of Market Sentiment and Capital Flows
Options Market Bets
Some institutions expect Dogecoin's price to reach $1.2-1.5 by the end of 2025 but require a market capitalization expansion to $51 trillion (exceeding the total of global gold and stock markets), presenting significant bubble risks.
The current market is more inclined toward short-term volatility trading rather than long-term value investment.
Spot and Derivative Data
Spot Net Flow: Recently increased slightly (e.g., $2.09 million on August 11), but the scale is insufficient to reverse the bearish trend.
Futures Trading Volume: Increased by 53.36% in the past 24 hours, but open contracts only increased by 12.68%, indicating insufficient bullish confidence.
Options Trading Volume: Doubled, but the top traders' long-short ratio is as high as 3.68, which may exacerbate price volatility.
IV. Operational Suggestions and Risk Control
Short-term Traders
Key Resistance Level: $0.2397 (breaking this price at the 4-hour close can confirm a short-term rebound).
Stop-loss Strategy: If the price falls below $0.21, it is recommended to stop-loss and observe, to avoid deep entrapment.
Medium to Long-term Investors
Wait for the Profit Supply Percentage to Decline: If the indicator drops below 60%, and HODL Waves show that the percentage of medium to long-term holders stabilizes, consider building positions in batches.
Focus on the Macroeconomic Environment: The cryptocurrency market is increasingly correlated with U.S. stocks and the U.S. dollar index, and caution is needed regarding the risk of synchronous declines in global risk assets.
Risk Warning
High Volatility: Dogecoin's 24-hour price fluctuations often exceed 10%, posing extremely high short-term risks.
Regulatory Uncertainty: The U.S. SEC's regulatory stance on meme coins may affect market sentiment.
I. Core Conclusions
The current Dogecoin market shows clear bearish signals, with the Bull-Bear Power (BBP) indicator turning negative, indicating that selling pressure exceeds buying power, along with retail selling and buyer exits. If the price falls below $0.21, the likelihood of bearish scenarios greatly increases; conversely, breaking above $0.23 will invalidate the bearish hypothesis.
II. Key Indicator Analysis
(1) Bull-Bear Power (BBP) Indicator
Indicator Principle: The BBP indicator (Elder Ray Index) measures the difference between price extremes and moving averages to assess the strength of bulls and bears. A positive number indicates strong bullish strength, while a negative number indicates dominance of bearish strength.
Current Performance: This indicator has turned negative, directly indicating that the selling power in the market exceeds the buying power. Combined with on-chain data, it further verifies that retail investors are actively selling Dogecoin, while potential buyers are on the sidelines, staying away from the market.
(2) Key Price Levels
Support Level ($0.21): This price level is an important support for the current Dogecoin price. If the price cannot hold this level, it means that bearish forces are strengthening, and market bearish sentiment will intensify, potentially leading to further price declines and opening up new downward space.
Resistance Level ($0.23): This price level is a key resistance for Dogecoin. If the price can successfully rebound and break through this level, it indicates that bullish forces are starting to dominate, and market sentiment will shift. The previous bearish hypothesis based on the BBP indicator turning negative and price trends will no longer hold.
III. Market Trend Assessment
(1) Short-term Trend
From the current situation, the BBP indicator has turned negative, and the price is testing the $0.21 support level, indicating a short-term market trend that leans bearish. Retail selling and buyer exits have increased market supply and reduced demand, putting downward pressure on prices.
(2) Long-term Trend
It is difficult to make a clear judgment on Dogecoin's long-term trend based solely on current information. Although short-term bearish trends are evident, the cryptocurrency market is influenced by various factors such as macroeconomic conditions, industry policies, and market sentiment. If significant positive factors emerge in the future, such as the expansion of Dogecoin's application scenarios and an increase in overall market capital inflows, it could change the current trend and drive prices upwards; conversely, if negative factors continue to accumulate, prices may fall further.
IV. Risk Warning
(1) Indicator Limitations
Although the BBP indicator can reflect the comparison of bullish and bearish forces, it should not be the sole basis for investment decisions. Market conditions are complex and variable, and other factors such as sudden events and market manipulation may cause the indicator to fail.
(2) Price Volatility Risk
The cryptocurrency market experiences extreme price volatility; even if prices break through key levels, false breakouts may occur. Investors need to set reasonable stop-loss and take-profit points when trading based on price levels to control risks.
(3) Overall Market Risk
The cryptocurrency market is still in its early development stage, with unclear regulatory policies and an immature market. Changes in policy, technical security issues, and other problems could have a significant impact on the entire market, leading to substantial fluctuations in Dogecoin's price. Investors should fully recognize these risks and make investment decisions cautiously.
BTC BTH PEPE

