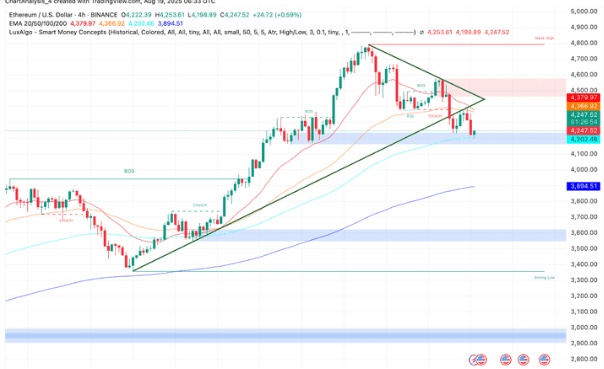
ETH's current price is close to 4245 USD, consolidating above the key support level of 4200 USD. The 4-hour chart shows it is in a pullback phase after breaking out of a triangular structure, and attention should be paid to the effectiveness of the 4200 USD support level.
Analysis of Key Support Levels
4200 USD Support Level:
The ETH price is currently maintaining above the 4200 USD support level, which is an important support level recently.
On the 4-hour chart, ETH has broken below its upward trendline but is currently consolidating near the 4200 USD support level.
The 100-day EMA is near 4200 USD and is being retested. If it closes below this level, it may face stronger downward pressure.
Other Support Levels:
If the ETH price fails to hold above 4200 USD, it may open a downward channel, with the next support level possibly around 4100 USD.
In a more pessimistic scenario, if bearish momentum accelerates, the ETH price may drop to around 3895 USD, which is where the 200-day EMA is located.
Market Dynamics and Influencing Factors
Technical Indicators:
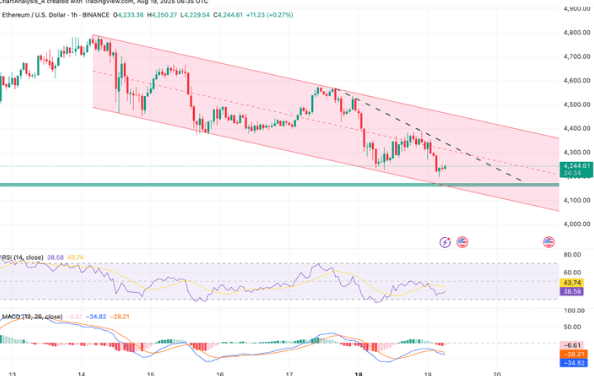
The RSI on the 4-hour chart is around 51, reflecting a neutral trend after being overbought last week. This indicates that ETH is consolidating rather than entering a confirmed reversal phase.
MACD remains negative but is flattening, indicating that bearish momentum is weakening. However, breaking through 4380 USD may trigger a rise towards 4500 USD, where stronger resistance will be encountered.
Market Sentiment and Trading Volume:
Traders are watching 4200 USD and 4380 USD as key levels for the next 24 hours.
In the past 24 hours, the ETH price has slightly risen by 0.6%, but changes in trading volume need further observation to confirm market direction.
External Factors:
Macroeconomic environment, monetary policy, inflation expectations, and other external factors may impact ETH prices.
Overall sentiment changes in the cryptocurrency market may also affect ETH's price trend.
Ethereum (ETH) Short-term Technical Analysis: Key Support and Resistance Battles, Market Sentiment Cautious
1. Core Conclusion: The market is weak in the short term, and the 4200 USD support level is the key defensive line.
Smart Money Concepts (SMC) indicators show that ETH experienced a 'Change of Character' (ChoCH) and 'Break of Structure' (BOS) earlier this week, indicating that short-term upward momentum is exhausted and the market has entered an adjustment phase.
The 4200 USD support level (100-day EMA) has become the focus of long-short battles; if it effectively breaks down, it may trigger further selling, targeting a drop to 3895 USD (200-day EMA).
The upper resistance level is at 4380 USD (20-day EMA); a short-term rebound needs to break this level to alleviate downward pressure.
2. Technical Analysis: Trends, Support, and Resistance
(1) Trends and Structures
4-hour chart trendline: ETH has broken below the upward trendline, confirming a short-term trend reversal from upward to consolidation or downward.
SMC Indicator Signals:
ChoCH (Change of Character): Indicates a shift in market sentiment from optimistic to cautious, with weakening bullish momentum.
BOS (Break of Structure): Confirms the formation of a short-term top, with bears taking the initiative.
(2) Key Support Levels
4200 USD (100-day EMA):
The current price is consolidating above this level, but if it breaks, it may trigger stop-loss orders and accelerate the decline.
The lower liquidity pool (as low points form) attracts sellers to attempt a 'stop-loss sweep', further testing the bullish defense line.
3895 USD (200-day EMA):
If 4200 USD is lost, this is the next important support level, but the probability of breaking it is low (requires extreme bearish catalysts).
(3) Key Resistance Levels
4380 USD (20-day EMA):
A short-term rebound needs to break this level to reverse the downward trend; otherwise, it may continue to oscillate downward.
4500 USD (Psychological Level):
If it breaks 4380 USD, the upper target looks towards 4500 USD, but it requires fundamental support (e.g., ETF approval, institutional buying).
3. Market Sentiment and Trading Logic
Buyer Caution:
Prices are consolidating near the support level, but the rebound strength is weak, indicating that bulls are unwilling to buy at high levels and are waiting for clearer signals.
Trading volume is shrinking, reflecting a strong wait-and-see sentiment in the market, lacking directional drive.
Seller Strategy:
Set stop-loss orders near 4200 USD; if it breaks, it may trigger a chain sell-off.
There may be bears adding positions near the upper resistance (4380 USD), suppressing the rebound space.
4. Potential Scenarios and Operational Suggestions
(1) Optimistic Scenario (Lower Probability)
Condition: ETH breaks the 4380 USD resistance level and holds above the 20-day EMA.
Target: Rise to 4500 USD, or even challenge historical highs.
Operation: Lightly test the long side, with stop-loss set below 4300 USD.
(2) Neutral Scenario (High Probability)
Condition: ETH oscillates in the 4200-4380 USD range, waiting for a decision on direction.
Operation: Buy high and sell low, range trading, with strict stop-loss.
(3) Pessimistic Scenario (Need to be Cautious)
Condition: ETH breaks below the 4200 USD support level and confirms the loss of the 100-day EMA.
Target: Drop to 3895 USD, or even lower.
Operation: Exit with stop-loss, avoid holding against the trend.
5. Risk Warning
Macroeconomic Risks: Federal Reserve interest rate decisions, inflation data, etc., may affect the performance of risk assets.
Regulatory Uncertainty: The SEC's stance on ETH regulation (e.g., whether it is classified as a security) may trigger volatility.
Market Sentiment Shift: Black Swan events (e.g., exchange hacks, fluctuations in mining pool hash rates) may lead to a liquidity crisis.
Conclusion: ETH is currently near a key support level (4200 USD), with intense long-short battles. If it breaks the support level, further declines may occur; if it holds the support and rebounds, it will need to break through the 4380 USD resistance to confirm a trend reversal. It is advised to remain cautious, strictly control risks, and wait for the market to clarify its direction.#比特币
BTC BTH

