Fundamentals: Yesterday was a mixed bag. The morning and afternoon market analysis were basically as expected, but the evening market analysis was disappointing, a complete failure. After calming down, I started reviewing and reflecting. Last night, the US stock market, gold, and the crypto market all experienced significant declines to varying degrees. NVIDIA plummeted 3.5%, dragging down the NQ index by 1.35%, and BTC closed down 2.89%. Looking at the market correlation, US Treasury bonds and the US dollar strengthened, and the market rushed to buy insurance and reduce risk asset positions, indicating a market mentality of: avoid risk first, then talk about the future. It's very similar to the classic 2008 model: the first action investors take is to "cut risk assets" and buy things that can save their lives. This indicates that the market is "deleveraging" rather than just emotional fluctuations. Because cryptocurrencies are often the assets with the strongest risk preference, if funds don't even want them, it means they are really tightening risk exposure. There are two risk events this week: the Fed meeting minutes at 2:00 AM on Thursday and Fed Chairman Powell's speech at the Jackson Hole annual meeting on Friday.
Technical Analysis:
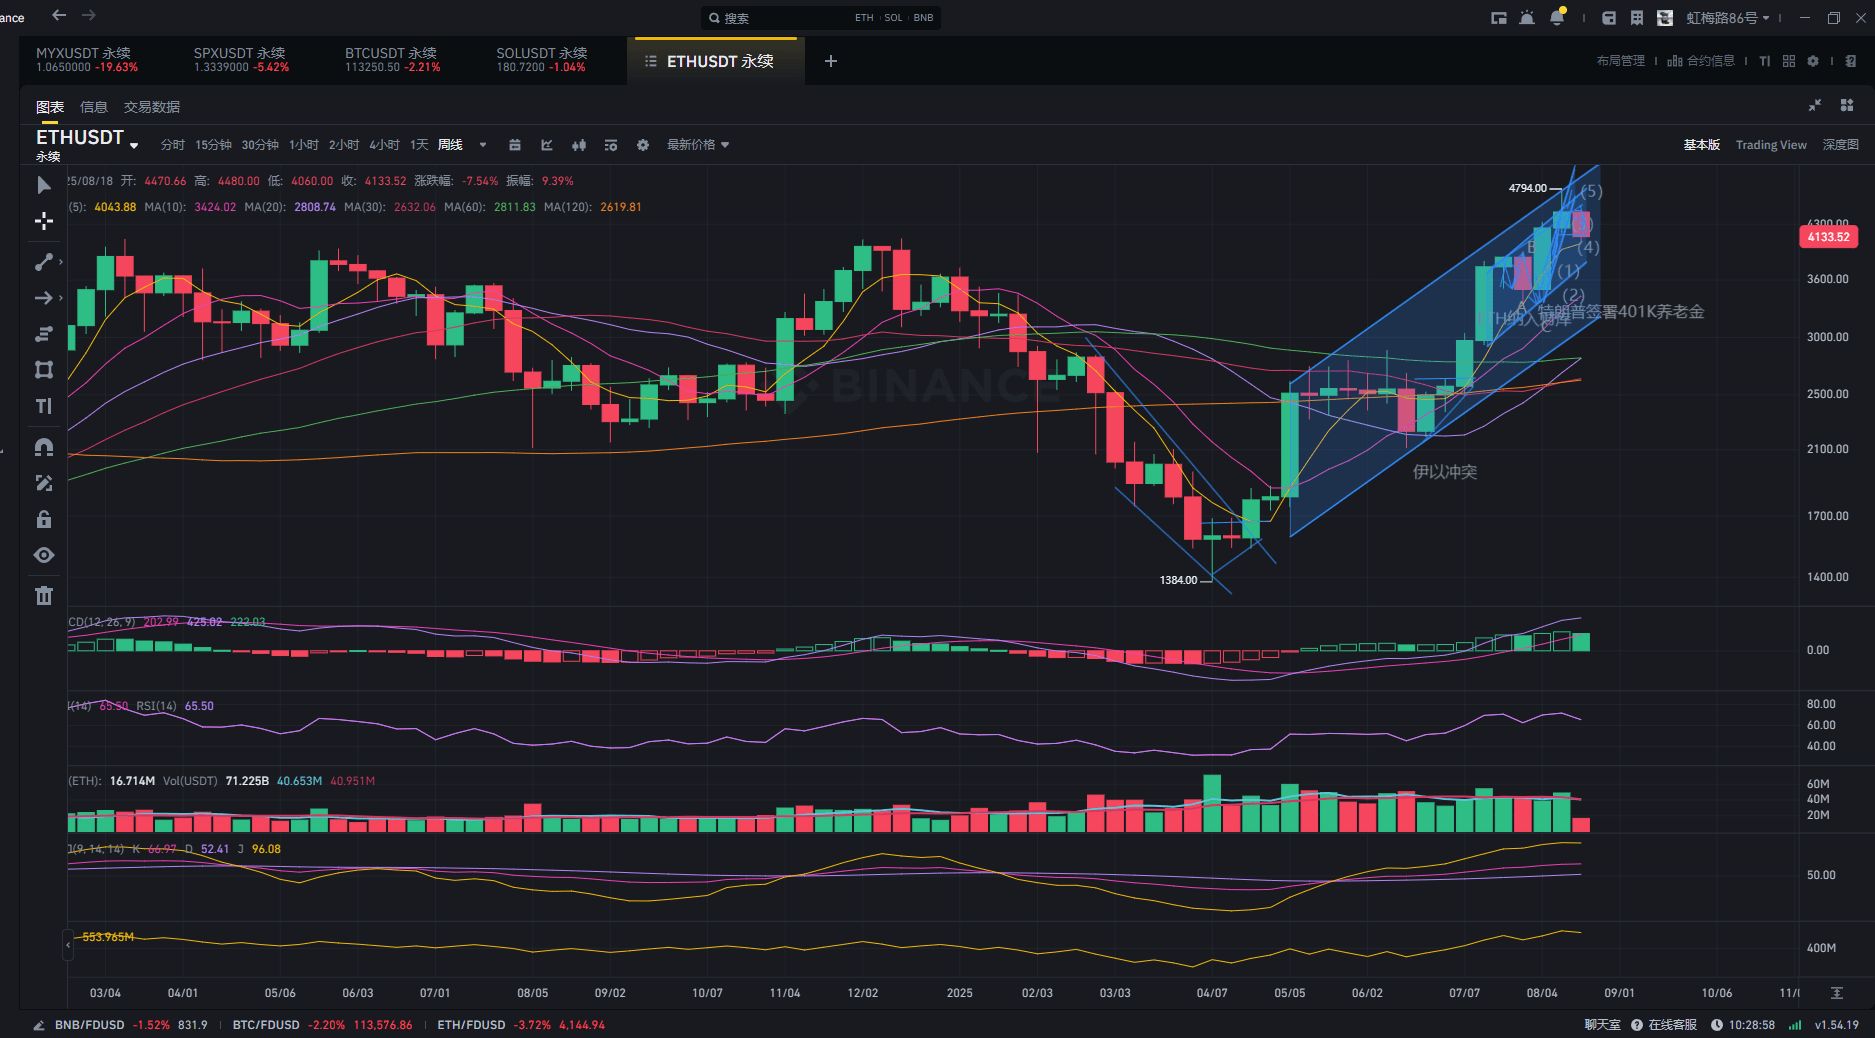
Weekly: The five-wave upward trend from 2111-4794 daily level has ended, basically confirming the end of wave 3 at the weekly level. So the market is now in a wave 4 correction at the weekly level. According to the alternating principle and retracement principle of Elliott wave theory, the wave 2 at the weekly level is a horizontal adjustment (expanding platform correction), then the wave 4 is likely to be a steep adjustment (almost always zigzag or a double three-wave starting from zigzag). Now the first zigzag ABC has come out, and the follow-up is double zigzag or double three-wave, which will be confirmed according to the rebound degree in these days. Price prediction: (1) According to the retracement principle, especially when the correction wave itself is the fourth wave, it often records its maximum retracement in the previous small one-wave level fourth wave movement area, mostly near its end point, and the daily level fourth wave movement area is 3353-3940. (2) According to Fibonacci percentage measurement, the support levels are 3770 (0.382) 3452 (0.5) 3135 (0.618). (3) Channel measurement: The current adjustment wave is too short. Connect wave 1 and wave 3 to draw a line parallel to it. Through these assumptions, the future ETH callback space may be relatively large. If it is a double zigzag, it will test the 3400-3800 support level. The intraday low has already reached 4060, but this position will rebound to confirm the upper pressure level.
Daily level analysis is based on the weekly level: a rebound from above 4000 to confirm whether it is a double zigzag or a triple three-wave pattern in the future, which will be analyzed in detail at that time.
I also reflected on the technical analysis last night: I didn't analyze the market trend based on chart patterns. In fact, the pressure trend line of the 2-hour line starting from 4575 has never been effectively broken. I only predicted the market based on the K-line morning star pattern and attached indicators, which lacked multiple confirmations and was a bit too left-side trading. Moreover, after the morning star appeared, there was indeed a rebound, but 4250-4280 was not a good entry point at all. I need to summarize and reflect to avoid making mistakes. It also has a bit of a metaphysical flavor. The past few days were too smooth, which led to a slight restlessness in my mentality and a lack of rigor.