Bitcoin (BTC) is currently fluctuating around $113,002, recording a slight correction as many short-term traders take profits. In a report released on Monday, the Bitfinex exchange stated that the largest cryptocurrency in the world may continue to move sideways until strong macro catalysts emerge, as investors remain patiently "waiting it out."
While some experts warn that BTC could drop deep into the $100,000 range, BitQuant's analyst offers a contrasting view. He asserts that Bitcoin remains on a growth trajectory, aiming for the $145,000 mark and is unlikely to fall to the $100,000 threshold as many pessimistic forecasts suggest.
The uncertain performance of Bitcoin in the short term is also putting pressure on many altcoins, especially Ether (ETH), which is currently trading at $4,097. According to data from SoSoValue, ETH spot ETF funds have just witnessed outflows of $196.7 million – the second-largest capital withdrawal since this product was listed.
However, the pessimistic sentiment does not completely dominate. Analyst Merlijn believes that ETH could potentially break out strongly, even rising above $8,000, describing this as "a new chapter in the history of Ether."
If Bitcoin bounces back from the support area, the altcoin market could witness a surprising reversal. Below is the technical analysis of five leading cryptocurrencies that are sending positive signals in the short term.
BTC Technical Analysis
BTC bounced from the neckline of the inverse head and shoulders pattern on Monday, but the bulls could not overcome the resistance at the 20-day exponential moving average (EMA) at $117,032.
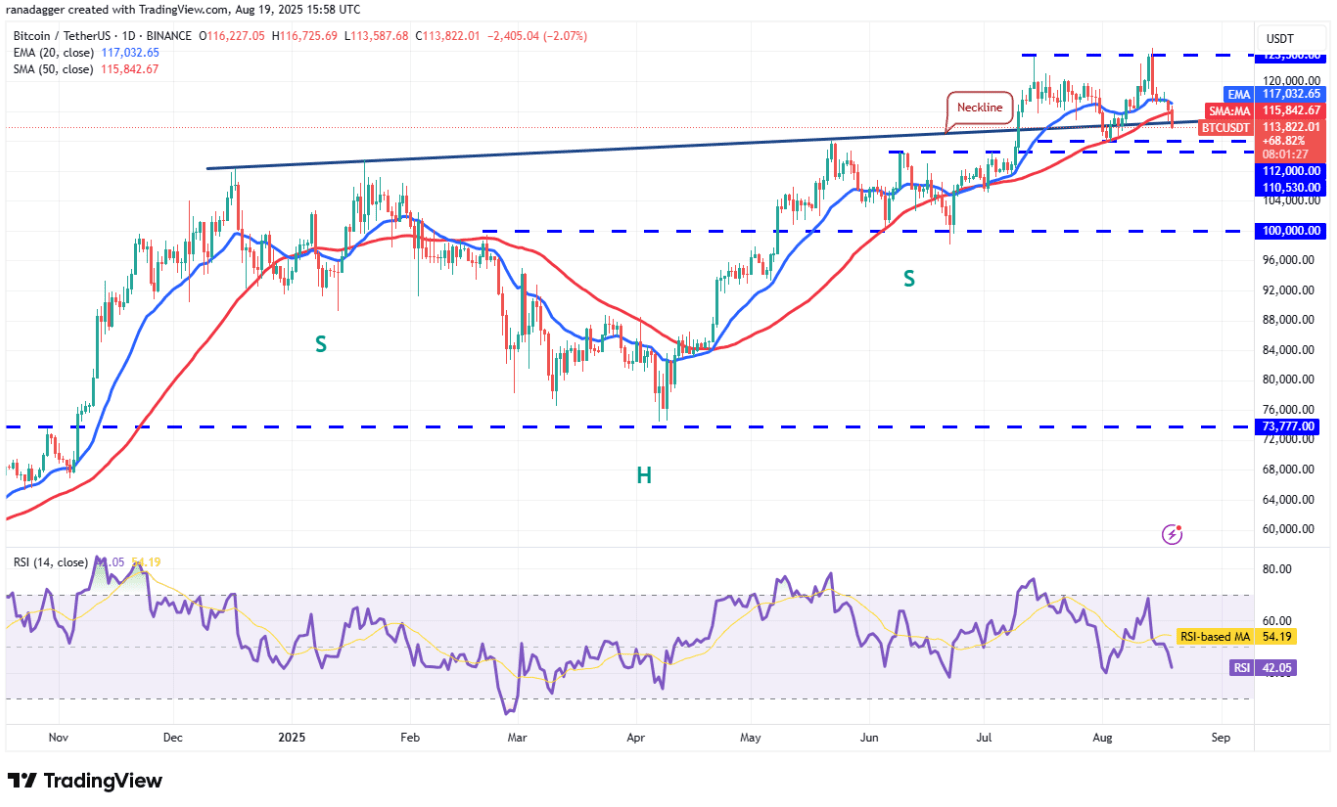
The bears returned to dominate on Tuesday and are trying to keep the price below the neckline. If successful, the BTC/USDT pair could drop deeply towards the important support area of $110,530. This is viewed as a crucial defensive line for the bulls, as breaking this threshold could accelerate selling pressure, driving the price down to $100,000.
A consolidation signal for the bulls will appear when the price breaks out and closes above the 20-day EMA. At that point, the BTC/USDT pair could advance to $120,000, potentially even reaching the historical peak of $124,474.
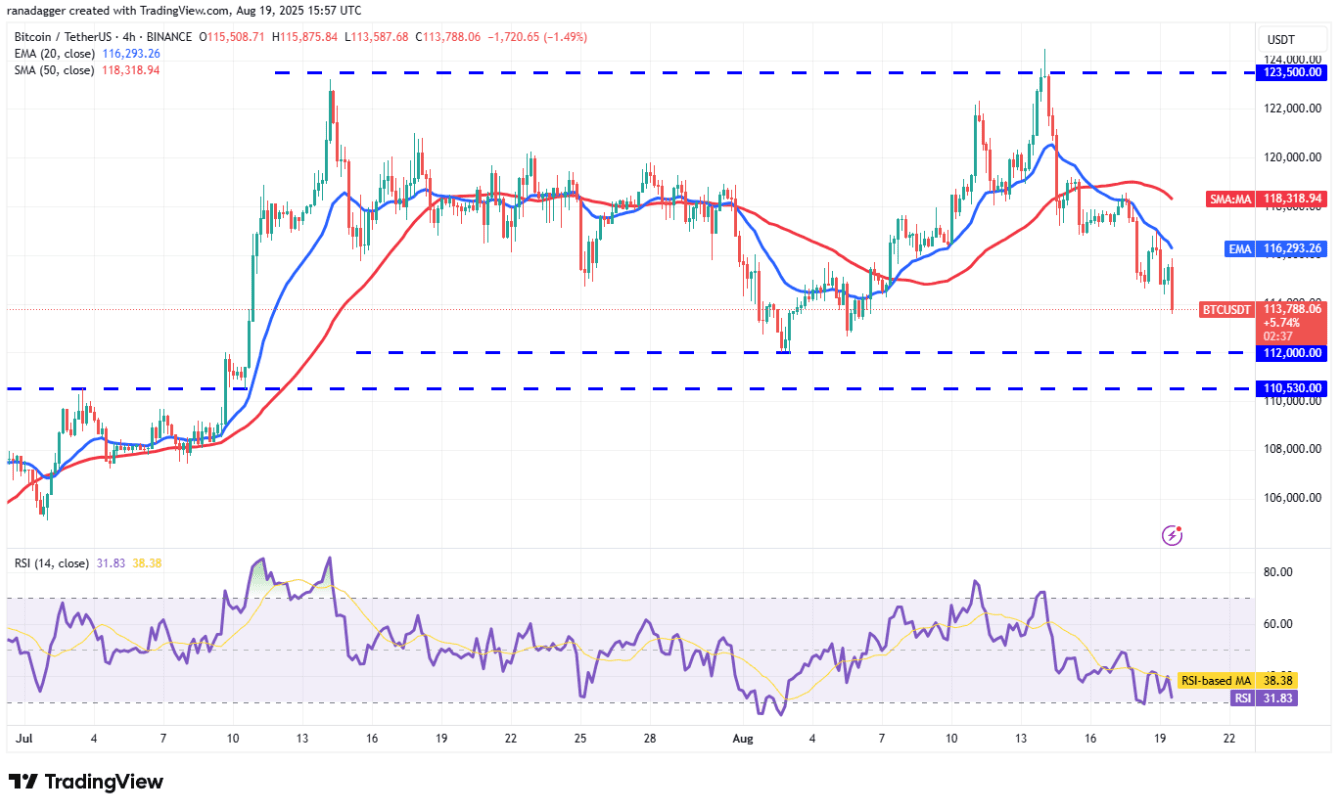
On the 4-hour chart, the 20-period EMA is sloping down, and the relative strength index (RSI) is in the negative zone, indicating a short-term advantage for the bears. Bitcoin could retreat to $112,000, a region expected to serve as strong support. If it bounces back from here and surpasses the moving averages, BTC could enter a sideways phase.
Conversely, if the price breaks through the support zone of $112,000 – $110,530, the correction pressure will increase, pulling BTC down to $107,000, even $105,000.
ETH Technical Analysis
Ether (ETH) has adjusted to the $4,094 area, a level considered a key boundary in the short term.
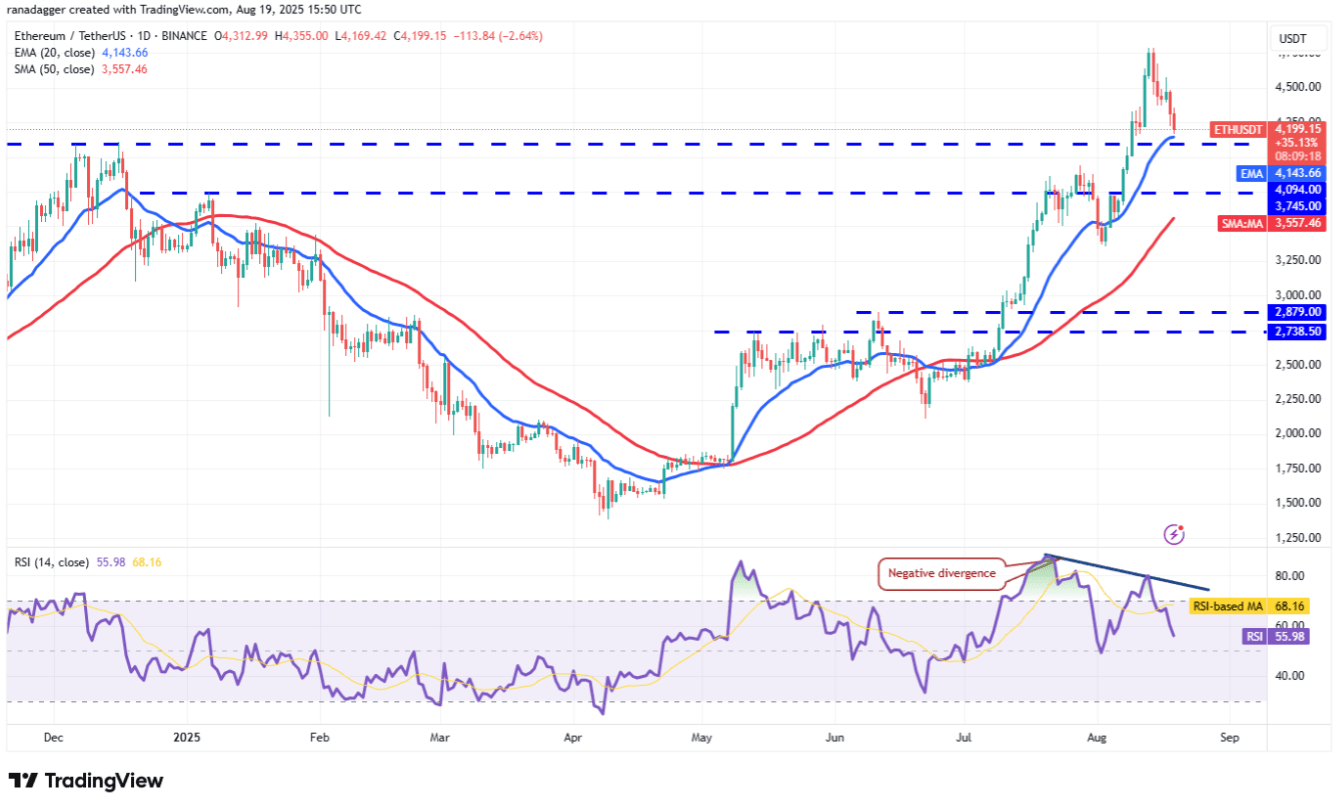
The moving averages are still trending upward, indicating an advantage for the bulls. However, the negative divergence signal on the RSI indicator warns that the upward momentum is weakening. If ETH bounces back from $4,094, the ETH/USDT pair could aim for $4,576, further towards $4,788.
Conversely, if the price continues to drop and breaks below $4,094, it reflects the fleeing sentiment of the bulls. This scenario could pull ETH back to $3,745, followed by the 50-day SMA around $3,557.
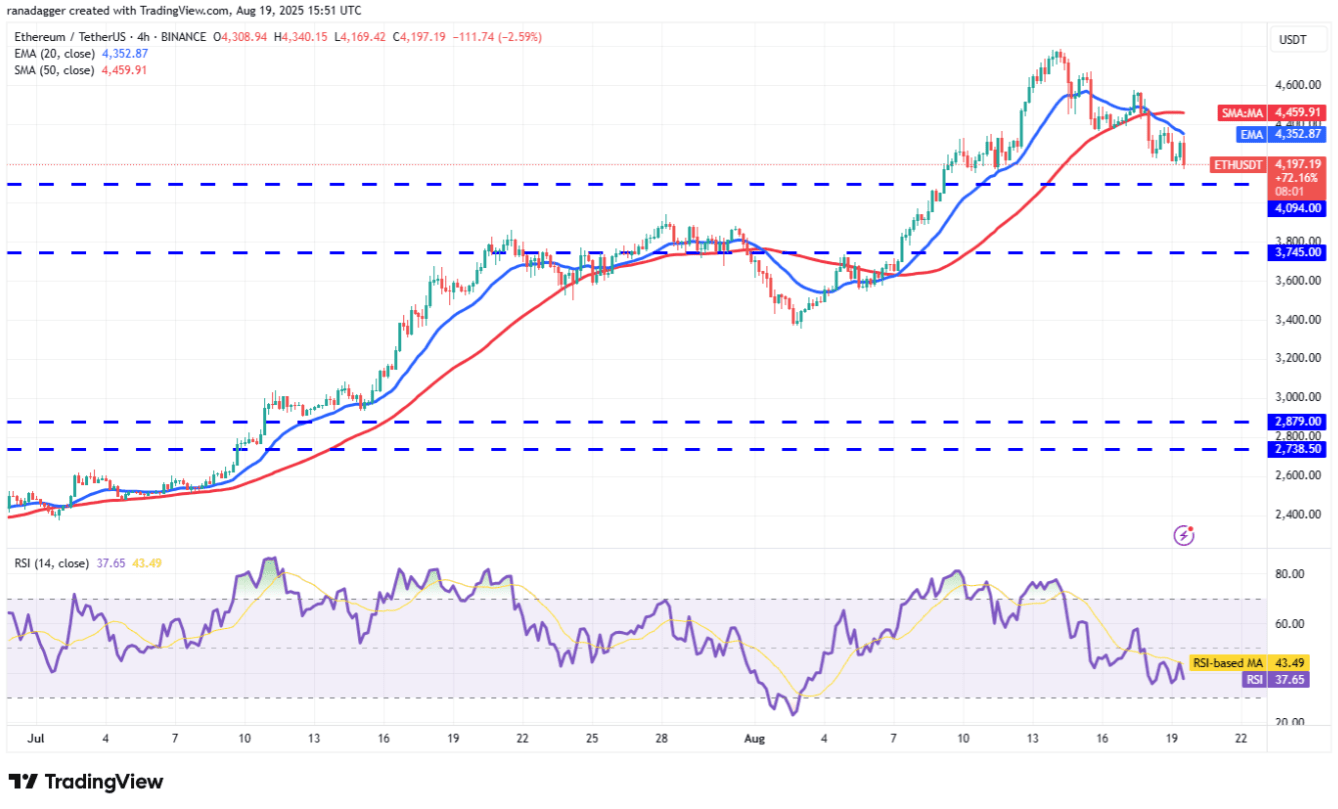
On the 4-hour chart, the moving averages have formed a bearish cross, while the RSI has fallen into the negative zone – a sign that the bears are returning. If the price closes below $4,094, selling pressure could push ETH down to $3,875 and then to $3,550.
In a positive scenario, if ETH bounces back from $4,094 and surpasses the 50-period SMA line, this indicates that the correction phase has ended, paving the way for a new increase towards $4,576.
BNB Technical Analysis
BNB is currently facing strong resistance in the range of $861 – $869. The positive point is that the bulls have not lost much advantage to the bears.
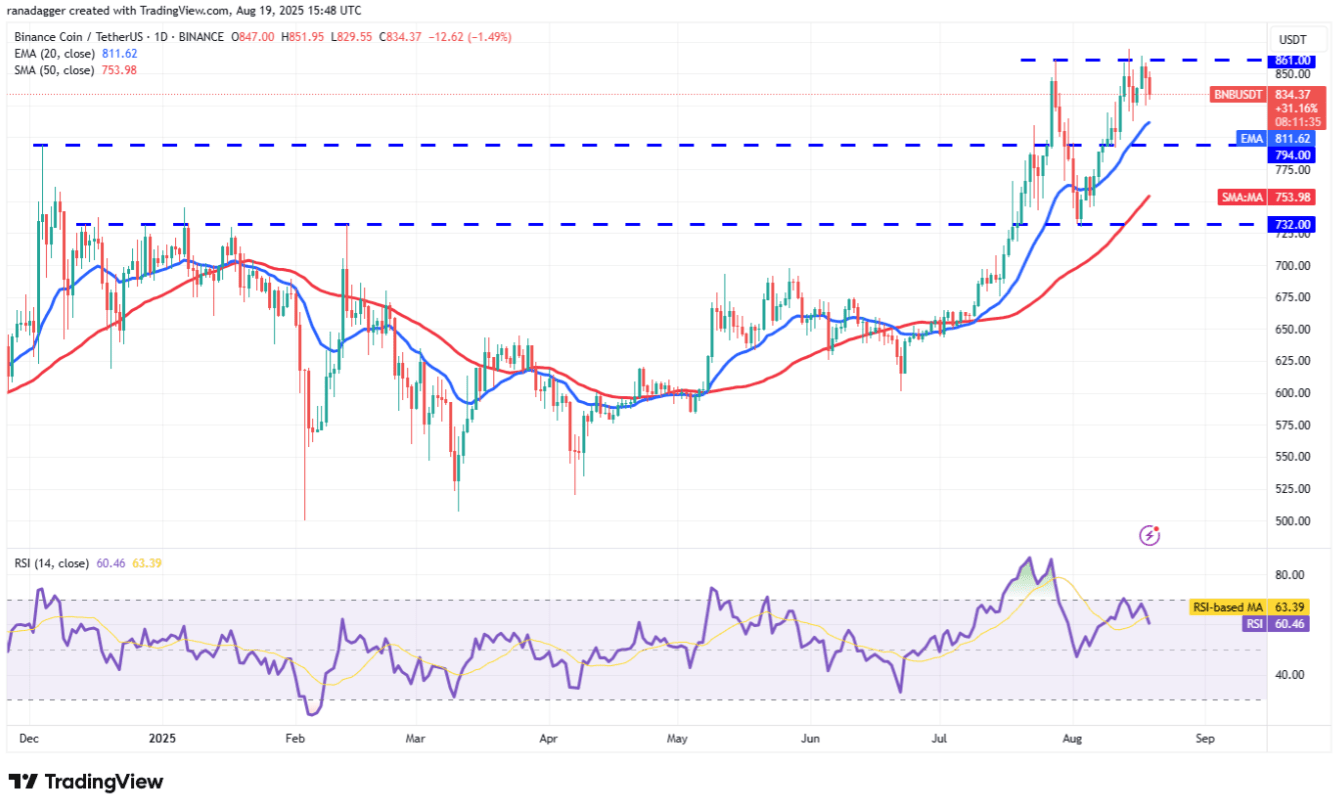
A shallow correction increases the likelihood that BNB will break through this resistance zone. If successful, the price could resume the upward trend, advancing to $900 and further to the psychological level of $1,000.
Conversely, the bears may attempt to pull the price below the 20-day EMA (811 USD). At that point, BNB/USDT could enter a sideways phase, fluctuating within the range of 732 – 869 USD.
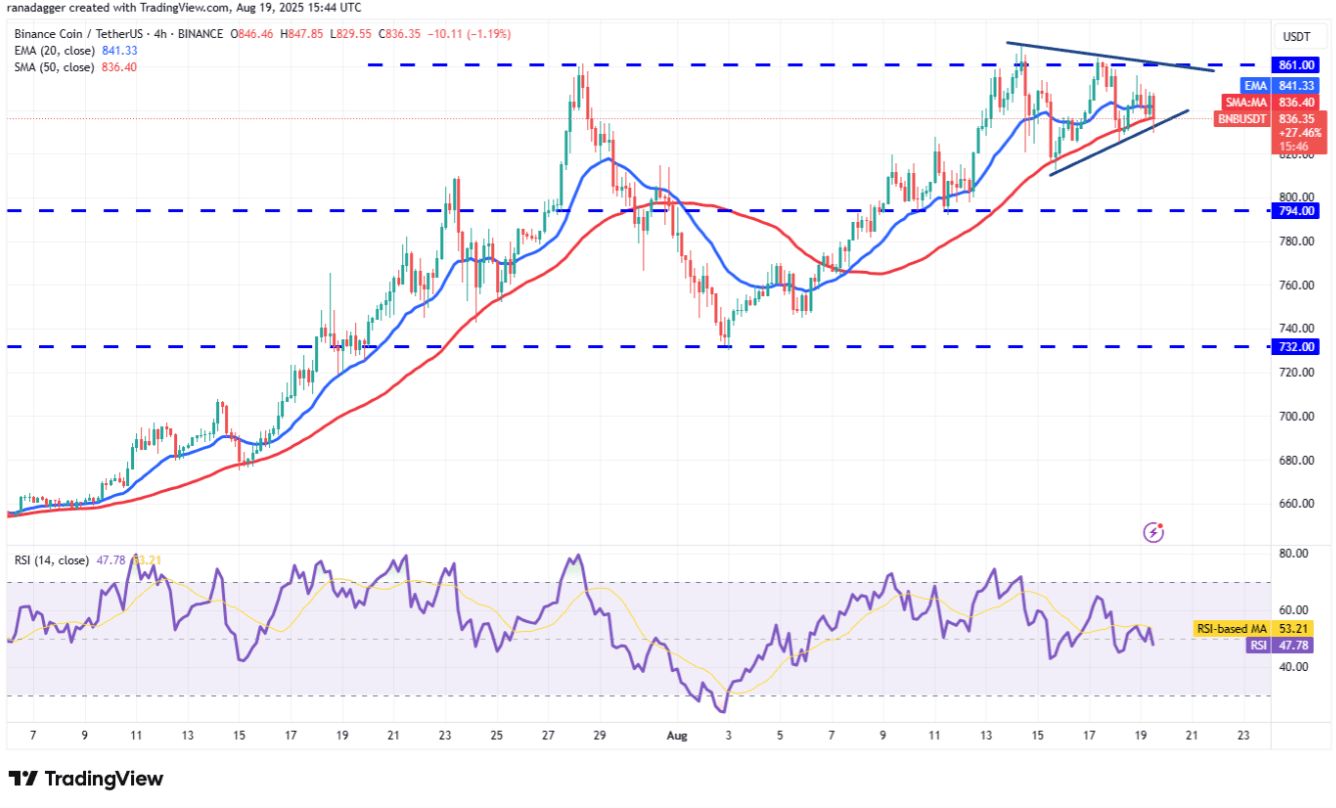
On the 4-hour chart, BNB has formed a symmetrical triangle pattern, reflecting a tug-of-war between the bulls and the bears. If the price breaks out and closes above the triangle, it indicates that the bulls have gained the upper hand, opening up an opportunity to rise to the target area of $918 according to the pattern.
On the contrary, if the price breaks through the lower edge of the triangle, the correction trend could deepen, pulling BNB down to $812, even $794.
LINK Technical Analysis
Chainlink (LINK) has turned down from the resistance area of $27 on Monday, indicating profit-taking by short-term investors.
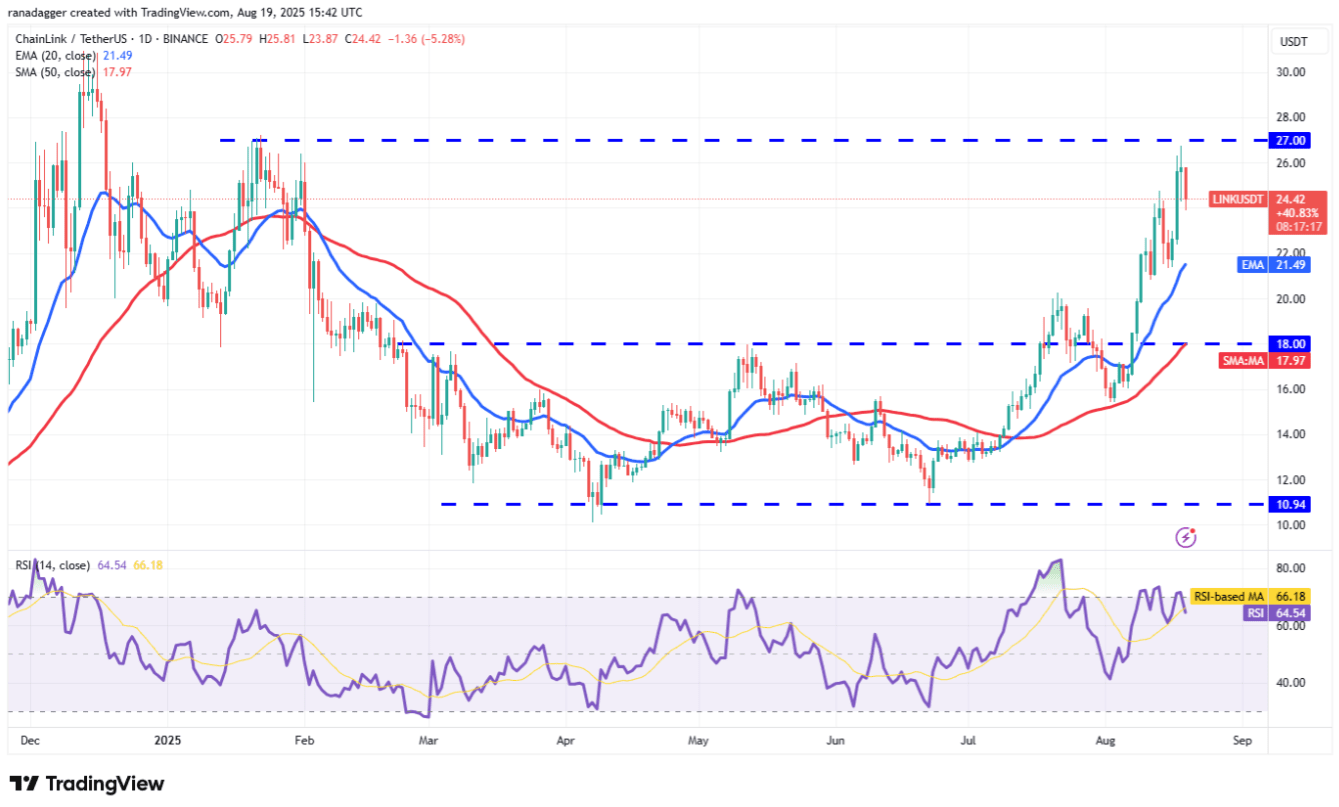
The first support level is at $24, followed by the 20-day EMA at $21.49. A strong bounce from the 20-day EMA will signal a buy when the price corrects. In this case, the bulls may once again test the resistance level of $27. If successful, the LINK/USDT pair could accelerate towards $31, and further to $36.
On the contrary, if the price turns down and breaks below the 20-day EMA, it will indicate that the bulls are losing their advantage. At that point, the price of Chainlink could fall back to the 50-day SMA at $17.97, where buying support is expected to emerge.
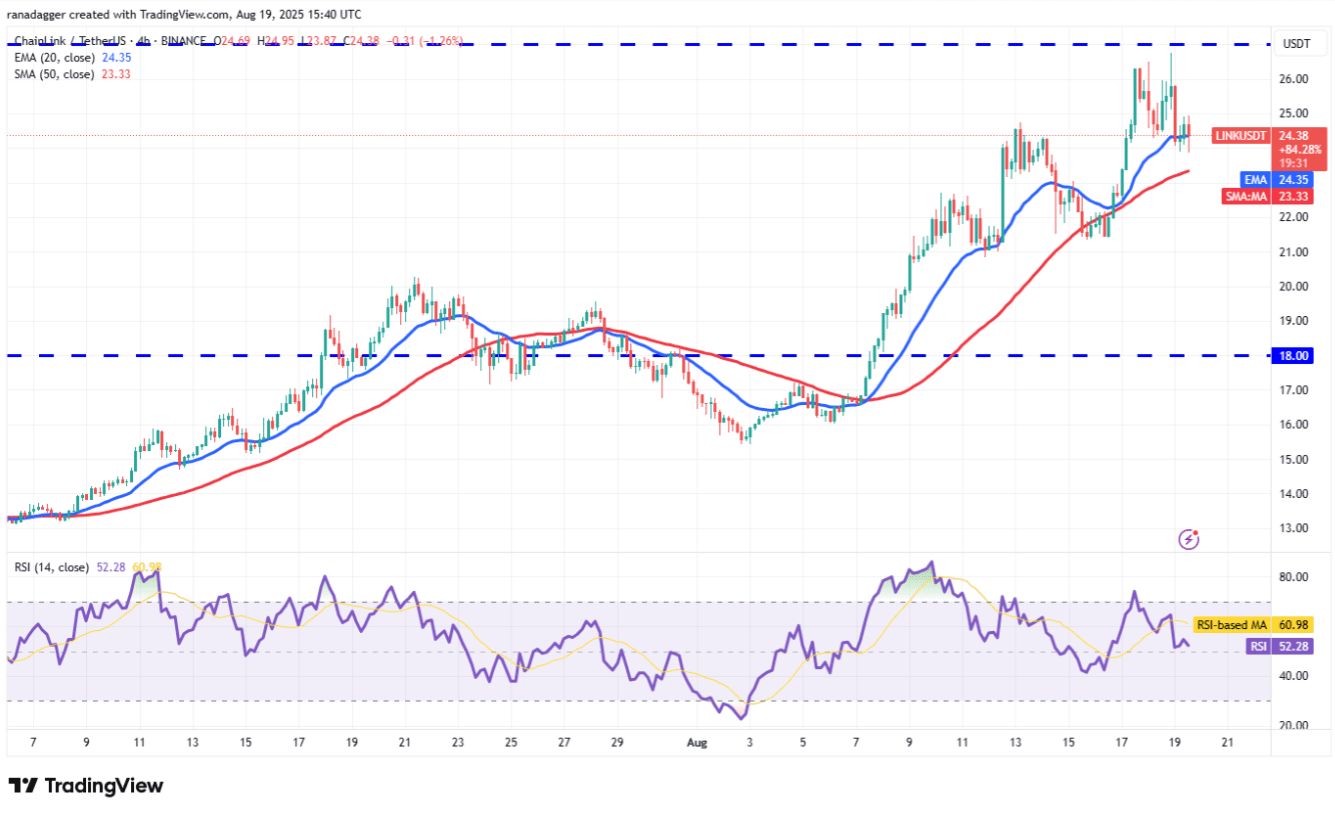
On the 4-hour chart, the bulls are trying to halt the correction at the moving averages. If the price strongly bounces from these lines, the currency pair may retest the resistance level of $27. A breakout and close above the $27 mark will signal the resumption of the uptrend.
However, the positive scenario will be invalidated in the short term if the price falls below the 50-period SMA line. At that point, Chainlink could drop to $21 – a critical level to watch closely.
MNT Technical Analysis
Mantle (MNT) has surged in the past few days, reflecting strong buying pressure from the bulls.
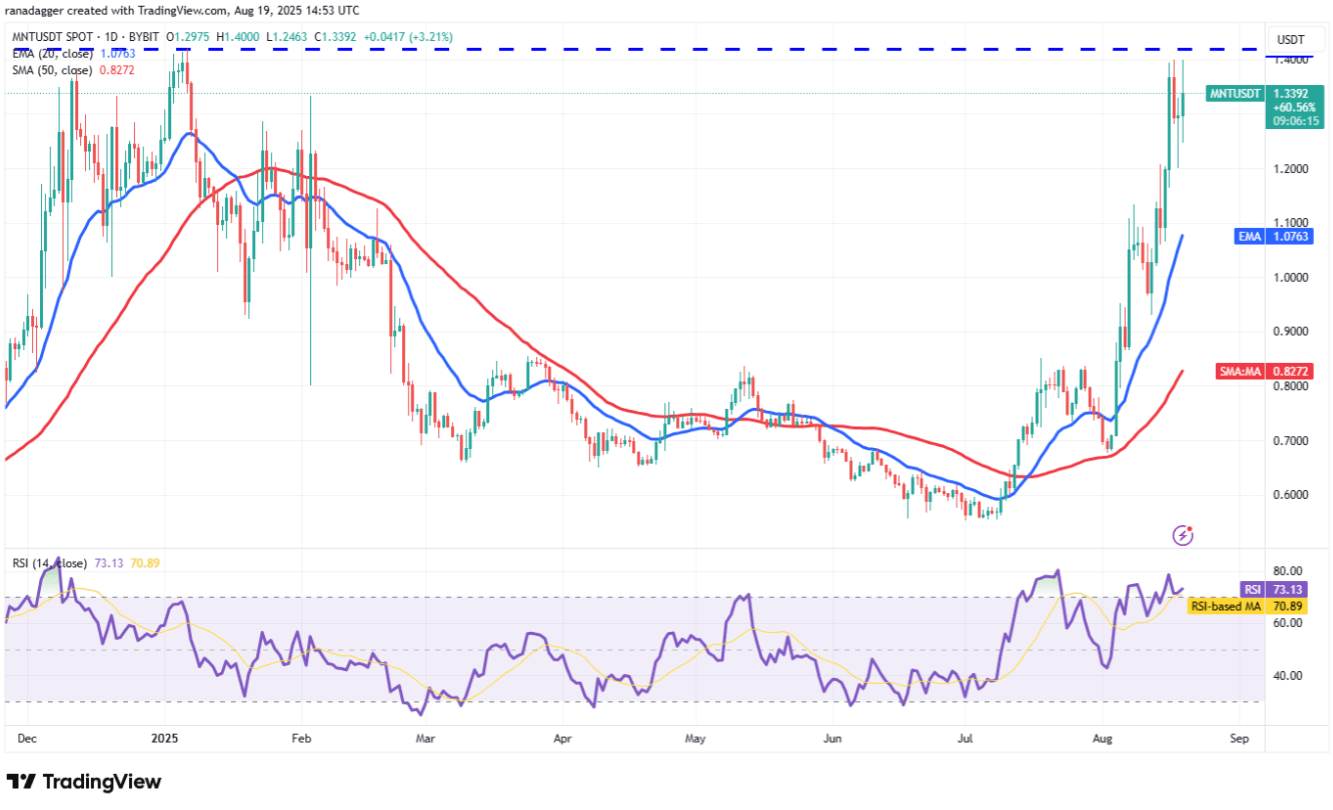
The bears had attempted to stop the upward momentum at $1.42 but could not pull the price below $1.20. This indicates that market sentiment is positive, as each decline is seen as a buying opportunity. Currently, the bulls are looking to extend the uptrend by pushing the price above $1.42. If successful, the MNT/USDT pair could break out to $1.67, with a temporary resistance at $1.51 – likely to be broken.
Conversely, if the price turns sharply down from $1.42 and breaks below $1.20, it will reflect a massive liquidation by the bulls. At that point, the Mantle price could fall to the 20-day EMA at $1.07.
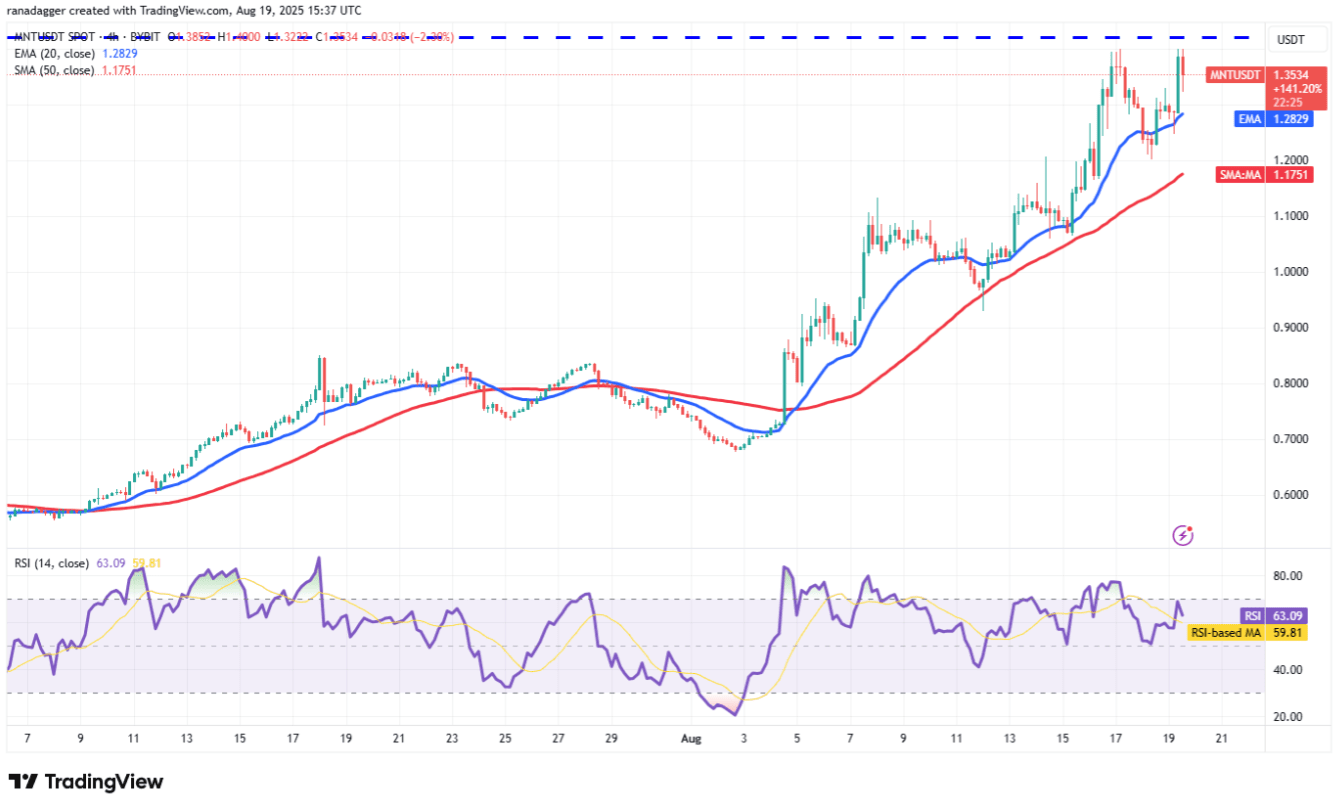
On the 4-hour chart, the MNT/USDT pair has bounced up from the 20-period EMA, but the recovery momentum has encountered selling pressure at the resistance area of $1.42. If the price continues to weaken and breaks through the 20 EMA line, the correction could extend down to the 50 SMA line. A short-term trend reversal signal will appear if support at the 50-period SMA is broken, at which point the Mantle price could slide down to $1.06, even $0.93.
Conversely, if the price reverses upwards and surpasses the $1.42 mark, the trading pair could enter the next upward phase, targeting $1.50.
